AVAX: Approaching ResistanceTrade setup : Price is in an uptrend. Following a bullish break above $43 key level, price has reached our near-term target of $50 for a +15% gain. This is where price got rejected in late 2023, which makes it a significant resistance level. Now we look for the right entry opportunity in Uptrend. We wait for price to either 1) break above $50 to signal continuation of uptrend, with + 30% upside potential to $65 next, or 2) pull back near $43 support for another swing trade entry in Uptrend with +15% upside potential back to $50.
Trend : Uptrend across all time horizons (Short- Medium- and Long-Term).
Momentum is Bullish (MACD Line is above MACD Signal Line and RSI is above 55).
Support and Resistance : Nearest Support Zone is $35 (previous resistance), then $25. The nearest Resistance Zone is $40 - $43, which it broke, then $50 and $65.
Avalanchetether

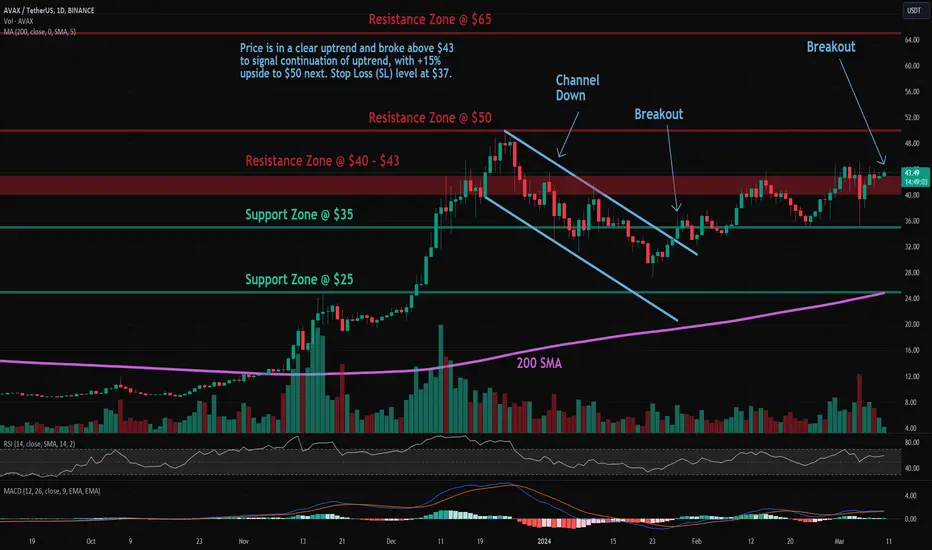
AVAX: Resistance BreakoutTrade setup : Price is in a clear uptrend and broke above $43 to signal continuation of uptrend, with +15% upside to $50 next. Stop Loss (SL) level at $37.
Trend : Uptrend across all time horizons (Short- Medium- and Long-Term).
Momentum is Bullish (MACD Line is above MACD Signal Line and RSI is above 55).
Support and Resistance : Nearest Support Zone is $35 (previous resistance), then $25. The nearest Resistance Zone is $40 - $43, then $50 and $65.
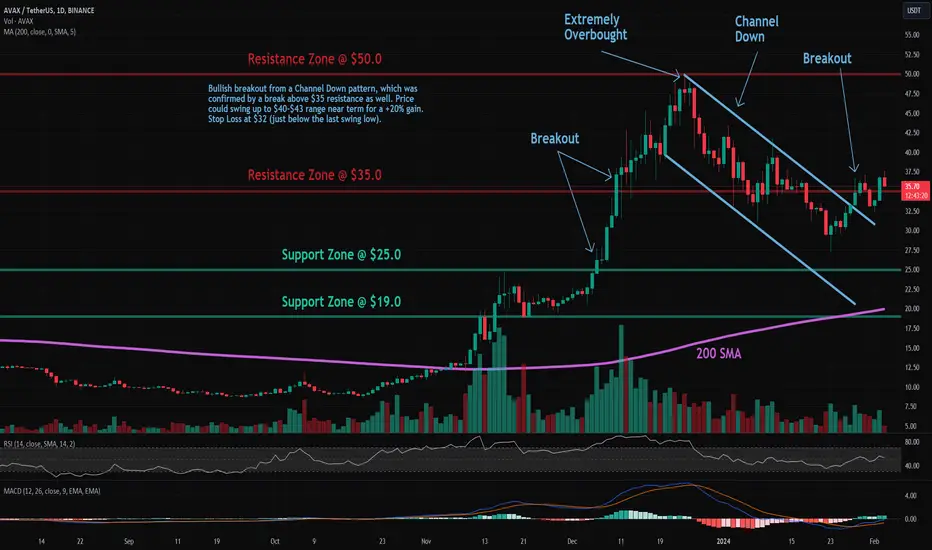
AVAX: Channel Down BreakoutTrade setup : Bullish breakout from a Channel Down pattern, which was confirmed by a break above $35 resistance as well. Price could swing up to $40-$43 range near term for a +20% gain. Stop Loss at $32 (just below the last swing low).
Pattern : Price was trading in a Channel Down pattern. With emerging patterns, traders who believe the price is likely to remain within its channel can initiate trades when the price fluctuates within its channel trendlines. With complete patterns (i.e. a breakout) – initiate a trade when the price breaks through the channel’s trendlines, either on the upper or lower side. When this happens, the price can move rapidly in the direction of that breakout.
Trend : Neutral on Short-Term basis and Uptrend on Medium- and Long-Term basis.
Momentum is Mixed as MACD Line is above MACD Signal Line (Bullish) but RSI ~ 50 (Neutral). MACD Histogram bars are declining, which suggests that momentum is weakening.
Support and Resistance : Nearest Support Zone is $25, then $19. The nearest Resistance Zone is $35, then $50.
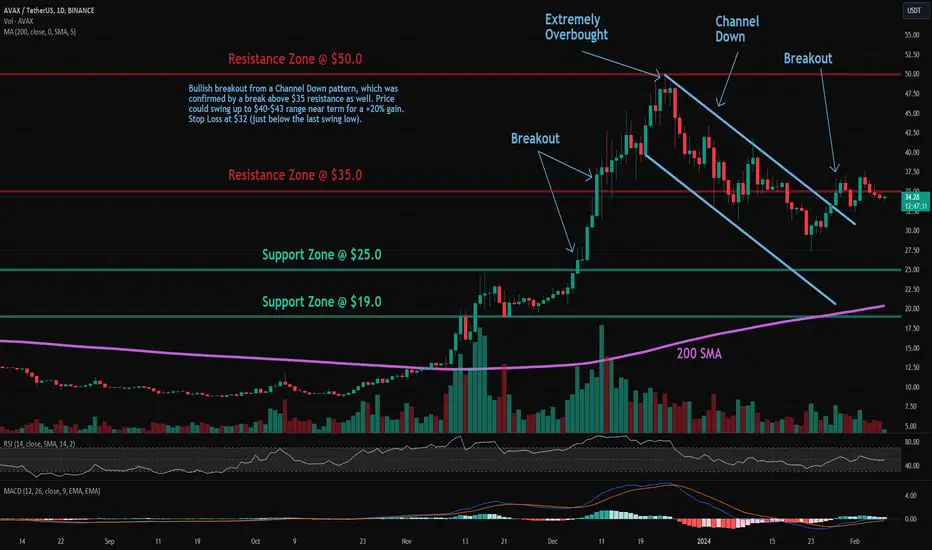
AVAX: Channel Down BreakoutTrade setup : Bullish breakout from a Channel Down pattern, which was confirmed by a break above $35 resistance as well. Price could swing up to $40-$43 range near term for a +20% gain. Stop Loss at $32 (just below the last swing low).
Pattern : Price was trading in a Channel Down pattern. With emerging patterns, traders who believe the price is likely to remain within its channel can initiate trades when the price fluctuates within its channel trendlines. With complete patterns (i.e. a breakout) – initiate a trade when the price breaks through the channel’s trendlines, either on the upper or lower side. When this happens, the price can move rapidly in the direction of that breakout.
Trend : Neutral on Medium-Term basis and Uptrend on Short- and Long-Term basis.
Momentum is Mixed as MACD Line is above MACD Signal Line (Bullish) but RSI ~ 50 (Neutral).
Support and Resistance : Nearest Support Zone is $25, then $19. The nearest Resistance Zone is $35, which it broke, then $50.
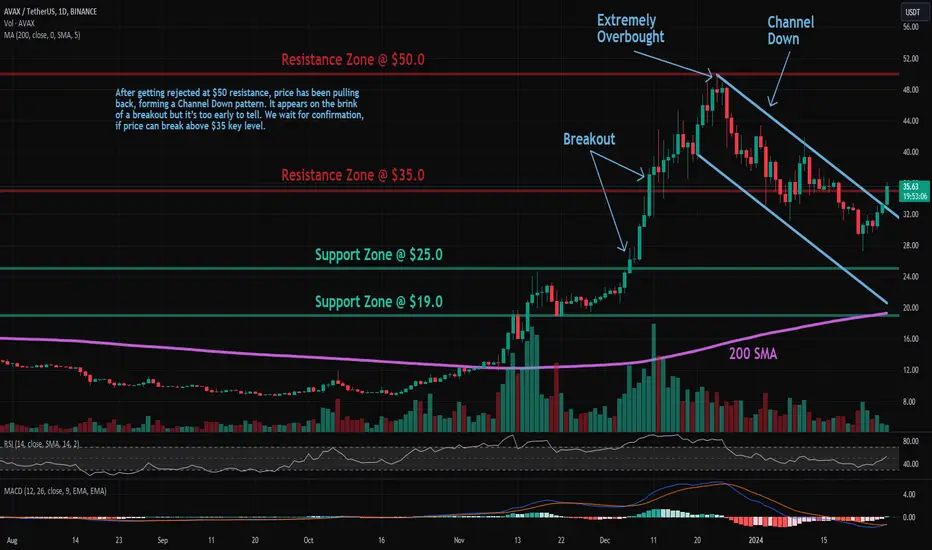
AVAX: Channel DownTrade setup : After getting rejected at $50 resistance, price has been pulling back, forming a Channel Down pattern. It appears on the brink of a breakout but it’s too early to tell. We wait for confirmation, if price can break above $35 key level.
Pattern : Price is trading in a Channel Down pattern. With emerging patterns, traders who believe the price is likely to remain within its channel can initiate trades when the price fluctuates within its channel trendlines. With complete patterns (i.e. a breakout) – initiate a trade when the price breaks through the channel’s trendlines, either on the upper or lower side. When this happens, the price can move rapidly in the direction of that breakout.
Trend : Neutral on Short- and Medium-Term basis and Uptrend on Long-Term basis.
Momentum is Mixed as MACD Line is below MACD Signal Line (Bearish) but RSI ~ 50 (Neutral). MACD Histogram bars are rising, which suggests that momentum could be nearing another upswing.
Support and Resistance : Nearest Support Zone is $25, then $19. The nearest Resistance Zone is $35 (previous support), then $50.
AVAX: Channel DownTrade setup : After getting rejected at $50 resistance, price has been pulling back, forming a Channel Down pattern. Notice that the price is also nearing oversold levels (RSI ~ 30) just as it approaches $25 support. That’s also 78.60% Fibonacci Retracement level (potential support) of $25.70. Hence, near term, we could see price bounce up to $30.
Pattern : Price is trading in a Channel Down pattern. With emerging patterns, traders who believe the price is likely to remain within its channel can initiate trades when the price fluctuates within its channel trendlines. With complete patterns (i.e. a breakout) – initiate a trade when the price breaks through the channel’s trendlines, either on the upper or lower side. When this happens, the price can move rapidly in the direction of that breakout.
Trend : Downtrend on Short-Term basis, Neutral on Medium-Term basis and Uptrend on Long-Term basis.
Momentum is Bearish (MACD Line is below MACD Signal Line, and RSI is below 45).
Support and Resistance : Nearest Support Zone is $25, then $19. The nearest Resistance Zone is $35 (previous support), then $50.

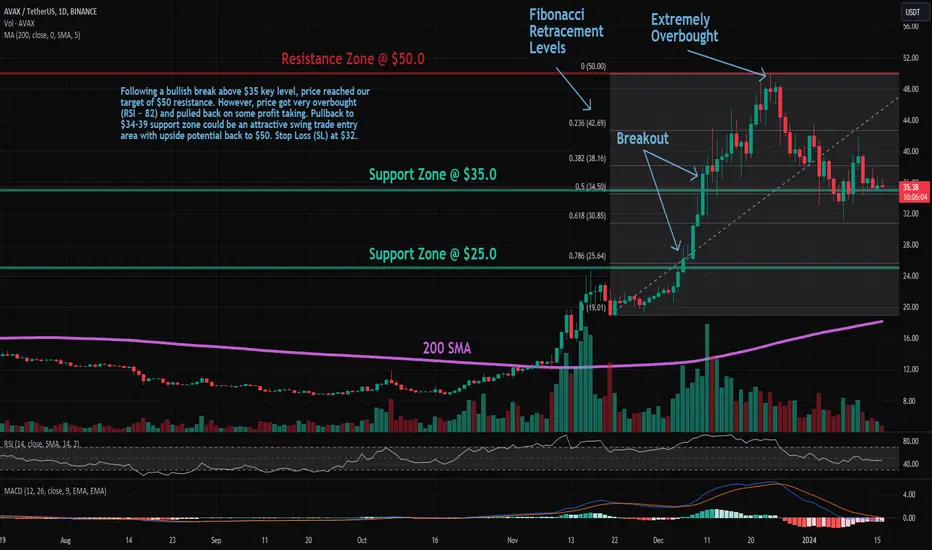
AVAX: Pullback in UptrendTrade setup : Following a bullish break above $35 key level, price reached our target of $50 resistance. However, price got very overbought (RSI ~ 82) and price has pulled back on some profit taking. The nearest horizontal support is $35 while the nearest Fibonacci Retracement levels (possible support) are $38 (38.20%), $34 (50%), and $31 (61.80%). Hence, pullback to $34-39 support zone could be an attractive swing trade entry area with upside potential back to $50. Stop Loss (SL) at $32 (just below prior swing low).
Trend : Downtrend on Short-Term basis and Uptrend on Medium- and Long-Term basis.
Momentum is Mixed as MACD Line is below MACD Signal Line (Bearish) but RSI ~ 50 (Neutral). MACD Histogram bars are rising, which suggests that momentum could be nearing another upswing.
Support and Resistance : Nearest Support Zone is $35, then $25. The nearest Resistance Zone is $50.