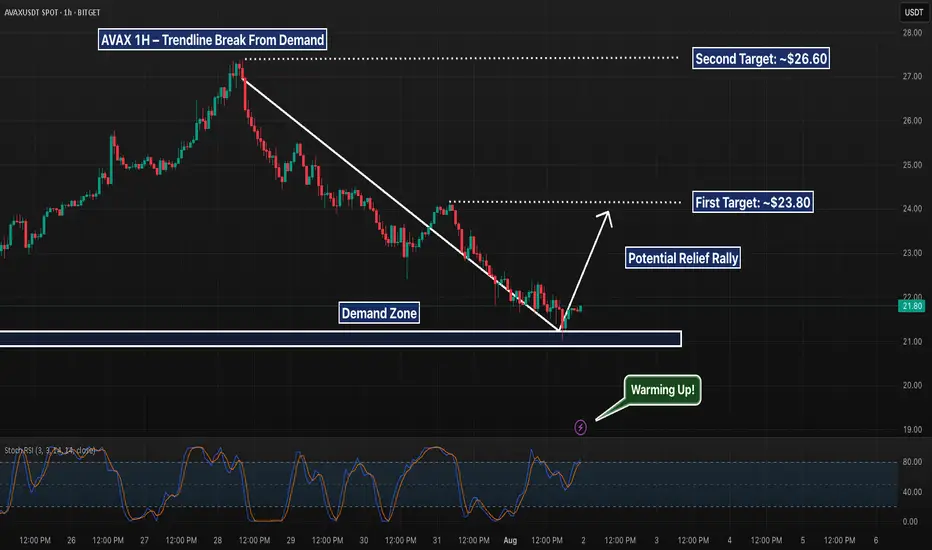
AVAX - Trendline Break From Demand, But Can Bulls Push to $24?AVAX is showing signs of life after rebounding cleanly off a local demand zone near $21 and breaking its recent downtrend line. This structure opens the door to a possible short-term rally — with first resistance sitting near $23.80 and a secondary target at $26.60. However, Stoch RSI is already pushing into overbought, so momentum must sustain or risk another fade.
A retrace to retest the broken trendline and hold would add confluence for longs. If that fails, bulls may get trapped.
📌 Demand bounce
📌 Trendline break
📌 Eyes on follow-through to reclaim higher levels
This is early-stage structure shift — not confirmation yet, but worth watching.
Avax
AVAX – Hidden Chance for Latecomers🔥AVAX – High-Potential Setup Amid Market Catch-Up
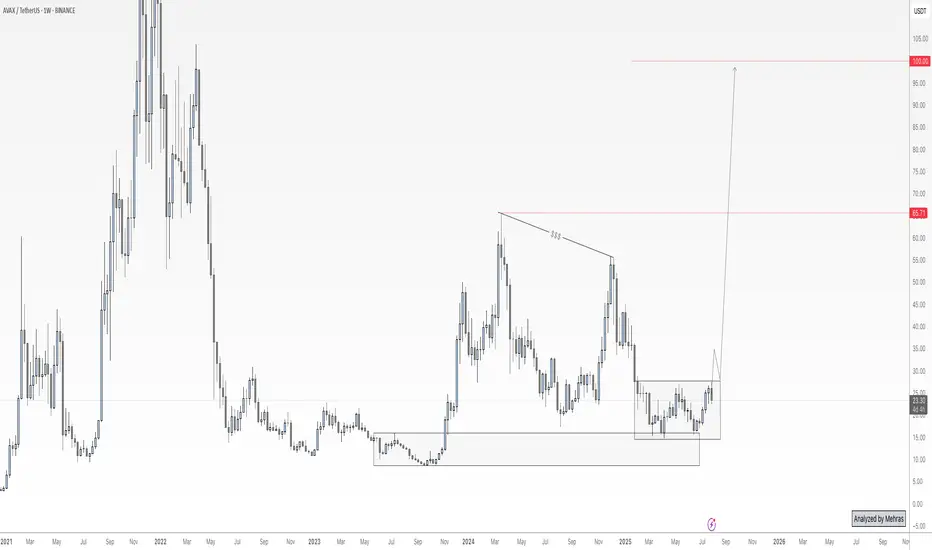
While many crypto assets have surged in the recent bullish wave, AVAX appears to have been left behind — and that could present a high-reward opportunity ahead.
From both a fundamental and on-chain perspective, this project shows promising signs, especially with notable activity among whale wallets. I believe AVAX has the potential for a strong long-term rally — but there’s one critical condition to watch.
Price has recently reacted to a key custom demand zone. However, for confirmation of buy-side strength, we need to see a clean breakout and daily close above the ~$28 level. If that breakout is confirmed, I’ll be looking to accumulate for a long-term hold, with a target of $65 — and possibly up to $100 if momentum continues.
That said, risk management remains my top priority. I’ll allocate no more than 3–4% of my total portfolio to this position.
Keep an eye on the $28 breakout. If the trade is triggered, I’ll provide updates here.
🔁 This analysis will be updated whenever necessary.
Disclaimer: This is not financial advice. Just my personal opinion.
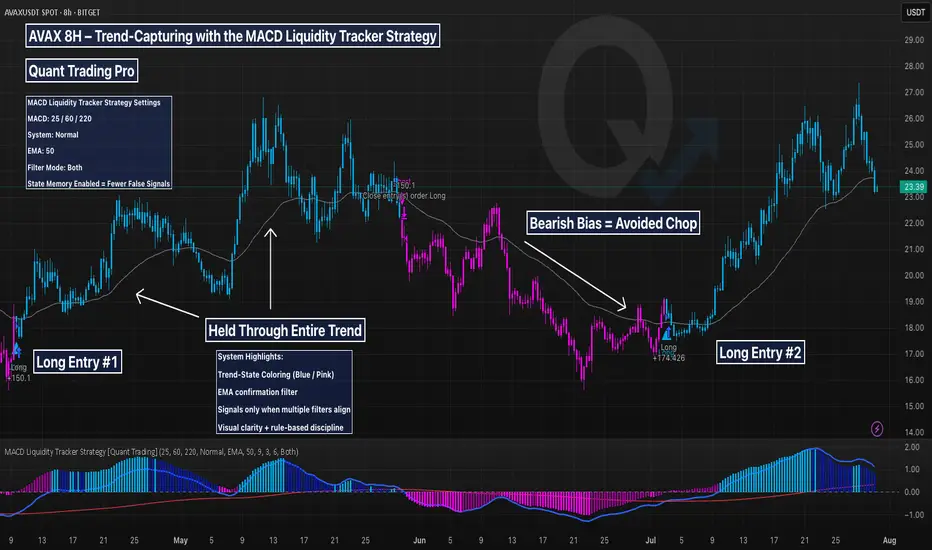
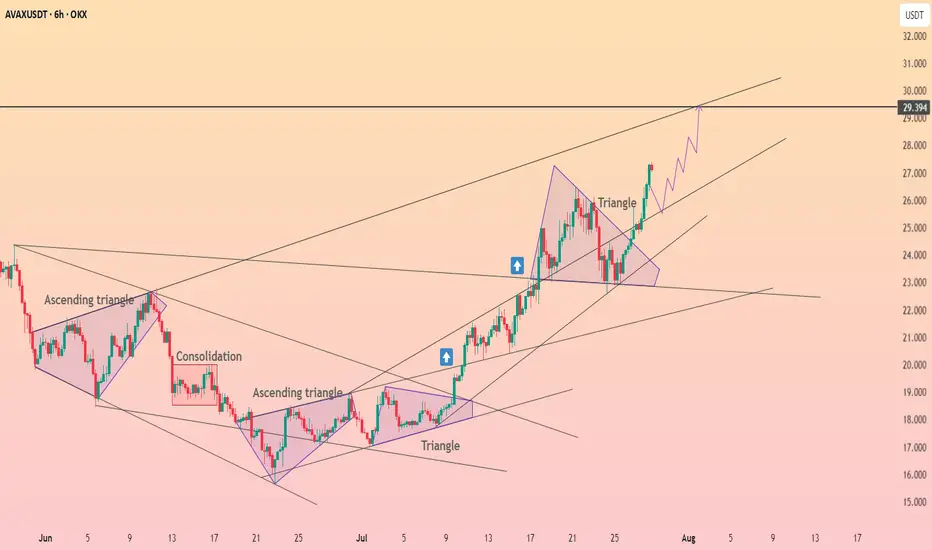
AVAX 8H – Trend-Capturing with the MACD Liquidity Tracker This AVAX 8H chart is a prime example of how the MACD Liquidity Tracker Strategy captures major trends with minimal noise. Designed for swing traders and trend followers, this system uses MACD momentum (25/60/220) and a 50-period EMA to filter entries and avoid chop.
🔍 What This Chart Shows:
A +150% long triggered in April and held cleanly through the rally
No entries during the June downtrend — thanks to bearish state filtering
A fresh +174% long in July as momentum and trend realigned
Visuals are crystal clear:
Blue candles = Bullish bias
Pink candles = Bearish bias
Arrows = Filtered entries only
MACD Histogram = Momentum strength
EMA = Trend direction
🧠 Why It Works:
Most traders struggle with second-guessing and emotional exits. This system removes the guesswork by enforcing strict momentum + trend alignment and delaying signals during unclear price action.
Ideal for crypto traders who want to follow strong trends with confidence and skip the noise in between.
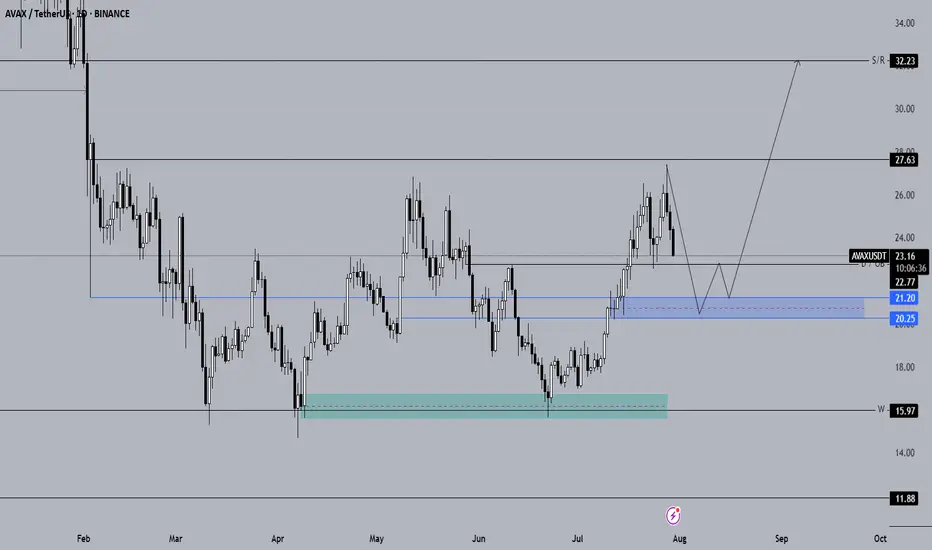
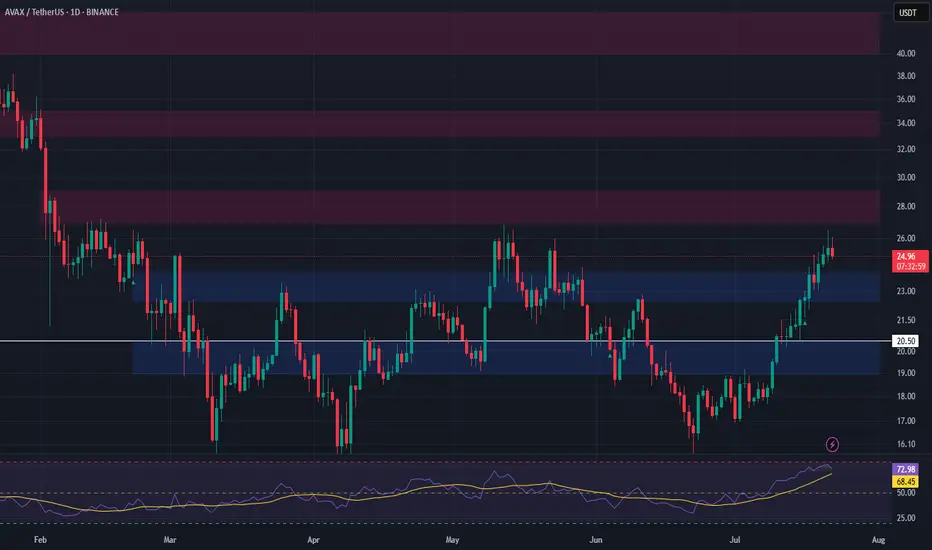
Long-Term Technical Analysis of AVAX CoinWhen evaluating AVAX for long-term investments, the blue support zone highlighted on the chart stands out as the key area to monitor for potential spot entries. If AVAX closes daily candles below the $22.77 level, it is expected to continue its downward trend.
The primary spot buy zone for AVAX is identified between the $21.20 – $20.25 support range. If the price retraces into the blue zone on the chart, we plan to initiate spot positions. Should AVAX show a reversal from this area, our next upside targets are $27.63 and $32, respectively.
If AVAX fails to generate a strong reaction from the blue zone and continues to decline, we will then monitor the $18 support level. As long as AVAX holds above $18, our bullish outlook from this analysis remains valid.
Not Financial Advice (NFA).
Avalanche broke through the $26 level ┆ HolderStatBINANCE:AVAXUSDT is consolidating just beneath the $33 resistance after reclaiming a prior range high. Price action is forming a classic bull flag while higher lows continue to support the structure. A breakout above $33 could confirm bullish continuation toward $35 and $36. Momentum remains strong as long as the $31.5 support holds, making AVAX one of the key watchlists this week.
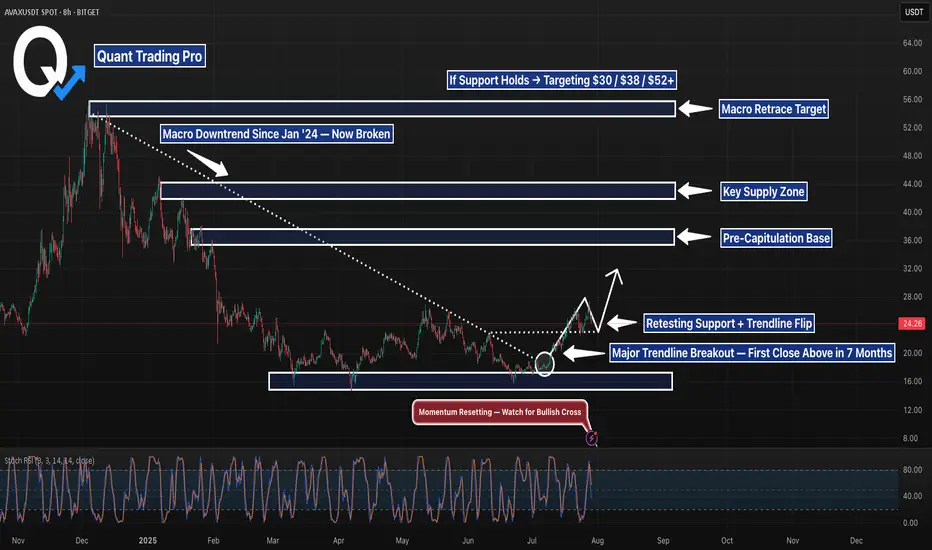
AVAXUSDT 8H — Trendline Break Confirmed, Retest in ProgressAVAX just closed above a 7-month macro downtrend and is now pulling back into a high-confluence retest zone. With the prior trendline now acting as potential support — and price holding above a multi-tap demand level — this is a high-stakes inflection point.
📊 Technical Breakdown:
Breakout:
The descending trendline that defined AVAX’s entire bear structure since January has finally broken. A clean candle close above that line marked a shift in control from sellers to buyers.
Retest Zone:
Price is now sitting directly on top of the broken trendline and the horizontal demand zone that’s held since Q1. This dual-level confluence offers a high-probability bounce area — or a decisive invalidation if lost.
Momentum Check:
Stochastic RSI is resetting — not overbought — giving bulls room to push higher if this retest holds.
Targets to the Upside:
$30 – Local breakdown zone from late Jan
$38 – Pre-capitulation base (March)
$44 – Major structural resistance
$52–53 – Full retracement target from the December high
🧠 Trade Context & Bias:
Bullish case:
A bounce here with strong volume confirms the trendline flip and opens the door for midterm continuation toward the $38–$44 zones.
Bearish case:
If AVAX breaks below $22 with momentum, this would invalidate the breakout structure and shift bias back toward range-bound or bearish continuation.
This is where structure meets opportunity. A successful retest could place AVAX at the front of the next altcoin rotation — but only if buyers defend this level with conviction.
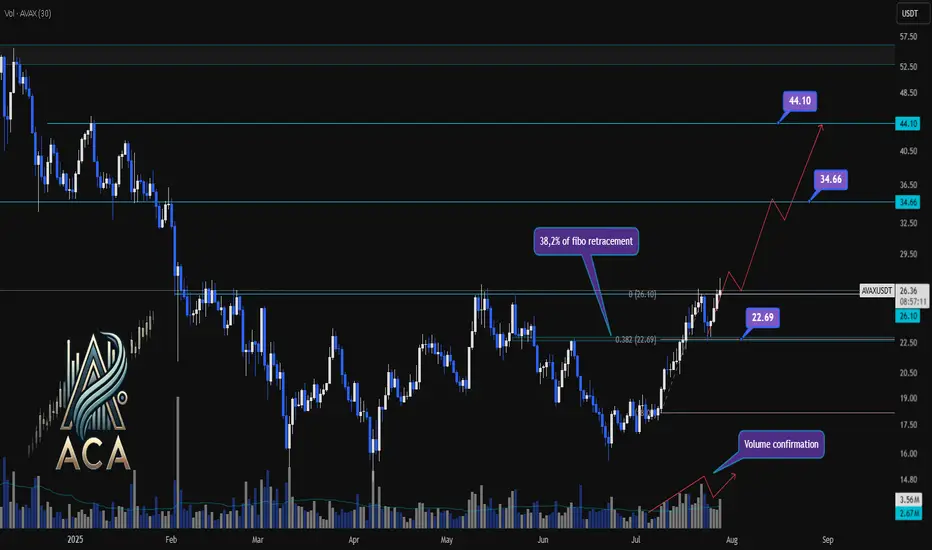
AVAXUSDT Trend Analysis | Will Volume Confirm the Next Big Move?AVAXUSDT Trend Analysis | Will Volume Confirm the Next Big Move?
🔍 Let’s break down the AVAX/USDT setup, examining its technical structure and mapping out key opportunities as it gears up for a decisive move.
⏳ Daily Overview
AVAXUSDT has been exhibiting a bullish structure, recently reacting to the 0.382 Fibonacci retracement level (around 22.69USDT) where price paused for a correction. This correction was technically healthy, as it occurred with declining volume, while upward impulses were marked by notable volume surges—signaling strong bullish participation and confirming accumulation phases.
🔺 Bullish Scenario:
The next area to watch is the resistance at 26.10USDT, which has acted as a major barrier in recent trading sessions. A decisive daily close above this level—preferably supported by a clear uptick in volume—would confirm breakout momentum and set the stage for further advances.
Upon confirmation, the chart points to medium- and long-term targets at 34.66USDT and eventually 44.10USDT. These levels are derived from key Fibonacci extensions and historic price reactions, offering logical take-profit zones for trend-following strategies.
📊 Key Highlights:
- 0.382 Fibonacci level (22.69USDT) acted as a reaction zone and healthy correction point.
- Volume profile validates trend: increased buying volume during upswings, decreased volume on dips.
- 26.10USDT is the next crucial resistance for confirmation.
- Breakout (with volume) opens path to 34.66USDT and 44.10USDT targets.
- Failure to clear 26.10USDT could result in consolidation or another retest lower.
🚨 Conclusion:
All eyes are on the 26.10USDT resistance. Wait for a clear daily close and volume confirmation before considering entries. A breakout above this level could propel AVAXUSDT towards higher Fibonacci targets, while a rejection may prompt another retest of prior supports or consolidation.
Stay sharp and plan your trades with discipline!
Avalanche · Early or Late? · Targets & TALook at AVAX. It traded at $18 for 21 days, three weeks, and now its price is already at $27, 50% higher. That's how it all changes in a matter of days. In just 19 days Avalanche is trading much higher and soon you won't be able to get a buy below $50. $18 will seen like an old dream. Gone so long ago but it was available just recently. The same will happen with the current price.
Avalanche is still cheap below $30. The all-time high is $147. We can easily aim for $100 just to see how things will go. We know this level can hit easily so buying below $30 should be an easy decision and choice. That is if you like this pair.
This is another strong project, another bullish chart but always focused on the long-term. If you are looking at it very close, we can have days red but nothing changes. This will not change the bigger path that is being travelled to a new all-time high. So only leveraged traders should be careful when opening a new LONG position because the market can shake the next day. If you trade spot, buy and hold; buy and accumulate with no worries necessary because it is still early.
You can do great in this bull market; we can all do great. More opportunities will continue to develop and the market will continue to heat up.
The next major target for this project mid-term is $64, followed by $96 and then the ATH.
Once we enter the price discovery phase, new all-time high territory, anything goes. The action can continue rising and hit levels hard to imagine, for months, or it can stop just after a few weeks. It all depends on how much money into the market flows.
Namaste.

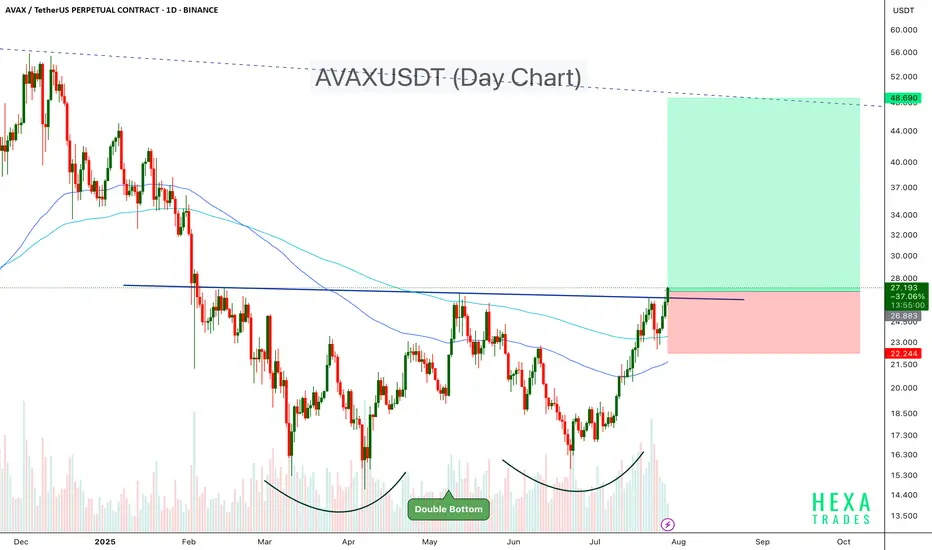
AVAXUSDT Double Bottom Confirmation.AVAX has formed a textbook double bottom pattern on the daily chart, signaling a potential reversal after months of downtrend. The neckline around the $27 zone has been broken decisively, confirming the bullish breakout.
Key Points:
- Double Bottom Structure: A strong bullish reversal pattern with a clean neckline breakout.
- Breakout Level: $27, which was acting as resistance for the past several weeks.
- Volume Surge: Noticeable increase in volume during the breakout, adding strength to the move.
- Target: $48–$50 region. ( Channel resistance)
-Stop-Loss Idea: Below $22.0
AVAX appears ready to trend higher as momentum builds. If bulls hold above the breakout zone, the rally may accelerate in the coming weeks.
Cheers
Hexa
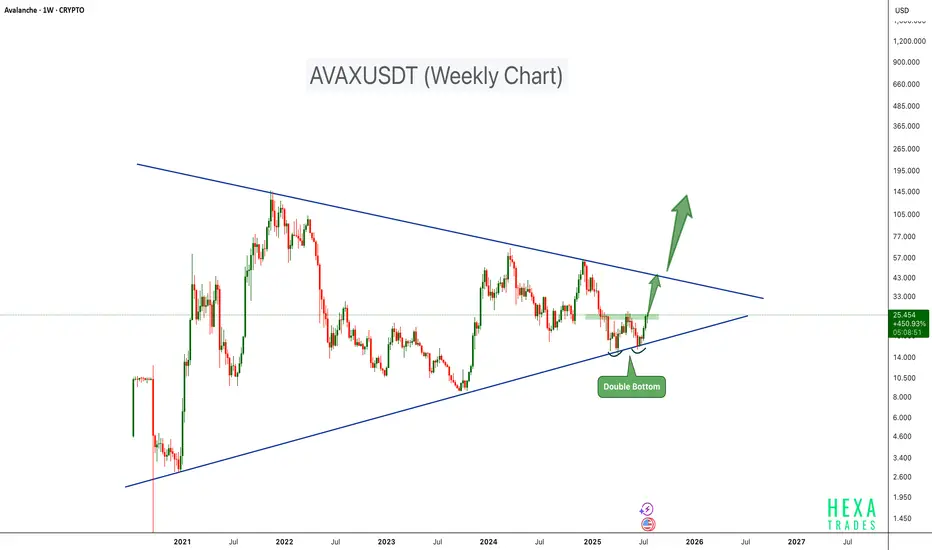
AVAX Bull Run Loading!AVAX is showing signs of a strong bullish setup on the weekly chart, forming a double bottom pattern right at the lower support trendline of a long-term symmetrical triangle. This technical formation often indicates a potential trend reversal when confirmed with breakout and volume support.
Key Points:
-Double Bottom Support around $12–$14 with bullish momentum.
-Symmetrical Triangle structure compressing price for breakout.
-Breakout Zone near $27, a close above this level may trigger strong upside.
-Upside Target: Short-term Target- $45; Long Term Target - $125
Invalidation: A Break below $15 support could negate the setup.
Cheers
Hexa
CRYPTOCAP:AVAX BINANCE:AVAXUSDT
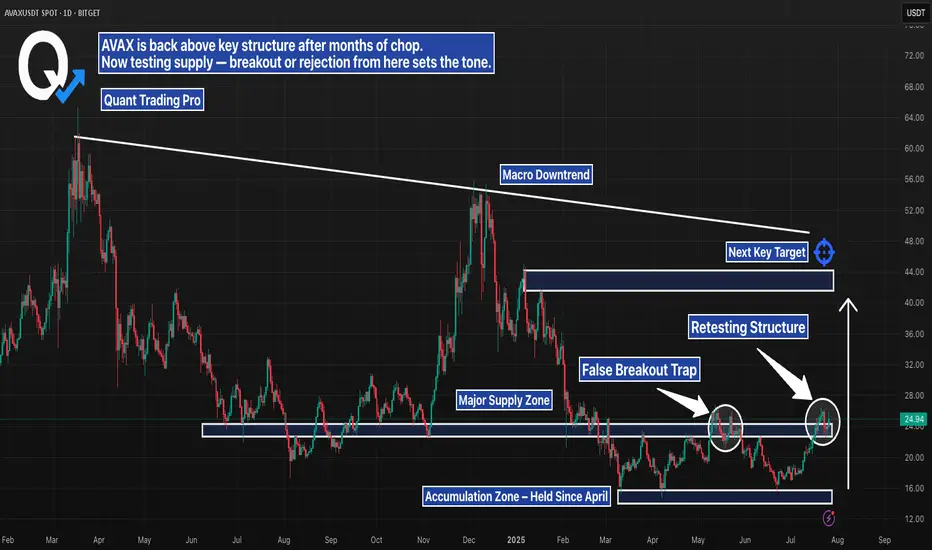
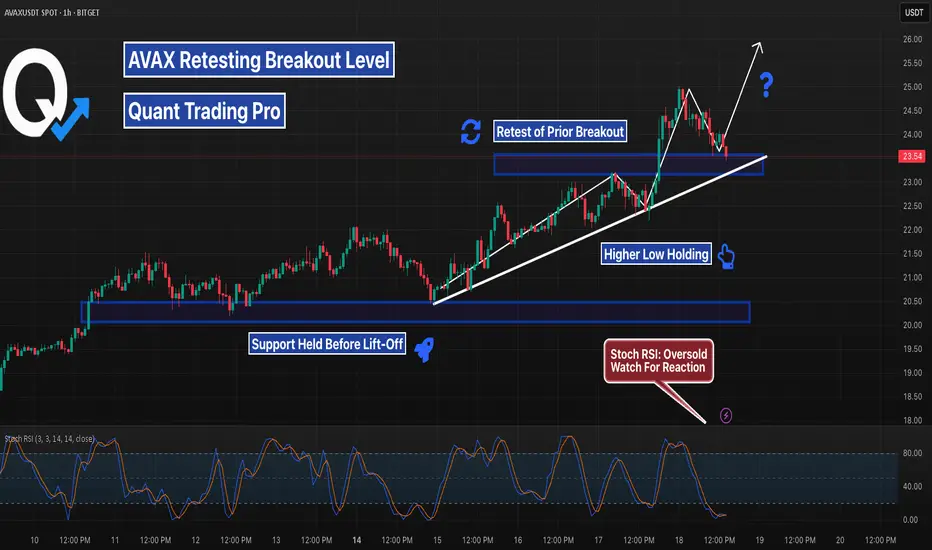
AVAX Daily – Breakout or Another Trap?AVAX just pushed into a major supply zone, testing structure that’s capped price since early 2024. After months of chop and accumulation, bulls have finally reclaimed key support — but the real test is happening now.
Here’s the setup:
– Retesting structure after first rejection
– Sitting below a clear macro downtrend line
– Above an accumulation zone that held for months
– Next key target sits near $40–44, with confluence from prior highs and trendline resistance
This is the kind of move that either builds serious momentum — or turns into another trap. Wait for confirmation. Volume and reaction here will say everything.
#AVAX #Altcoins #CryptoBreakout #SupplyZone #TrendlineResistance #TechnicalAnalysis #QuantTradingPro #PriceAction
Avalanche corrected from resistance ┆ HolderStatBINANCE:AVAXUSDT broke below $27.6 and is testing $25.9. Breakdown may open $24.5. Bears remain in control.

AVAX Long Swing Setup – Waiting for Support RetestAVAX has been rallying for two straight weeks, showing strong momentum. We’re watching for a healthy pullback into the $22.50–$24.00 support zone to position for continuation. If this zone holds, the risk/reward setup favors bulls with clear upside targets.
📌 Trade Setup:
• Entry Zone: $22.50 – $24.00
• Take Profit Targets:
o 🥇 $27 – $29
o 🥈 $33 – $35
o 🥉 $40 – $44
• Stop Loss: Daily close below $20.50
AVAX/USDT Trade Setup: Bullish Bias with Fibonacci Targets🚀 AVAX/USDT Avalanche is currently in a strong bullish trend 🔼. On the 4H chart, price is pulling back slightly 📉, and I’m watching for momentum to pick up and break above the current range high 📊—that’s where I’ll be looking for the next entry.
🎯 My bias remains long, and in the video I break everything down in detail:
🔍 Price action
🧱 Market structure
📈 Overall trend
📍 Stop loss placement (below the previous swing low)
🎯 Targeting key Fibonacci levels
I also go over my exact Fibonacci settings and how I use them to frame the trade.
This is not financial advice ❌💼

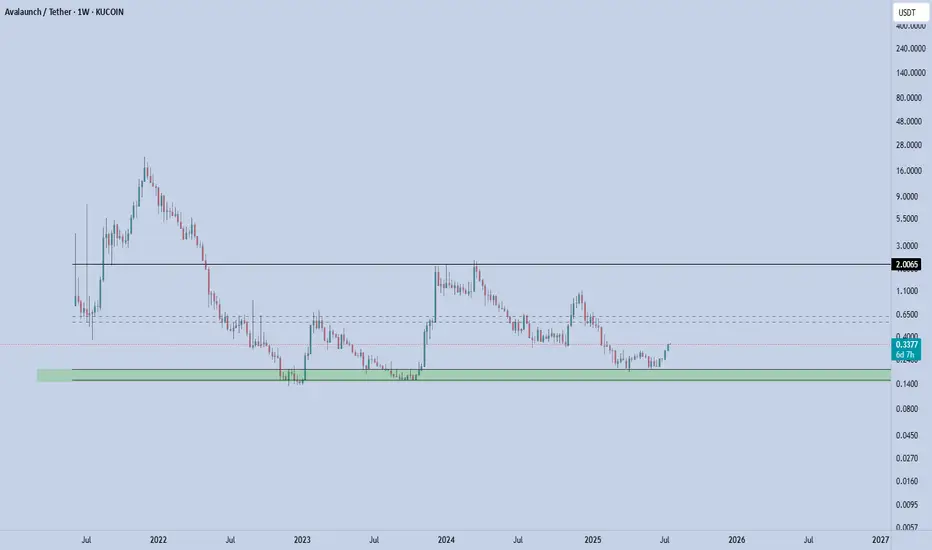
XAVA - Rebound in Play XAVA coin is currently stabilizing in a key support zone — the bottom of the defined channel, which has proven to be a strong and reliable support area. Price recently bounced from this level, confirming buyer interest.
From here, the next immediate target is the mid-range of the channel. If price manages to break above and hold the mid-channel, the next upside objective becomes the top of the channel.
Key Levels
Support (Channel Low): 0.15(invalidation below this level)
First Target (Mid-Channel): 0.56-0.62
Second Target (Channel High): 2
📌 Risk Management: A clean break below 0.15 invalidates this setup. As long as this level holds, the structure remains constructive and favors rotation toward higher levels within the channel.
Avax Tests Key Resistance at 27 for the Third TimeAvax is once again testing the 27 resistance level. The first attempt lasted over a week, and the second one held for a couple of days, but in both cases, Avax failed to break through. This time, however, it has stronger support from market-wide momentum.
Bitcoin has reached 120,000, Ethereum is posting sharp gains, and most notably, Chainlink (LINK) has already broken through its own resistance. Avax and LINK have shown a high degree of correlation, nearly 89% over the past two months. This strong relationship, while occasionally fluctuating, has been in place for several years.
A breakout for Avax may take time, but it now has more momentum and supportive conditions behind it. Still, as long as the 27 resistance holds, bulls should approach with caution before entering long positions.
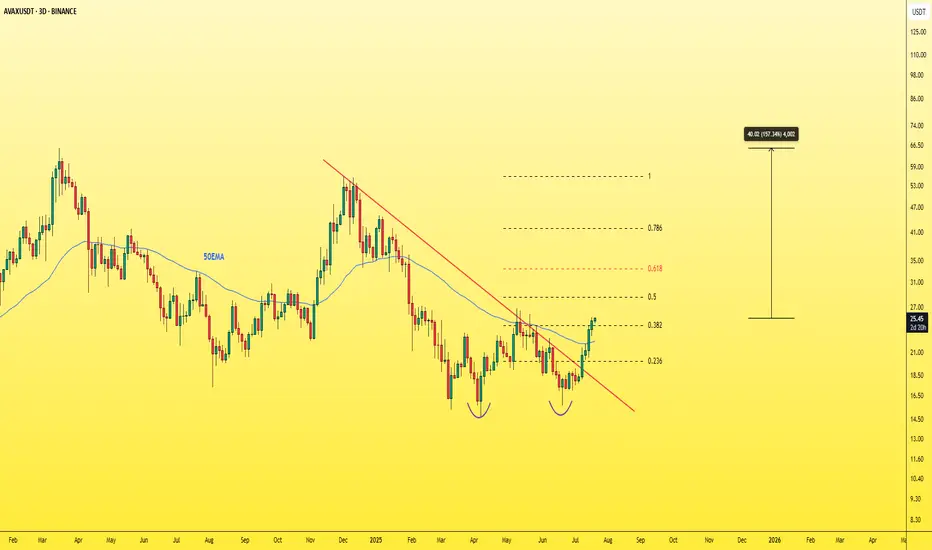
AVAXUSDT - THE real treasure must be hunted!Let's not forget about CRYPTOCAP:AVAX — it's one of the must-have assets in any crypto portfolio.
Currently trading at a discounted price after dropping from its previous top at $55, AVAX now shows strong bullish potential with plenty of upside ahead.
🚀 Key bullish signs:
-Successfully broke through multiple resistance levels, including the 0.382 Fibonacci retracement, 50 EMA, and the main descending trendline.
-A daily close above the 26$ level is a very positive signal.
With a solid project, reliable fundamentals, and low risk compared to potential reward, this could be a highly profitable opportunity.
Don’t sleep on it.🎯
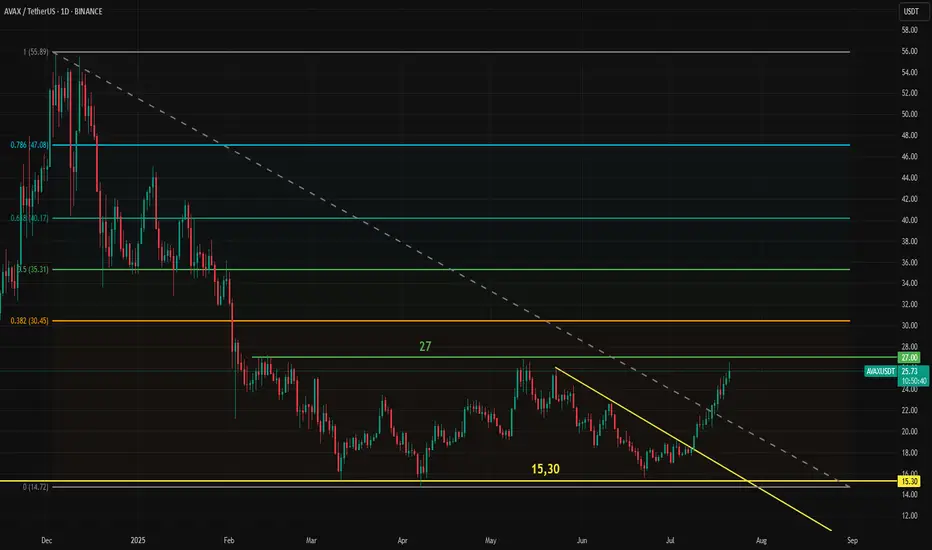
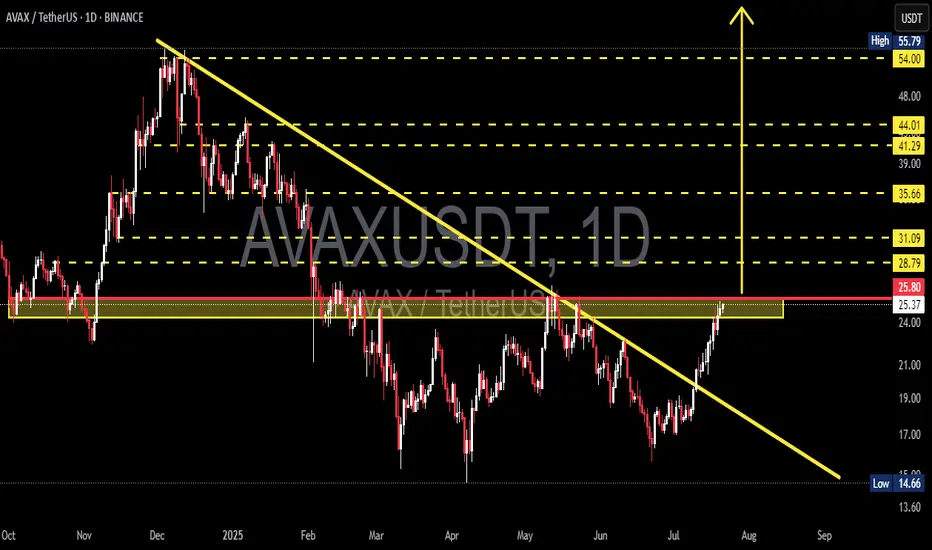
AVAX/USDT Massive Trend Reversal: Breakout from 8-Month DowntrenAVAX has just delivered one of its most technically significant moves in recent months. After spending over 8 months trapped under a descending resistance line, price action has finally broken free — suggesting a potential trend reversal and the beginning of a much larger bullish phase.
🧠 Pattern & Structure Breakdown:
📌 Descending Trendline Breakout
AVAX had been forming a descending triangle pattern, characterized by consistent lower highs and a horizontal support zone between $14.66 – $22. The recent bullish breakout from this structure, accompanied by strong volume, is a highly encouraging sign for bulls.
📌 Accumulation Zone Identified
The yellow zone on the chart ($14.66 – $22) has proven to be a strong demand zone where buyers consistently stepped in. The recent rally originates from this base, indicating possible institutional accumulation.
📌 Critical Horizontal Resistance at $25.80
Price is now testing the $25.80 resistance zone, which historically acted as a supply area. A successful daily close and confirmation above this level would officially flip the structure bullish.
📈 Bullish Scenario – Multi-Level Upside Targets:
If AVAX confirms the breakout above $25.80, these are the key bullish targets ahead:
🎯 Target 1: $28.79 – minor resistance & potential short-term TP zone
🎯 Target 2: $31.09 – previous price equilibrium
🎯 Target 3: $35.66 – key pivot from past market structure
🎯 Target 4: $41.29 and $44.01 – heavy historical supply zones
🎯 Target 5 (measured move): $54.00 to $55.79 – the projected breakout target from the descending triangle pattern
This move would represent a full technical recovery if AVAX aligns with broader market sentiment and Bitcoin remains stable or bullish.
📉 Bearish Scenario – Pullback Risks:
On the flip side, if price fails to sustain above $25.80 and gets rejected:
⚠️ A retest of $24.00 – $22.00 is likely
⚠️ If that zone breaks down, next support lies at $19.00 – $17.00
⚠️ A loss of the $17 level may trigger a return to the critical low near $14.66
This would invalidate the bullish breakout and return AVAX into a sideways or downward consolidation phase.
🔍 Additional Technical Insights:
✅ Volume is steadily increasing — showing renewed buying pressure
✅ Indicators like RSI and MACD (if applied) are likely showing bullish divergence
✅ Overall altcoin sentiment is improving, providing a tailwind for AVAX's potential breakout continuation
🧩 Final Thoughts:
AVAX is at a pivotal moment in its medium-term price structure. The breakout above the long-term downtrend line is a strong technical shift. A confirmed breakout and hold above $25.80 could trigger a multi-week or multi-month rally targeting $40 – $55+.
However, traders should be cautious of possible pullbacks and manage risk accordingly — especially as resistance zones from previous structures are being tested.
#AVAX #AVAXUSDT #CryptoBreakout #TechnicalAnalysis #Altcoins #BullishCrypto #DescendingTriangle #ReversalPattern #AVAXAnalysis
Avalanche's (AVAX) $229 & $363 Bull Market Potential ExposedStarting from the December 2020 low, Avalanche (AVAX) grew a total of 5,245% to its November 2021 all-time high. Now, if we take the true market bottom, when trading started back in September 2020 with a low of $0.85, total growth by the end of the bull market amounts to 17,152%.
It doesn't matter how you slice it, both are incredibly strong numbers.
Do you really think Avalanche will consolidate for years only to grow 500%, 600% in its bull market? I don't think so. This prolonged consolidation period was a test. Those that remained true to the market; those that continued to hold; those that continued to develop, to build and to grow within the market; all those people will be rewarded, big time.
Let's consider the true potential for AVAXUSDT in early 2026 or late 2025.
The main target is $229. I think missing a new all-time high is out of the question. We are going for the top as the market has been growing behind the scenes for so long. So much hard work has gone into making Cryptocurrency accessible to everybody and this hard work is about to pay off.
This $229 target opens up 880%. Keep in mind that this coming from current prices. If we were to consider the bear market bottom, this number would be much higher, something around 2,564%.
The next target, a "strong all-time high," is open at $363. This would give us a total profits potential of 1,450%.
As you can see, Avalanche is trading at bottom prices with plenty of room left available for growth. It is still very early if you focus on the long-term.
Thank you for reading.
Your support is appreciated.
Namaste.

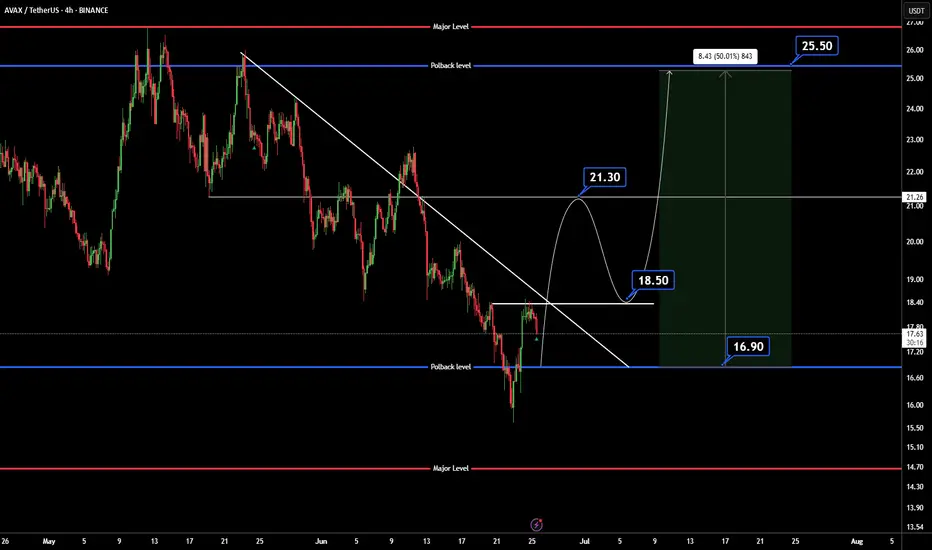
AVAXUSDTWe are bear-trend but wait for break trendline and pollback to 18.50$.
BINANCE:AVAXUSDT
Support: 16.90
Resistance: 18.50 - 21.30 - 25.50
⚠️Control money management.
AVAX Backtests Breakout — Bounce Now or Dump Later?AVAX has pulled right back into the same level it broke out from days ago. With Stoch RSI fully oversold, this is a high-probability reaction zone — but if bulls don’t show up, next support sits lower around $21.50. Tight risk, high reward.
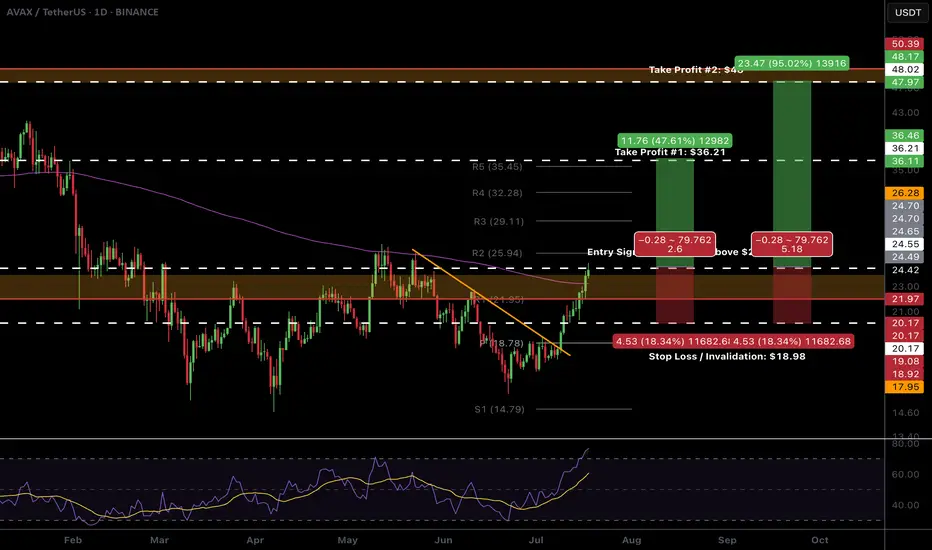
$AVAX Ready to breakout!CRYPTOCAP:AVAX looks ready to pop.
High Volume Node resistance and daily 200EMA is clear and now support. We don't want to see price rejected and moving back below this area.
The R5 daily pivot is my first partial take profit $35-36 followed by the major resistance High Volume Node at $48
Daily RSI is overbought with unconfirmed bearish divergence so watch out for this but should be good to run in the mean time. BTC permitting...
Safe trading
AVAX is Back: Subnets, Upgrades, and Institutional Momentum🚀🧠 AVAX: Subnets, Upgrades, and Institutional Momentum 🔧🏛️
Avalanche (AVAX ) is starting to shape up again — not just on the chart, but at the infrastructure and institutional level too.
As part of the Altcoin Series, I continue to trade these setups while preparing for a time when I’ll divorce alts emotionally and treat them for what they are — assets to be traded, not worshipped.
But right now? This one looks strong.
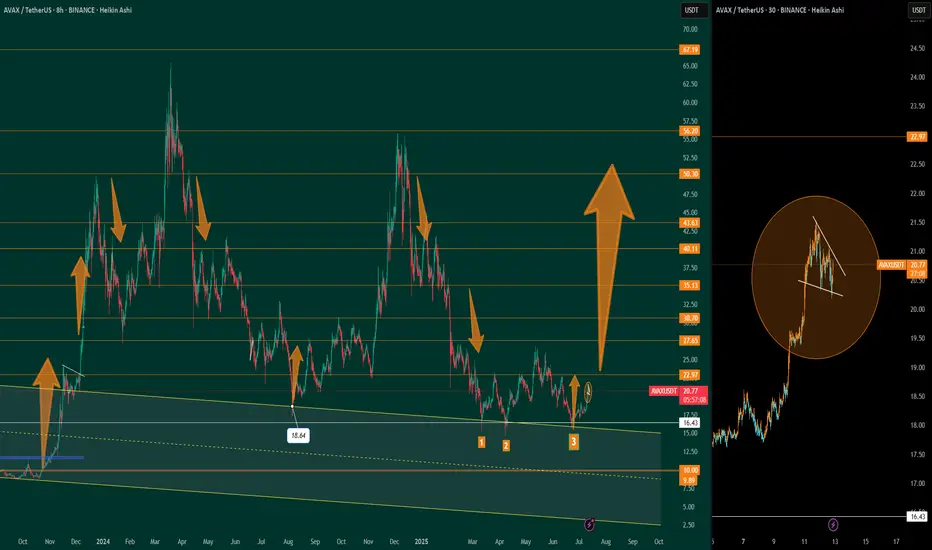
📊 Chart Breakdown
Left side: Macro chart (8H)
✅ We've just completed a successful third touch of structural support — you can see the 1–2–3 test boxed below the $18.64 level
📍 That’s usually where conviction builds, and reversals are born
🚀 A massive breakout confirmation comes if we close above $22.97 — the level to watch
🧱 Above that, the path opens toward higher fib levels: $27.65 → $35.13 → $43.63 and beyond
Right side: Micro structure (30-min chart)
🔍 A descending wedge or coil forming — typical of consolidation before breakout
This price action is tightening into a decision point, right around $20.80–$21
I expect a breakout soon, with a push toward the macro trigger at $22.97
🧩 What’s New with AVAX?
Avalanche 9000 Upgrade is Live
Major performance overhaul: cheaper subnets, faster deployment
Subnets now act more like sovereign L1s, enhancing utility across the board
Developer cost dropped by over 99%, inviting serious builders
DeFi, Real-World Assets & Ecosystem Growth
TVL > $5B
VanEck’s $100M Treasury Fund now tokenized on Avalanche
Over 515M transactions per month
Real-world integrations with Alipay, California DMV, and more
Enterprise Expansion
FIFA subnet launch (NFTs, tickets, collectibles)
Institutional panels at Avalanche Summit London
Avalanche’s vision: a custom chain for every institution
Retro9000 Grant Program
$40M set aside to fuel L1 growth via subnets
Analysts expect 300% subnet growth by Q4 2025
🧠 The Mindset: Trade, Not Worship
AVAX is a great example of why I'm preparing to divorce altcoins at the cycle top.
It’s gone from hype to silence... and now to real infrastructure momentum.
So yes — I’m bullish.
But I’m not here for belief — I’m here for the structure.
✅ Buy over support
✅ Breakout over $22.97
🛑 Stop-loss if structure fails
🎯 Targets: $27.65 → $35.13 → $43.63+
🏁 Final Word
Avalanche is rebuilding — on-chain, in the real world, and on the chart.
It has subnets, speed, and now institutional backing.
Let’s trade it smart.
Let’s trade it without emotions, do your risk management and don't listen to me.
One Love,
The FXPROFESSOR 💙
Disclosure: I am happy to be part of the Trade Nation's Influencer program and receive a monthly fee for using their TradingView charts in my analysis. Awesome broker, where the trader really comes first! 🌟🤝📈