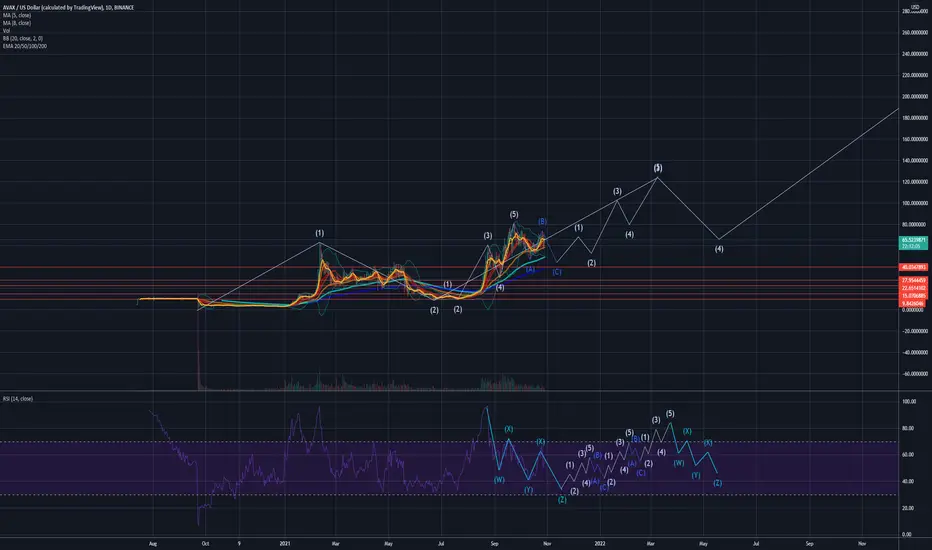
AVAX - $209 MID-DECEMBERI like AVAX just because it has such a rad name... rad names = superbullish... JK! very good project makes me super bullish long term.... so i'm looking at $209 around mid december...
people need to understand setups require time to mature so a prediction today does not indicate a target is reached tomorrow
have patience, this will happen but also not trading advice
stay safe homies/homegirls/whatever else you go by these days
tg
AVAXUSD

AVAX ideaChart shows a study of recent AVAX movements with updated channel.
It is on the way to secure the H&S pattern target, but the midline acts as a strong resist for now. Upper channel price actions will be interesting.
Although not necessary, the pattern breakouts should usually show a volume breakout as well to confirm the trade. Right now the volume seems to be lower than the left shoulder, but this condition is just to confirm the trade, its not a must.
I expect the neckline of the pattern ($73) to act as a support with the channel bottom and $95 can be reached easily, with invalidation below the neckline of course, which will make the downside target area between $52-58 for a short opportunity.
As a trading strategy, I wouldn't jump in the coin at the moment but instead, buy the support, take profit at resists.
Stay safe!

avax/usdTesting/tracking elliot wave theory. Please do not trade off idea without S/L. Not financial advice.
Update
AVAXUSDT , The price should have some pullbackHi guys
Did you take the profit of last week that we published ? or Not ?
Today we have analysis another amazing layer 2 blockchain coin
In last days AVAX is moving powerful toward new target and made new ATH because of the fundamental and news that published , at this time in technical view we need pullback for the price to be attractive for the investor and trader to be in buy position and buy some money of portfolio to AVAX .
We shown on chart a buy zone area and here we have nice R/r but this is market and anytime can happen anything we should be conscious about the market and the movement of trader .
BECAREFUL GUYS , MAYBE MARKET WILL STOP HUNTERING THE POSITION
Dont forget to attention to money management
Good Luck
Abtin

#AVAXUSDT AVAX in the up trend 😊From the chart, it appears that the price is heading to the Fibonacci target.
Be careful, the price may correct from here.
Purple line is fibonacci extension Target.🟣
Red lines are support and resistance level.🔴
if you like it, share it with your friends.
enjoy it.

avax price predictionthe chances are that avalanche price get into a correction as it has reached a resistance zone already.
AVAX price eyes 25%AVAX price has been on a massive ascent for roughly 20 days and is currently hovering above a mix of crucial support floors. A bounce off of these levels is likely to trigger another quick run-up for the altcoin.

AVAX daily chart AVAX/USDT AVAX price eyes 25% ascent as Avalanche bulls prepare for triple-digit territory
AVAX price to enter triple-digit territory
AVAX price action between September 7 and October 20 formed a bullish continuation pattern. In particular, Avalanche bulls triggered a 153% ascent between September 7 and September 23, known as a flagpole. This move was followed by a consolidation in the form of a descending parallel channel known as a flag.
A decisive daily candlestick close above the flag’s upper trend line at $57 constitutes a breakout, forecasting a 153% ascent to $130. This target is obtained by adding the flagpole height to the breakout point.
So far, AVAX price has rallied 56% and has a lot more to go. However, there is a good chance that Avalanche will retrace to the daily demand zone ranging from $72.06 to $81.23. This move will allow the bulls to replenish for another leg-up.
In such a case, AVAX price will rally 25% to retest the 100% trend-based Fibonacci extension level at $100. A highly bullish case could see Avalanche bulls extend this uptrend to the next level at $130, constituting a 60% ascent.
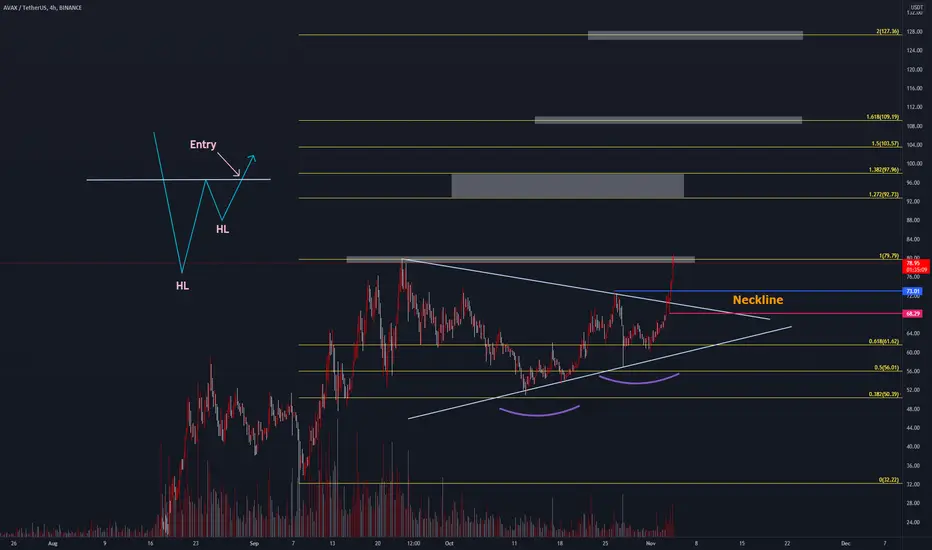
AVAX - INV-H&S TARGET HIT! WHATS NEXT?Hey everyone. AVAX had a nice Inverse H&S followed by a retest of the neck line and bounce. That's EXACTLY what I like to see in a H&S pattern.
The question now is CAN WE GO HIGHER before a little consolidation. AVAX does look pretty strong. I pulled up a fib retracement to get some ideas of what to look for IF there is a slight pullback. There MAY NOT be one In which case I expect AVAX to HIT the $100 - $105 mark.
If it does retrace here, I THINK it would likely bounce off the .786 or .618 level ... It looks strong so a bounce off of the .786 would lead to a more immediate continuation to the upside. A .618 bounce could result in a bull flag and then continuation upwards. Any type of 4HR close below the .618 would likely lead to a slower consolidation. I think this is just the start for AVAX and It should continue to do well this bull market.
I will update this IDEA as I do the others. When I first put out an AVAX chart it was around $59 (link below) . We've gained over 50% since then! I do believe there will be much more upside to come this bull market as I REALLY LIKE the Fundamentals of this coin. It's not too late to get in... I would wait for a correction though. and we'll have a better IDEA of a potential LOW RISK entry!
If you like this IDEA please LIKE, FOLLOW, and SHARE. I appreciate it and It helps me achieve my goal of helping others by providing realistic market analysis.
Hope everyone is doing well. DON'T FORGET to TAKE PROFITS. You never actually GAIN MONEY until you take profits.
** As always, This is NOT financial advice. This is just an IDEA based off of my experience trading and studying cryptocurrencies. I always recommend doing your own research before investing or trading anything.**
Take care.

AVAX/USD - About to hit $100! Once there expect some pullback.AVAX looks very strong and a test of $100 is almost a no brainer...
Once there, the bears may come from hiding to pull down the price, but it may not be enough for AVAX as it has very strong momentum behind it. We may top somewhere in December and then we may have a more significant correction like in July.
Until then, if we pass $100, AVAX will run towards $200...
A very strong performer and the indicators are extremely bullish. Bias is bullish.
Like and follow if you liked my idea!

💡Don't miss the great buy opportunity in AVAXUSD
Trading suggestion:
". There is a possibility of temporary retracement to the suggested support line (79.80).
. if so, traders can set orders based on Price Action and expect to reach short-term targets."
Technical analysis:
. AVAXUSD is in an uptrend, and the continuation of the uptrend is expected.
. The price is above the 21-Day WEMA, which acts as a dynamic support.
. The RSI is at 70
Take Profits:
TP1 = @ 88.50
TP2 = @ 96.00
TP3 = @ 123.00
SL= Break below S2
❤️ If you find this helpful and want more FREE forecasts in TradingView
. . . . . Please show your support back,
. . . . . . . . Hit the 👍 LIKE button,
. . . . . . . . . . Drop some feedback below in the comment!
❤️ Your support is very much 🙏 appreciated! ❤️
💎 Want us to help you become a better Forex / Crypto trader ?
Now, It's your turn !
Be sure to leave a comment; let us know how you see this opportunity and forecast.
Trade well, ❤️
ForecastCity English Support Team ❤️
💡Don't miss the great buy opportunity in AVAXUSD @avalancheavaxTrading suggestion:
". There is a possibility of temporary retracement to the suggested support line (79.74).
. if so, traders can set orders based on Price Action and expect to reach short-term targets."
Technical analysis:
. AVAXUSD is in an uptrend, and the continuation of the uptrend is expected.
. The price is above the 21-Day WEMA, which acts as a dynamic support.
. The RSI is at 72.
Take Profits:
TP1= @ 85.57
TP2= @ 90.00
TP3= @ 95.00
TP4= @ 100.00
TP5= @ 105.00
SL= Break below S2
❤️ If you find this helpful and want more FREE forecasts in TradingView
. . . . . Please show your support back,
. . . . . . . . Hit the 👍 LIKE button,
. . . . . . . . . . Drop some feedback below in the comment!
❤️ Your support is very much 🙏 appreciated!❤️
💎 Want us to help you become a better Forex / Crypto trader?
Now, It's your turn!
Be sure to leave a comment; let us know how you see this opportunity and forecast.
Trade well, ❤️
ForecastCity English Support Team ❤️

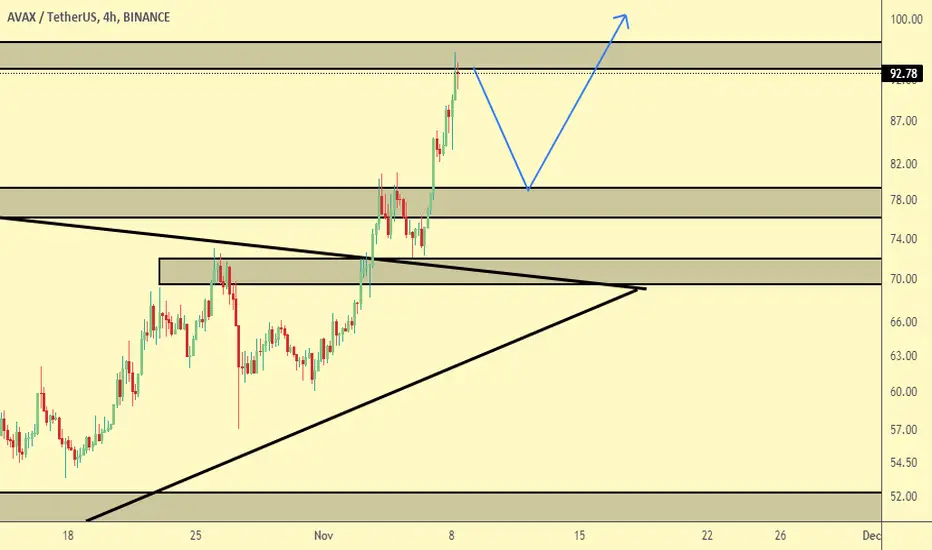
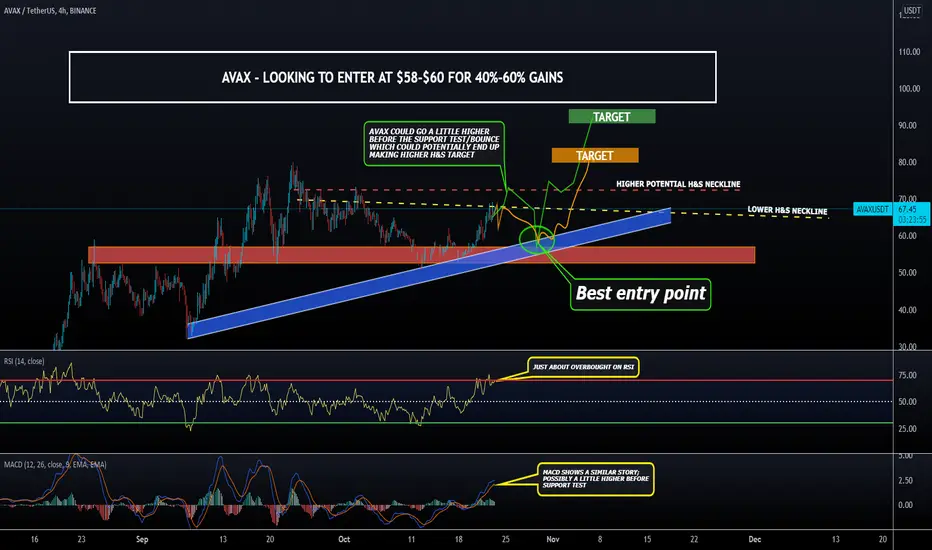
AVAX - 40%-60% GAINS COMING AFTER DROP?Hello everyone. I've been an AVAX fan for a while now and if you're like me, you're waiting for the next BREAKOUT!
Given BTC's current position looking very likely for a SHARP DROP, I think AVAX and the rest of the market will likely follow. The question is CAN AVAX BOUNCE off the ema ribbon and IF SO, HOW HIGH?
Either way I think AVAX will be met with resistance which could result in a better LONG ENTRY/BUYING OPPORTUNITY at around the $58-$60 area.
I Personally think there's a 50/50 chance we can go a little higher before the bigger pullback to the "buying area" ($58-$60)
It is a little bit speculation but I DO feel like it has an alright chance of heading to that area for a bounce at some point!
What would INVALIDATE THIS is if AVAX pumps above the red "potential neckline" drawn on the chart and HOLDS ABOVE or SLOWLY curves back upwards above it.
***This is just my IDEA and OPINION based off of my experience doing Technical Analysis and Trading. Always do your own research before investing or trading***
Link to UPCOMING BTC SHARP DROP BELOW.
Feel free to LIKE, COMMENT, FOLLOW, and SHARE. I appreciate all of it.
AVAX?USDT breakout soon (watchlistIf the breakout happens the price will go down 56$ probably...
(note: this is not financial advice)

Avax is looking super strongI can see an easy $100 - $150
Avax ecosystem has been growing at exponential rates ngl
Overall very bullish, we can see minor corrections but long term very bullish
Cheers🥂
Avalanche Moving on the wayAVAXusdt is on the channel
Volume included
fly is Near
belive in Avalanche
bulls here people...Runaway
AVAX to $80AVAX with multi time frame squeezes might start to move explosively if these squeezes fire to the upside. My first target is for the near term is $80

🔵AVAX is on a Verge of a Bullish & Bearish Movement!Hi every one
AVAX/USDT
AVAX is in a Symmetrical Triangle Pattern. This Leaves us thinking that Is this Gonna be a Bullish Or Bearish Situation. In Each Diraction the break out happens, The Price is gonna move as much as the measured Price movement (AB=CD) we must wait for the break out to make a Decision.
Summery:
-AVAX is in a symmetrical Triangle
-It's on The verge of Bullish or Bearish Movement
-Break out is gonna Confirm the Price movement
-(AB=CD)
PREVIOUS ANALYSIS:
💎Traders, if you liked this idea or have your opinion on it, write in the comments, We will be glad.
Things can change...
The markets are always changing and even with all these signals, the market changes tend to be strong and fast!!
Thank you for seeing idea .
Have a nice day and Good luck

Avalanche AVAXUSDT - Ascending channel + very bullish coin!- Avalanche AVAX Rank #13 Coin on coinmarketcap.
- The price is above the All Time High level, which is of course very bullish!
- We have a huge parallel channel, which can serve as a resistance on the top of the channel.
- Profit target is top of the channel.
- For expected duration of the trade, probability, stop loss, profit target, entry price and risk to reward ratio ( RRR ) - please check my signature below ↓
- If you want to see more of these ideas, hit "Like" & "Follow"!
- RSI is prepared for the pump!

⭕AVAXUSDT : TP1 got and next ..
Click the pic to read last post and detail.
It did what we predict and we can modify SL to 68.29.
Remember to take profit and give it more time .
✅TP1:79.79
TP2:92.73
TP3:97.96
TP4:109.19
TP5:127.36
If you like this analysis, give it a like or share your thought or let me know what crypto TA you want to know.
AvaxUsdtThere is very beautiful breakout in avaxusdt pair cup and handle break
Entry: 77 to 78
Targets:
1-- 82 usdt the smaller fib level
2-- 90 cap and handle target
3- 98 the fib level 1.68
SL-- 58
Leverage: 2x to 3x maximum
Enjoy the ride

Cup & Handle Confirmed $350 to $550 Target!Possible Blowoff $800Cup and handle played out perfectly and AVAX is about to go on a tear. Indicators are all trending up with strength. This is a strong and powerful chart, and the blowoff top on this one may actually hit $700-$800 depending on how high bitcoin goes. Its a strong probability that my $350-$550 prediction is a modest and conservative number and we probably will see a blowoff of about $800 by mid January 2022. Good luck everyone and please let me know what you think. Follow me as well for updates. Thank you. Not financial advice just my opinion.

AVAX in important zoneAs we can see, this Quinn has reached a good place and in case of defeat of this area and pullback, we can expect good from it.
If he can not successfully pass this level with the top, he expects it to fall according to the figure.
what is your opinion ?
This is a personal analysis and not an investment signal.
be happy
