AVAXUSDHello everyone,
today let's talk about AVAX.
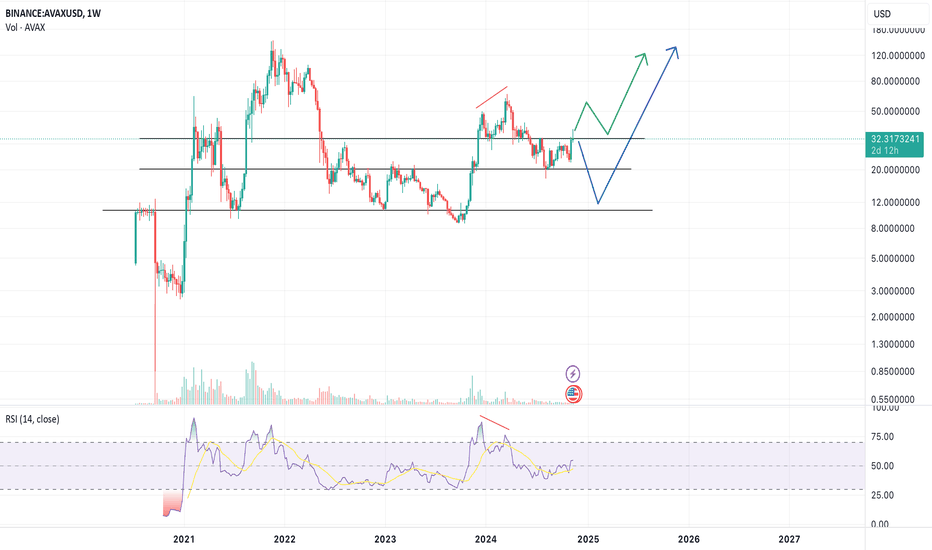
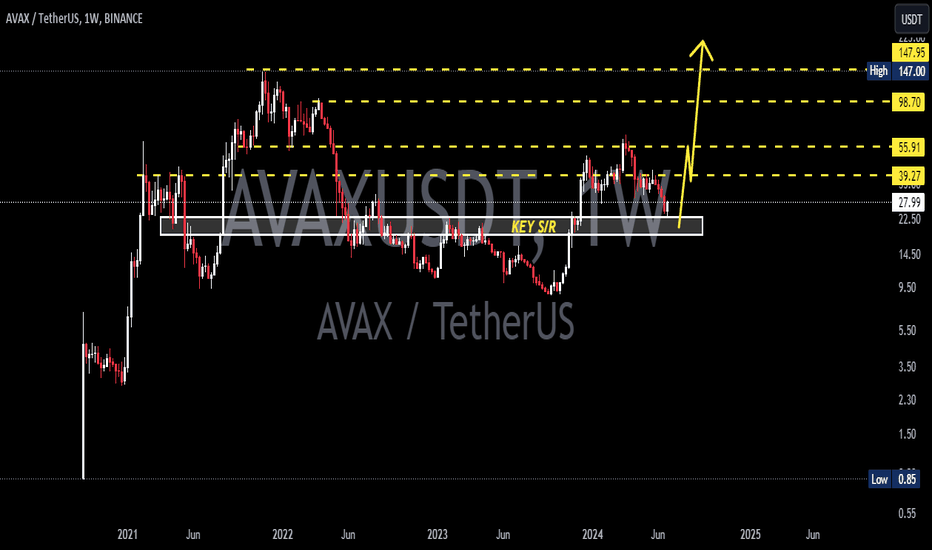
AVAX has already made a 4x from its low at 8.5 USD in 2023. However, it is still far from ATH in 2021 so it still has room to grow.
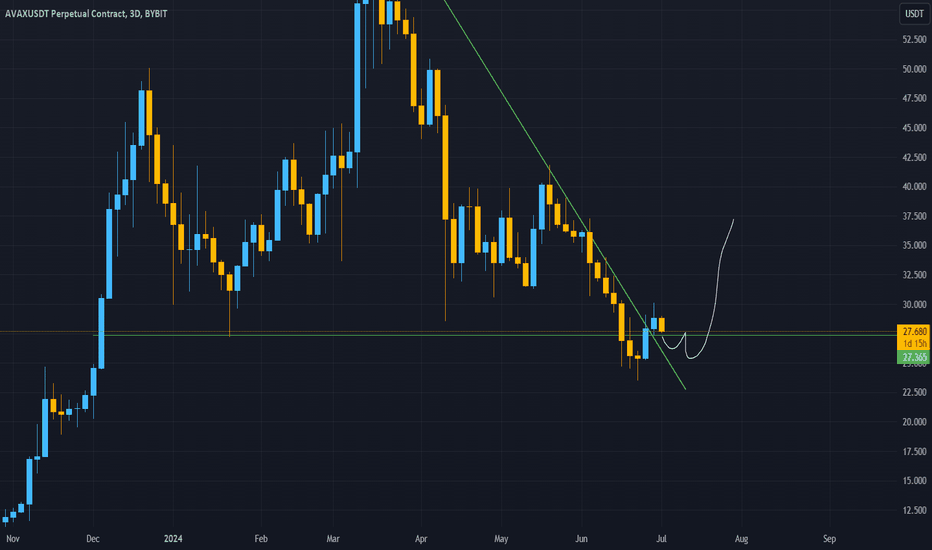
AVAX has shown great respect for 20 USD price and has bounced of it wonderfully, creating a higher low both in price action and in RSI. Currently price is at 32 USD, a previous local high from end of July. If it breaks it to the upside next major resistance is at 55 USD.
RSI also broke over 50 - a bullish sign.
I expect it to go higher in this bull run, however in short term we might witness a pullback to previous level of 20 USD.
Also on AVAXBTC pair chart is coming close to strong base of 0.0003 (currently is around 20% above this).
I expect one of 2 scenarios:
- BTC pulls higher while AVAX stalls for a moment, bringing AVAXBTC to 0.0003 and then AVAX starts following, gaining on BTC.
- Both face a pullback, but AVAX bleeds more. AVAXBTC drops to 0.0003, AVAX drops to 20 USD and then they both bounce, AVAX gaining momentum against BTC.
There are also other possible scenarios, so do take my analysis with a grain of salt and DO YOUR DILLIGENCE.
My strategy:
I will be buying a small portion of AVAX at this price. I will also buy some more if we dip towards 20 USD. In total I will dedicate only a small portion of my portfolio to this pair.
If AVAX falls below 15 USD, I am out and will take a hit.
Good luck.
Avaxusdtanalysis
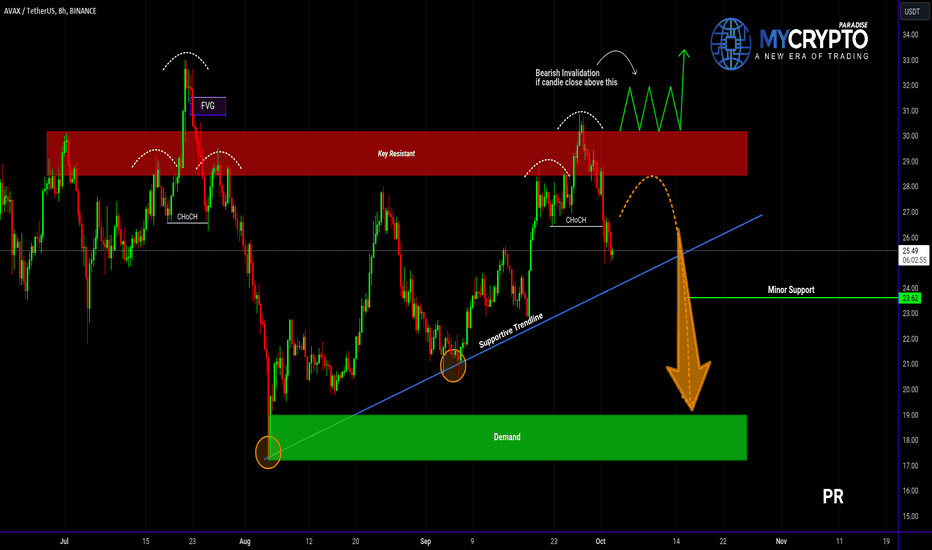
Is AVAXUSDT About to Crash? Here's What You Need to Know!Yello, Paradisers! Are you keeping a close eye on AVAXUSDT? We’re seeing bearish signals that could indicate a major move down! 📉
💎Currently, AVAXUSDT is forming a classic Head and Shoulders pattern from a key resistance zone—a strong indication of a potential bearish reversal. 🧐 On top of that, we’ve spotted a Change of Character (CHoCH) confirming a bearish market structure, further tilting the probability to the downside.
💎But that’s not all. If AVAXUSDT pulls back and we see an Internal CHoCH (I-CHoCH) on the lower time frames, it will strengthen the bearish sentiment and signal an entry opportunity. In this scenario, the right shoulder could develop on the higher time frame.
💎Don’t forget, there’s a supportive trendline nearby that could cause some price reactions. Manage your positions carefully and don’t get caught in a false breakdown.
💎However, if the price shows strength, breaks above the resistance zone, and closes a candle above, it will invalidate our bearish outlook. In this case, it’s a clear no-trade zone until we see a decisive break in either direction.
🎖With the markets always throwing surprises, remember: Stay patient and wait for the highest probability setups. Discipline is key to consistent profitability.
MyCryptoParadise
iFeel the success🌴
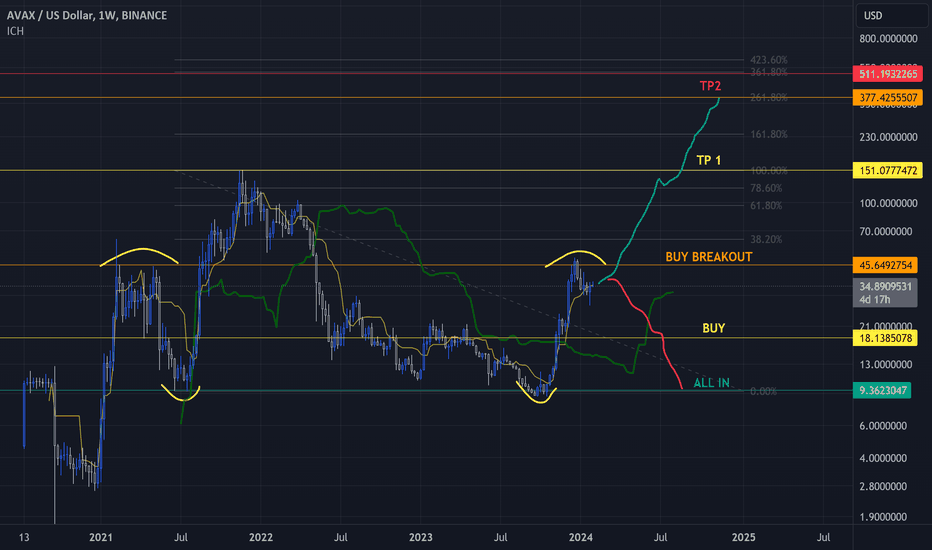
AVAX 2024- Fast Update.
- Everything in Graphic.
- Buy Breakout 50$++. ( always wait Weekly candle on Monday to have confirmation ).
or
- Buy Retracement : 18$ ish ( 25% invest ).
- Buy Bottom : 10$ ish ( 75% invest ).
- TP1 : 150$ ish( old ATH )
- TP2 : before 380 to 500$ ish ( Just don't be greedy ).
Play S4fe
Happy Tr4Ding !
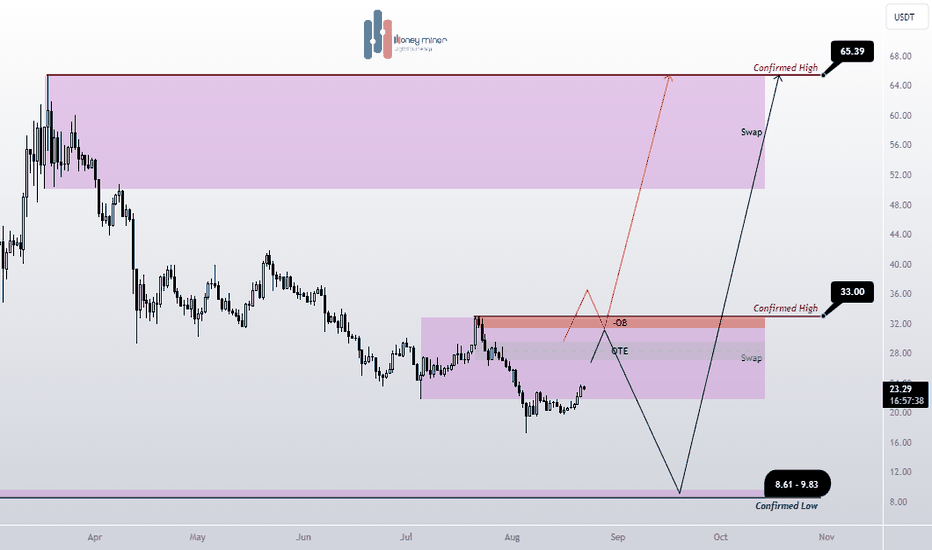
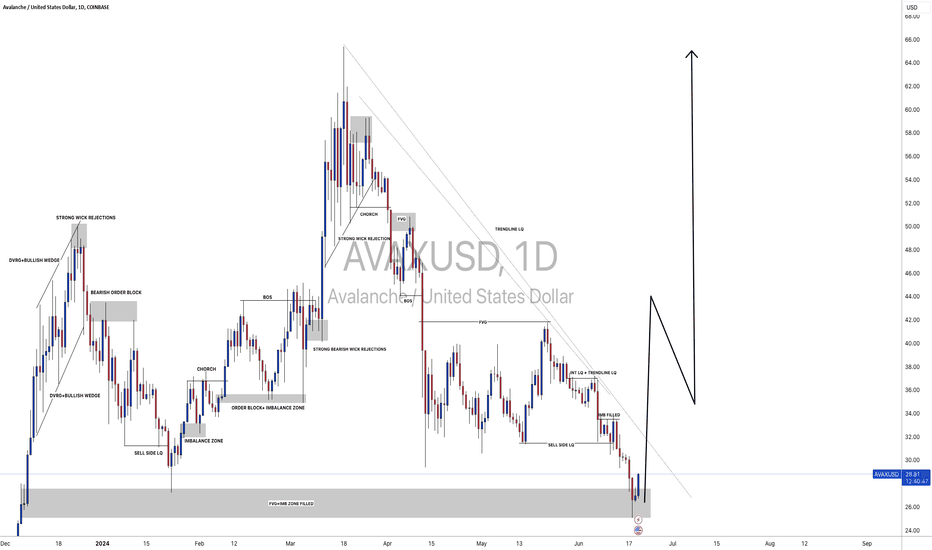
#AVAXUSD: On the way to 66.00, Buy Swing! Dear Traders,
Hope you are doing great, we have an excellent buying opportunity in form of AVAXUSD which is crypto pair with high potential, we can see price filling the imb zone and reversing from that area. Our main aim here is to wait for price to breakthrough the solid bearish trendline, and then enter when price does confirmation.
Team Setupsfx_
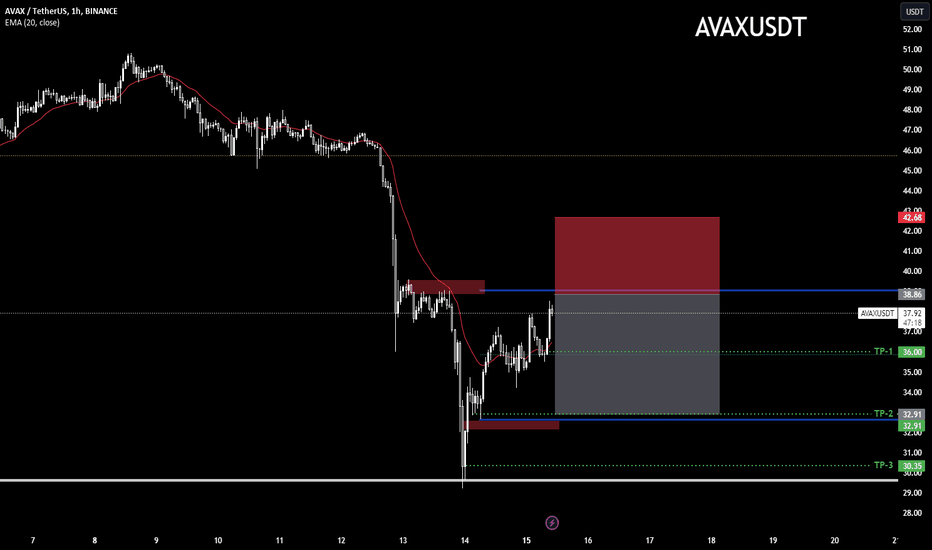
AVAX: sell in high level of reng📊Analysis by AhmadArz:
🔍Entry: 38.86
🛑Stop Loss: 42.68
🎯Take Profit: 36 -32.91 -30.35
🔗"Uncover new opportunities in the world of cryptocurrencies with AhmadArz.
💡Join us on TradingView and expand your investment knowledge with our five years of experience in financial markets."
🚀Please boost and💬 comment to share your thoughts with us!
Avax Premium SignalAlright, folks, check this out. I've got a premium signal straight from the consulting chatroom where we've been hashing things out. Our analysts are in on the juicy stuff, only dealing with insider info from the big players like market makers and whales. Forget about all that technical analysis mumbo jumbo when the heavy hitters are making moves. This deal's set to hit its targets in the next few weeks. None of that trend line or Fibonacci nonsense here. Our endgame? Making bank, plain and simple. And let me tell you, these free signals ain't gonna come around often. Use your noggin, do your own research, and make your moves wisely, alright?
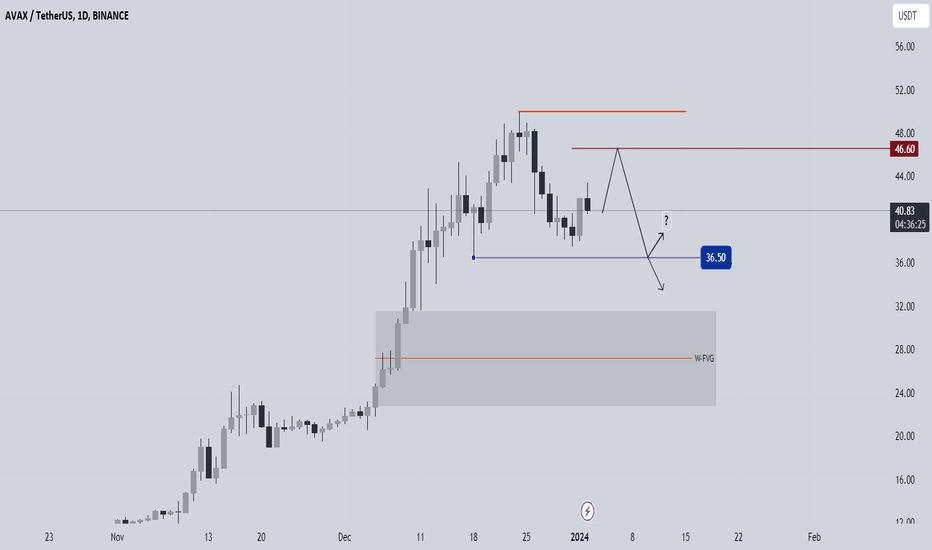
AVAX: sell in trend📊Analysis by AhmadArz:
🔍Entry: 46.22
🛑Stop Loss: 47.59
🎯Take Profit: 44.77-42.68-40.09
🔗"Uncover new opportunities in the world of cryptocurrencies with AhmadArz.
💡Join us on TradingView and expand your investment knowledge with our five years of experience in financial markets."
🚀Please boost and💬 comment to share your thoughts with us!
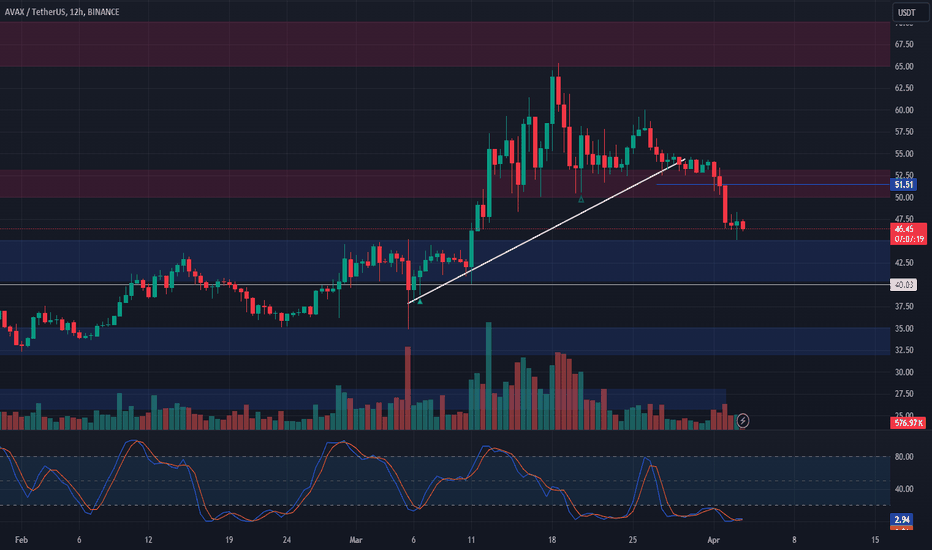
🚀📈 AVAX Spot Trade Setup! 📈🚀
🚀📈 AVAX Spot Trade Setup! 📈🚀
📊 Analysis:
Support Area: AVAX is currently within a support zone, suggesting a potential upward movement.
Market Sentiment: Positive outlook for bounce in selected altcoins.
Upside Potential: Targets set at resistance levels.
📈 Trade Plan:
Entry: Consider entering in the $40 - $45 support area.
Take Profit: Target profits at $50 - $53 or higher towards $65 - $70.
Stop Loss: Set stop loss just below $40.00 to manage risk.
💡 Note: Keep an eye on price action for confirmation of bounce and adjust strategy accordingly! Stay vigilant in monitoring market movements. 🚀📈 #AVAX #SpotTrade 🛒💰
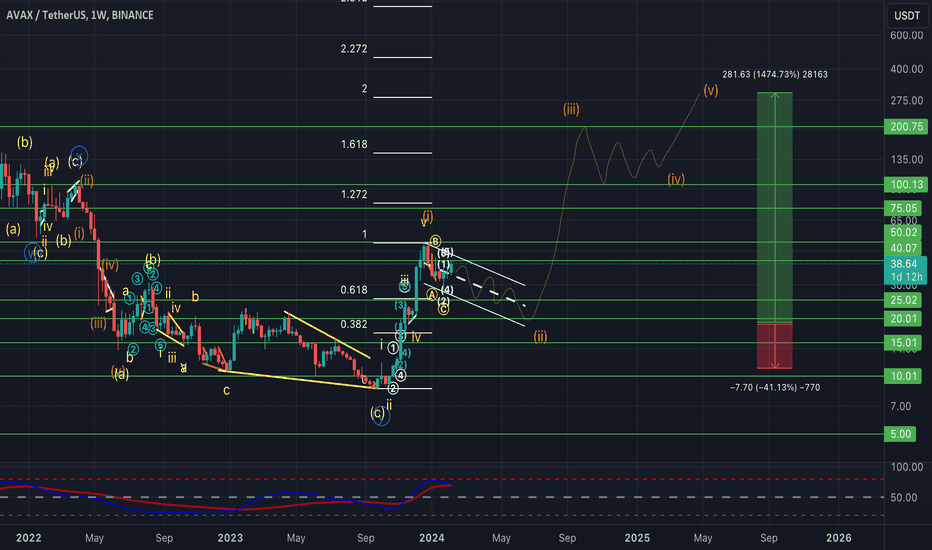
AVAXUSDT Elliott Waves (Investment Idea)Hello friends.
Please support my work by clicking the LIKE button👍(If you liked). Also i will appreciate for ur activity. Thank you!
Everything on the chart.
Main(investment) target zone: 250-300
Targets: 75 - 150 - 250
Cancellation of setup - consolidation under ~11
RR: 1 to ~35
risk is justified
Good luck everyone!
Follow me on TRADINGView, if you don't want to miss my next analysis or signals.
It's not financial advice.
Dont Forget, always make your own research before to trade my ideas!
Open to any questions and suggestions
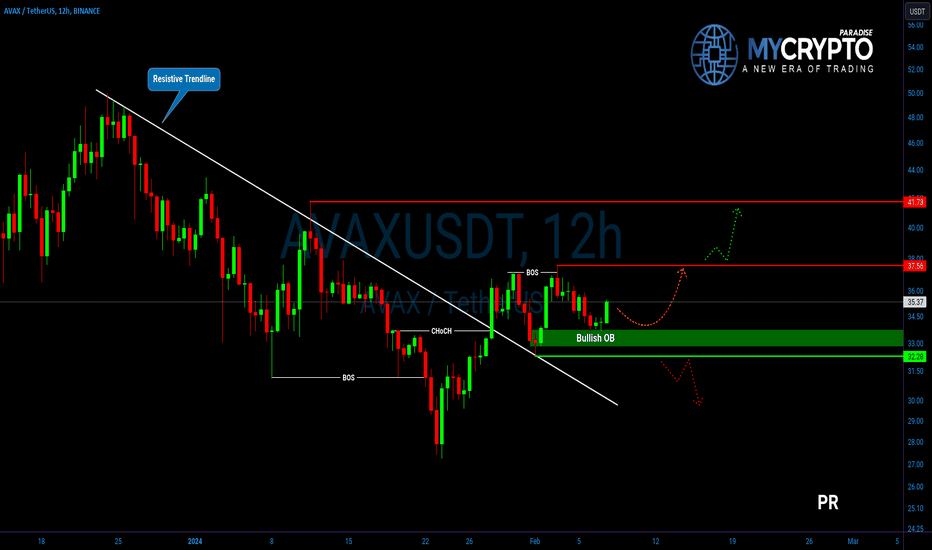
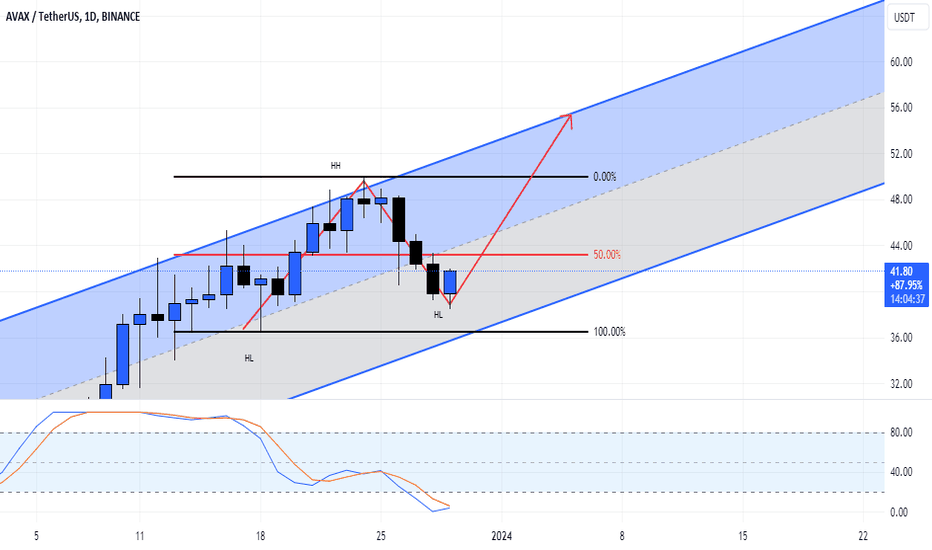
AVAX: Bullish Trend Continues Amid Correction Phase💎AVAX is currently in an overall bullish trend, with the market undergoing a correction phase. This correction phase is characterized by the Break Of Structure (BOS) formation following the CHoCH (change of character), indicating a bullish structure. Additionally, there is evidence of a strong bullish sentiment as reflected by the formation of a large bullish candle from the bullish Order Block (OB).
💎The formation of this bullish candle from the OB increases the probability of a bullish movement towards the next supply area around 37. If the price manages to break above this level, it would signify another BOS formation, potentially providing further bullish opportunities on pullbacks until the next resistance level of 41.73 is reached.
💎On the bearish side, a breakdown below the low level of 32.28 would indicate that bears are still in control of the market. In such a scenario, we could expect further correction towards the next support level around 29.31.
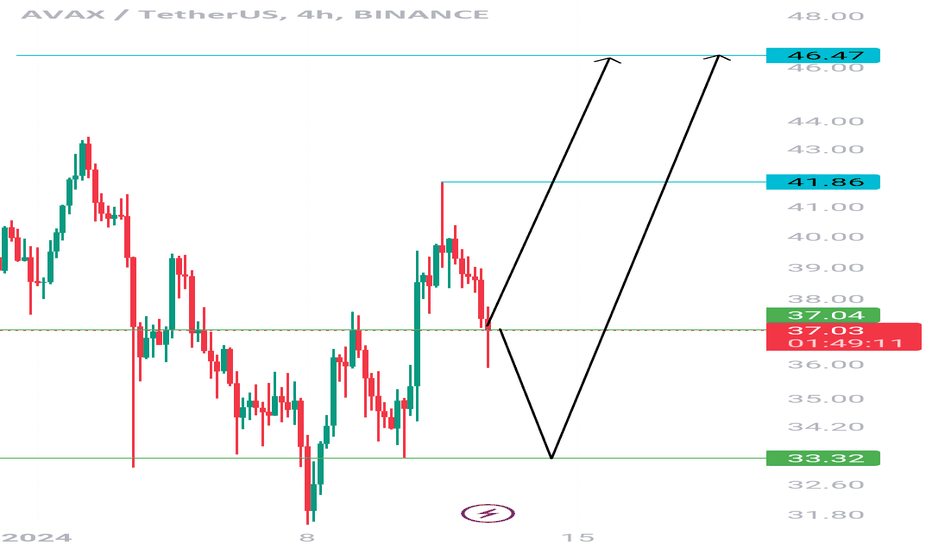
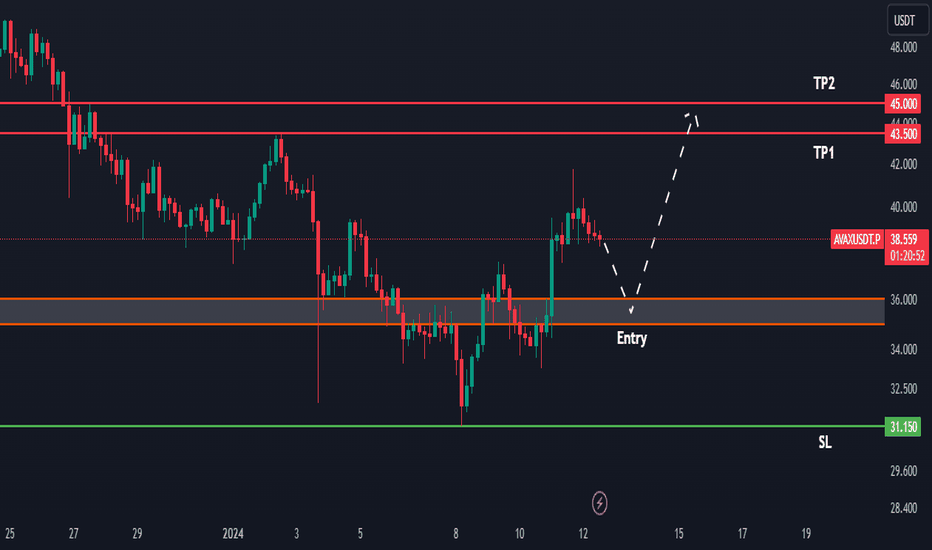
Avax/Usdt Trading Idea 💹AVAX/Usdt is currently showing bullish signs 📈. The market structure has turned into a bullish pattern, and the price is retracing to test a new demand area 🔄. This could signify a potential upward movement. I anticipate a rise in price from this point, potentially ranging between 15-30% 📈🔥.
Remember, this analysis is not financial advice ❌📉. Always conduct your own research (DYOR) and make informed decisions. Happy trading! 💪💰📊
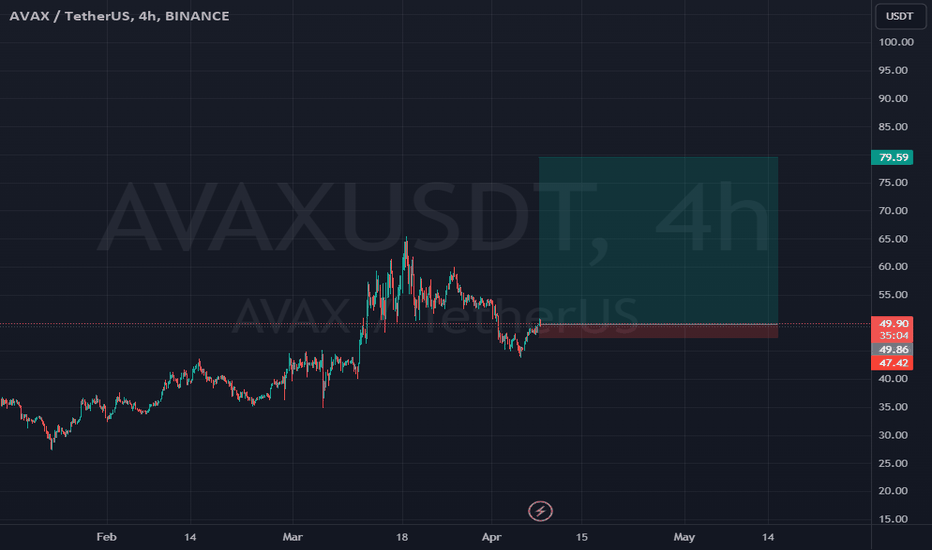
AVAXUSDT: 4HR VIEW BINANCE:AVAXUSDT currently in consolidation phase, few candles show some bullish character and we expect a nice clean move from this area. Though, if price decides to remain bearish then it can fall further down where there is imbalance which price will likely to fill before it touches the 55.00 region.
What do you think about this pair, do you think it will create a new record?
AVAXUSDT - CRYPTO TIPWelcome to my TradingView profile! In this article, we will embark on a journey together to explore the intriguing prospects of AVAXUSDT, guided by the fundamental principles of market structure and Fibonacci retracement. I invite you to join me in analyzing one of the most traded currency pairs.
Our primary instruments will be market structure, the identification of the trend direction, and the application of Fibonacci levels. We will delve into how these factors can provide meaningful insights for making informed trading decisions.
he inclusion of detailed charts and illustrations will aid in visualizing the discussed concepts. We will explore key Fibonacci retracement levels and how they interact with the overall market structure.
This will be an informative article, focusing on understanding the market context and applying fundamental concepts of technical analysis. The goal is to provide a clear perspective and stimulate critical thinking within our trading community.
If you find this analysis valuable, I encourage you to subscribe to stay updated on my latest posts and market analyses. This is just the beginning, and subscribing will allow you to be among the first to receive updates and trading ideas.
Feel free to make any adjustments or let me know if there's anything specific you'd like to modify!
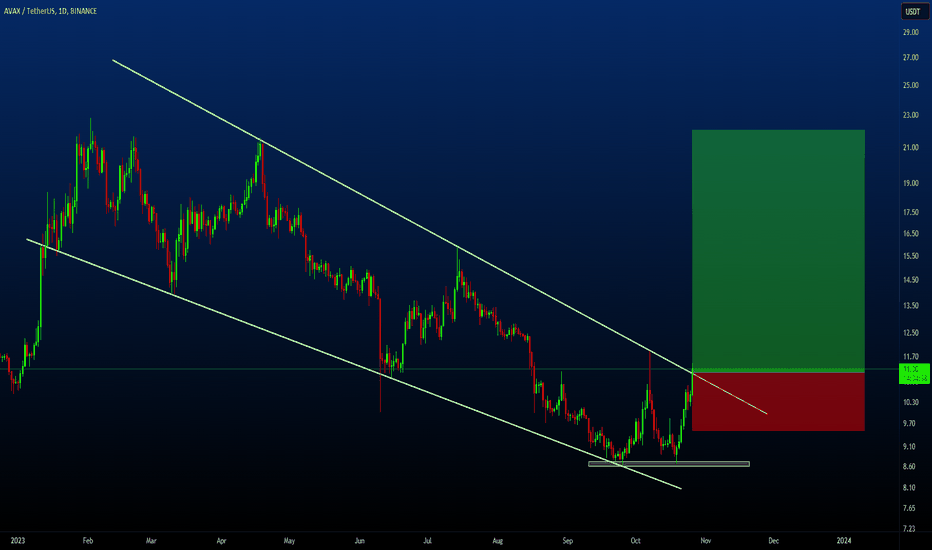
AVAXUSDT - LONG Setup!!AVAXUSDT (1D Chart) Technical analysis
AVAXUSDT (1D Chart) Currently trading at $11.3
Buy level: Above $11.2
Stop loss: Below $9.5
TP1: $12.5
TP2: $15
TP3: $18
TP4: $22
Max Leverage 2x
Always keep Stop loss
Follow Our Tradingview Account for More Technical Analysis Updates, | Like, Share and Comment Your thoughts
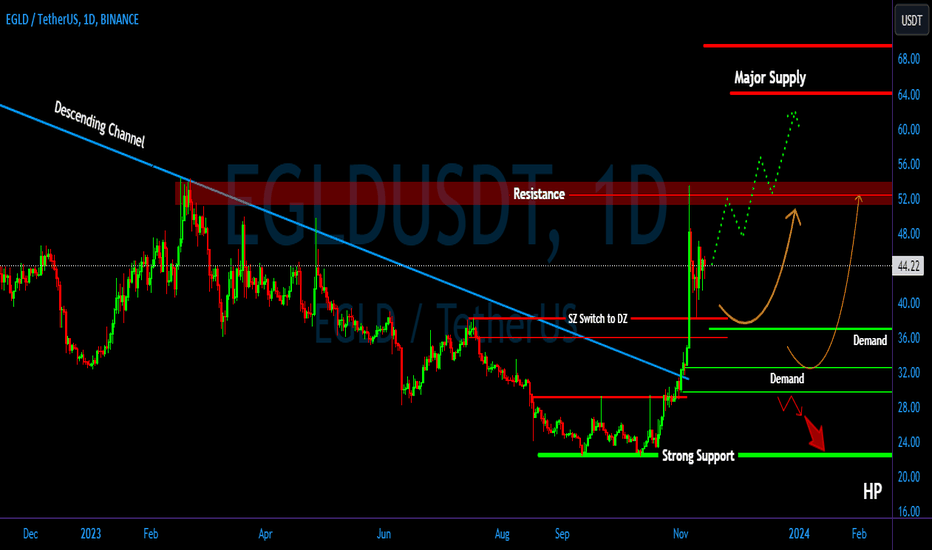
EGLD/USDT it required break the resistance to continue upward!!💎 EGLD has undoubtedly captured significant market attention. It executed a flawless breakout from the supply area, marked by substantial volume and a robust green bullish candle. However, encountering a formidable rejection in the resistance area prompted EGLD to initiate a retesting phase at the demand area spanning $38.20 to $36, which previously served as the supply area.
💎 Presently, EGLD is in a consolidation phase within the range of the resistance and demand areas. To sustain its upward momentum, EGLD needs to break out of the resistance. A successful breakout holds the probability for EGLD to smoothly ascend and reach our target area. However, failure to attempt a breakout in the near future may lead EGLD back to testing the demand area.
💎 In the event that EGLD revisits the supply area of $38.20 to $36 and undergoes a breakdown of the demand area, there's a likelihood of EGLD descending to the subsequent lower demand zone at $33 to $30. EGLD retains a chance for an upward reversal, contingent on a bounce from the demand area at $33, reclaiming the support level at $38.20.
💎 The unfavorable scenario unfolds if, during the retesting at the demand, EGLD struggles to sustain its position and breaches the demand area. In such a scenario, EGLD would revert to a bearish movement, potentially retracing to the robust support area.
