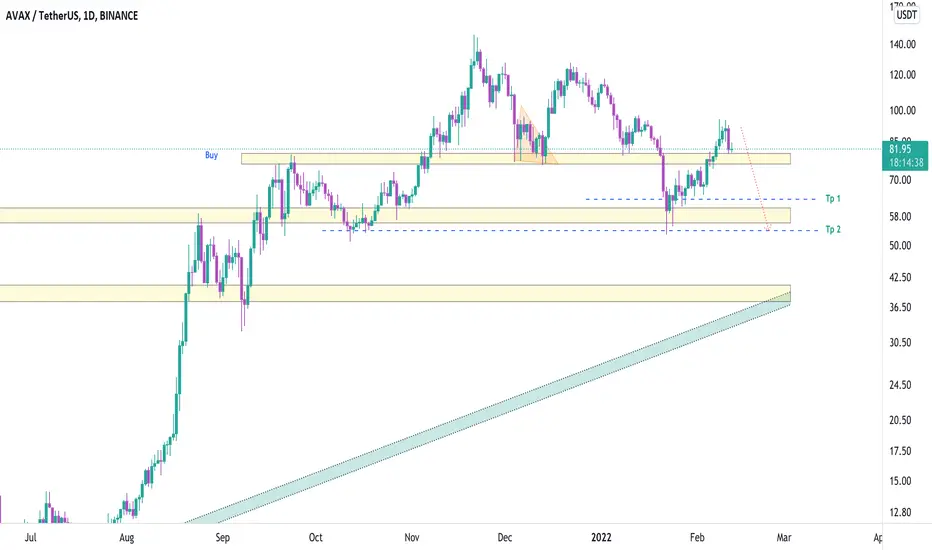
Buying AVAX/USDT here AVAX secondary breakout Bullish flag and valid retest after breakout
Rejection after hit support trend line,
Daily RSI on accumulation zone at the time MACD bullish crossover , good setup for entry
Target mentioned on the chart
Stoploss :$74
Avaxusdtlong

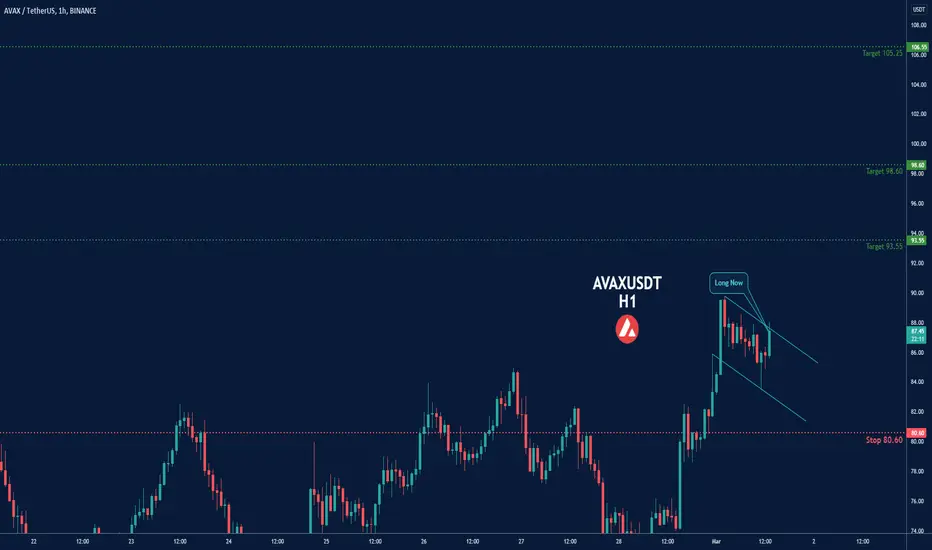
AVAXUSDT-LONGBased on technical factors there is a long position in :
📊 AVAXUSDT Avalanche
🔵 Long Now 87.40
🧯 Stop loss 80.60
🏹 Target 1 93.55
🏹 Target 2 98.60
🏹 Target 3 106.55
💸Capital : 1%
We hope it is profitable for you ❤️
Please support our activity with your likes👍 and comments📝
AVAXUSDT long for today's perp I was not posting for a few weeks I was (and I am) learning Price Action so now I'm back and I'll share more of my ideas with you guys. Hope you enjoy them <3
Avax is most likely to get to the target I've shown on the chart in the next few hours. Hope there is no new war news though

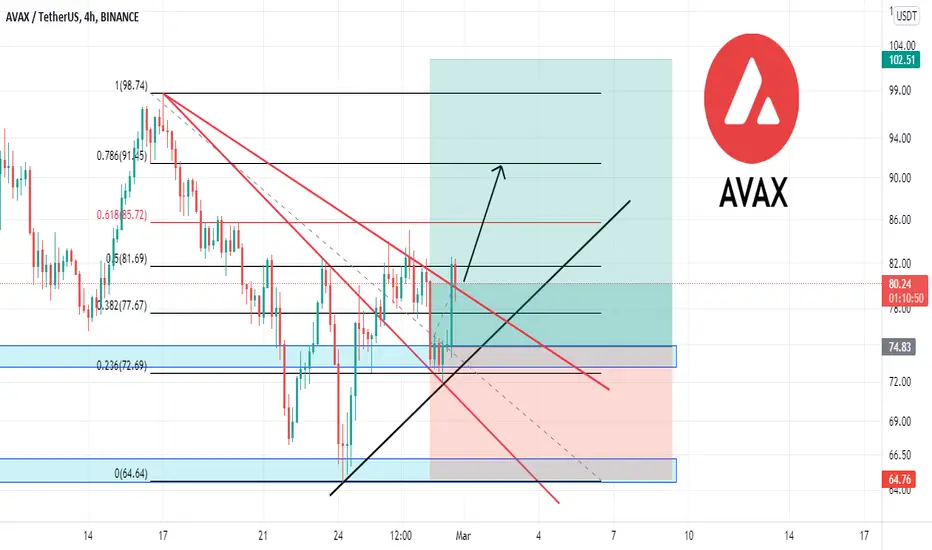
AVAXUSDT AVALANCHE CHARTTrading Signal:
A Trading Signal is seen in the AVAXUSDT Avalanche .
Traders can open their Buy Trades NOW
⬆️Buy now 74.82$
⭕️SL: Close below 64.76
🔵TP @ 102.51
Move SL in
hat are these signals based on?
Classical Technical Analysis
Price Action Candlesticks Fibonacci
RSI , Moving Average ,SMOOTHED Ichimoku , Trend
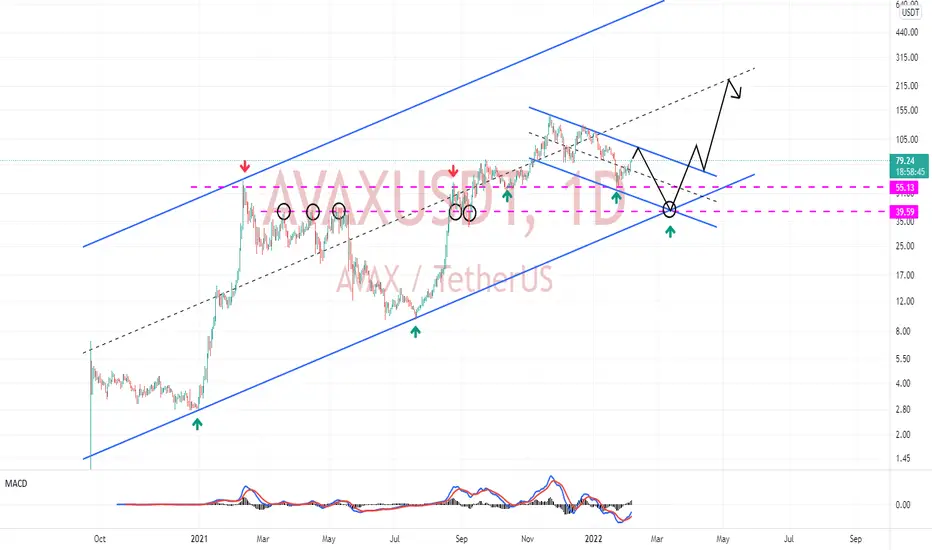
AVAX USDT Trading SetupWe are expecting smooth ride on Avax usd
Expect a 3 wave correction
and then position yourself
for a smooth ride to 100-110

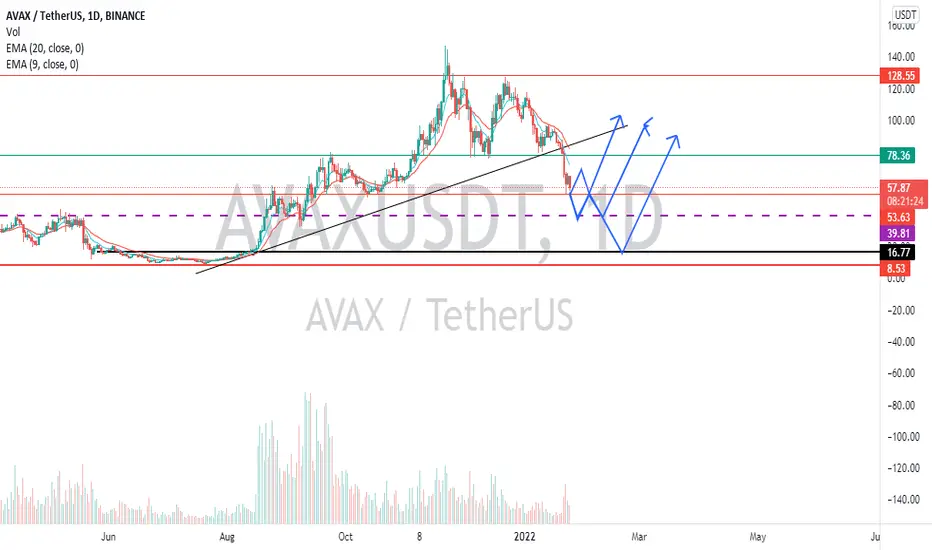
AVAX 1D Three Levels to Buy LongToday we will consider the chart of AVAXUSDT, the price of which has almost doubled in a month.
But first let's look at our previous idea, where the white route with a projected growth from $40 to $140 worked out completely
As you can see from the AVAXUSD chart, before strong growth impulses, the price likes to be in consolidation to form a bullish flag for a long time.
We also assume the same correction at this stage, which gives us three possible outcomes:
1. The price will either break through and consolidate above $100 in the next few days, or there will be a shallow correction, not below $76 - and then open way for growth with the first target of $200-210.
2. A deeper correction, but without updating this year's low, i.e., not below $60. A consolidation above this level will open the way for growth, with the first target of $200-210 as well.
3. A deep and prolonged correction to the area of $40-45 , from where we had the previous growth. This is a strong mirror level and if the buyers become aggressively active there again and show their serious intentions, it will be possible to buy a large position. The target for growth is $400+ for AVAX, with a very ambitious x10 from the buying zone.
_______________________________
Since 2016 , we have been analyzing and trading the cryptocurrency market.
We transform our knowledge, trading moods and experience into ideas. Each "like under the idea" boosts the level of our happiness by 0.05%. If we help you to be calmer and richer — help us to be happier :)
AVAXUSDT AnalysisHello friends.
Please support my work by clicking the LIKE button👍(If you liked). Also i will appreciate for ur activity. Thank you!
Everything on the chart.
I've bought by 64, if we go below 55, I will buy more from the 40-35 zone.
Entry: market and lower
Target: 80 - 120 - 180
after first target reached move ur stop to breakeven
Stop: (depending of ur risk). ALWAYS follow ur RM .
risk is justified
Good luck everyone!
Follow me on TRADINGView, if you don't want to miss my next analysis or signals.
It's not financial advice.
Dont Forget, always make your own research before to trade my ideas!
Open to any questions and suggestions.

AVAX, key level breakout as a good buying opportunity!A trend line and key level can be identified on the AVAX chart. The price broke the trend line and tried to break through the key level, but immediately returned below the key level.
This could be a false breakout, but in case the price comes back, squeezes, and breaks the key level there could be a good buying opportunity.
Write in the comments all your questions and instruments analysis of which you want to see.
Friends, push the like button, write a comment, and share with your mates - that would be the best THANK YOU.
P.S. I personally will open entry if the price will show it according to my strategy.
Always make your analysis before a trade.


AVAXUSDT Buy setup!!AVAXUSDT (1D Chart) Technical analysis
Channel Breakout
AVAXUSDT (1D Chart) Currently trading at $90
Buy level:Above $91
Stop loss: Below $64
TP1: $100
TP2: $118
TP3: $132
TP4: $150
Max Leverage 2x
Always keep Stop loss
Follow Our Tradingview Account for More Technical Analysis Updates, | Like, Share and Comment Your thoughts.

💡Don't miss the great buy opportunity in AVAXUSD @avalancheavaxTrading suggestion:
". There is a possibility of temporary retracement to the suggested support line (79.59).
. if so, traders can set orders based on Price Action and expect to reach short-term targets."
Technical analysis:
. AVAXUSD is in a range bound, and the beginning of an uptrend is expected.
. The price is above the 21-Day WEMA, which acts as a dynamic support.
. The RSI is at 61.
Take Profits:
TP1= @ 83.63
TP2= @ 87.65
TP3= @ 91.64
TP4= @ 95.59
TP5= @ 99.38
SL= Break below S2
❤️ If you find this helpful and want more FREE forecasts in TradingView
. . . . . Please show your support back,
. . . . . . . . Hit the 👍 LIKE button,
. . . . . . . . . . Drop some feedback below in the comment!
❤️ Your support is very much 🙏 appreciated!❤️
💎 Want us to help you become a better Forex / Crypto trader?
Now, It's your turn!
Be sure to leave a comment; let us know how you see this opportunity and forecast.
Trade well, ❤️
ForecastCity English Support Team ❤️

AVAXUSDT, Its time to have some move down Hello everybody
If you want to learn Fundamental & Technical analysis send us messages ---> Our id is in profile
AVAX is one of the most powerful project that is working on many property base and it can be the future because ...
According to the chart and previous analysis, exactly the price recovery it self from the support zone area and had some rised.
But until now the trend of the price was not changed and the trend is downward and we should only take short position because is according to the trend.
Also you can put your stop loss at the higher shadow of the candle a little upper and put our target exactly very we put and observe your capital management.
Good Luck
Abtin
Previous analysis :
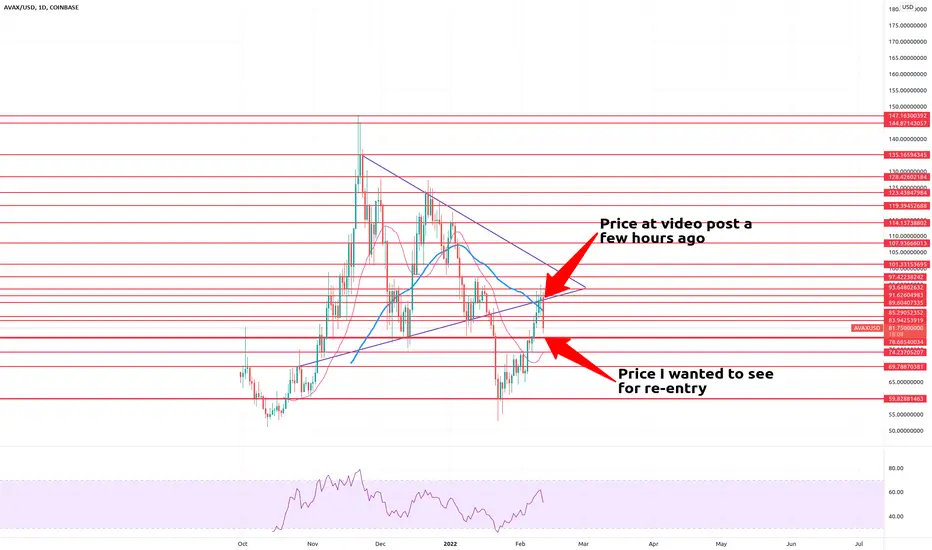
AVAX Avalanche Entry Price ReachedTraders,
I didn't think it would happen in hours. I doubted it would happen within days.
A few hours ago, I did video analysis on AVAX. At that point it was pushing up into the purple triangle. I remained skeptical it would remain on the top side of the purple line by candle close. The price I was looking to reach on the downside was $78-80. I expected we might get there in a week or so, maybe days. But we almost did it in a few hours. If you snagged this up at the low then congrats to you. The power of technical analysis is shown once again.
- Stewdamus
AVAX - Here's where I am looking to re-enter.#avax #avaxusd #avalanche #altcoins
My current sentiment and some technical analysis for you on AVAX.
Sorry about the view. I forgot to transition and just didn't feel like doing the video over again.
- Stew

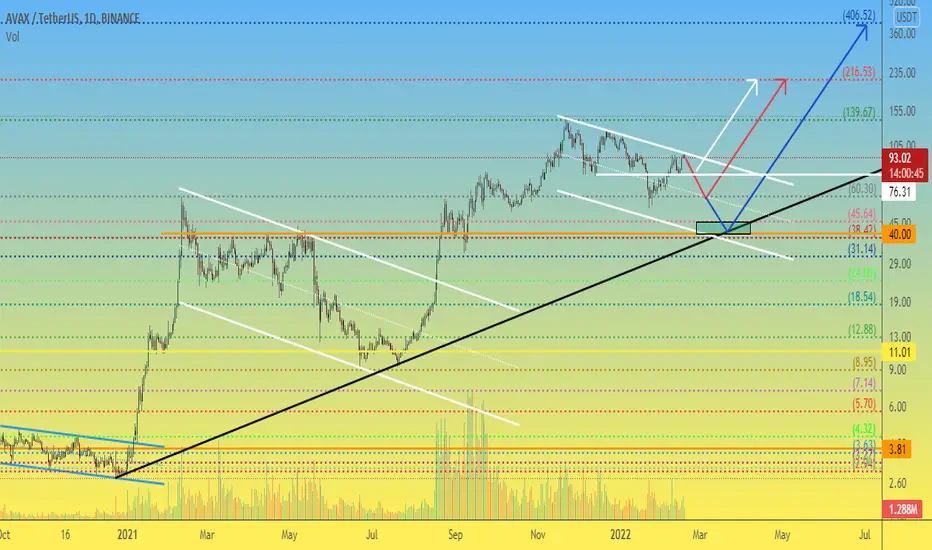
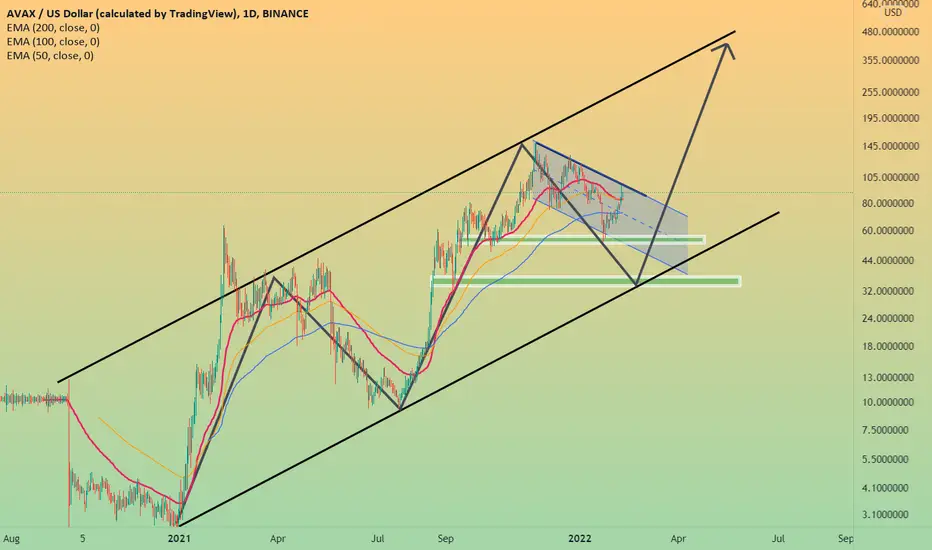
AVAX will skyrocket after correction (10x)- Starting from Jan 2021 an upward trend was formed which still valid till now.
- Since November peak a correction wave started and it supposed to end in Feb - April.
- Correction wave still progressing , descending channel points to 55 then 35 as a dip.
- Buy later at 55 as first buy zone , 35 as second buy zone.
- After correction we gonna see upside movement targeting the channel peak (275 - 375).
- We can say no other correction if price managed to break above 97 n close daily above it.
AVAXUSDT 4h Hello,
This clean chart of AVAXUSDT is based on VWAP (48) and Volume profile.
NB : I think volume indicators are more efficient with this small cryptocurrency market.
Follow me on Tradingview if you don't want to miss my next analysis.

AVALANCHEHello traders. The price will fall to the bottom of the downtrend channel and return to 40$. Are you agree?
AVAX/USDT⚠️FUTURES & SPOT
🟥Short
🔥Entery: 69 _ 74
☑️Lev: 3 _ 5x
💸TARGETS:
🎯Target¹ : 68
🎯Target² : 66
🎯Target³ : 64
🎯Target⁴ : 62
🎟Stop Loss: 79

AvaxA scalp long idea on AVAX u may try
Looks like its having a good support in lower TFs whilst its not wise to hold long term trades in this kind of range market caused by BTC

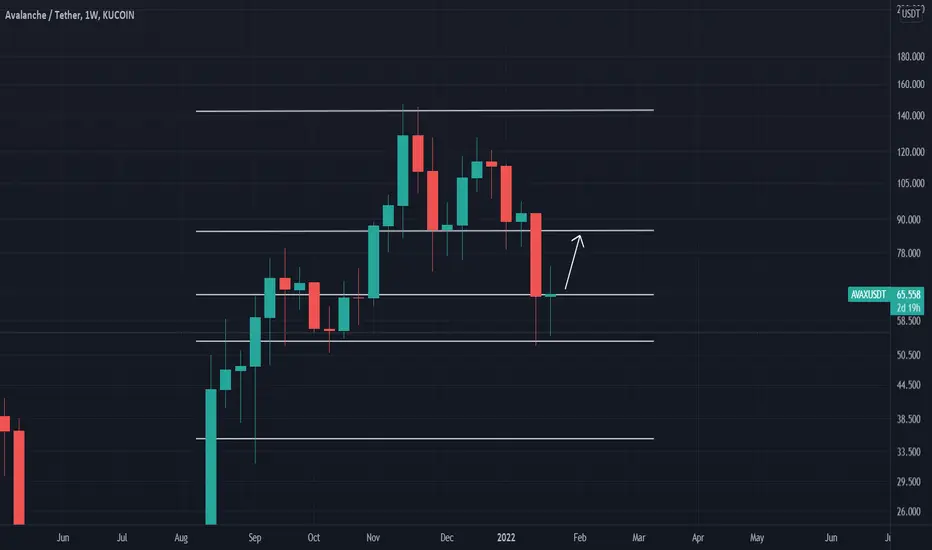
AVAX recovery to $86 imbound!Hello traders,
Here I present to you the Weekly Candles Chart of Avalanche (AVAX.) Some key S/R levels are drawn here, we bounced off $53 perfectly and currently are testing the $65 level. Then if we confidently bounce from this we can hit $86 easily in the short term. Hope that helped...
Safe trading,
-Pulkanator
AVAXNot financial advice.
The essence of investing & trading is the intelligent and patient preying on the greed, fear, impatience, addiction and ignorance of the majority. It's definitionally Darwinian.

AVAX: Pump or Dump?We were all happy when this coin was rising to the moon but right now it is in a reversal and it seems it is returning back to its starting line.
Without much words, on my analysis, I expect the coin to bump back at the following prices: the current market price, $40, or $18. A downward breakout will give short traders an entry and the next predicted price becomes the TP.
Enjoy Trading.