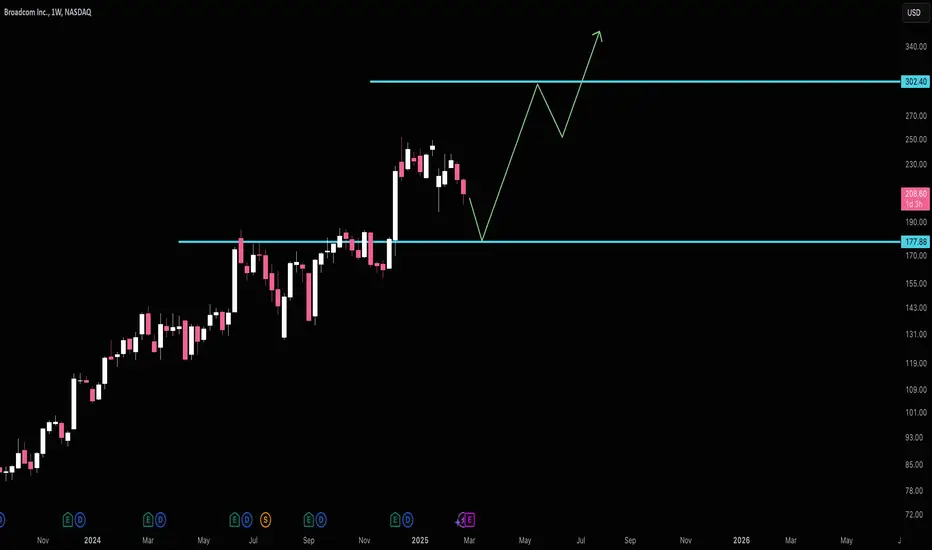
Broadcom Middle of Range RisksI like Broadcom if it gets down to $178. Right now it's still floating from the AAPL news. I wouldn't be inclined to sell here, but if looking to buy (like myself) I'd wait in hopes for $178.
Target (Potential Next Support) $302.
Good luck!
AVGO
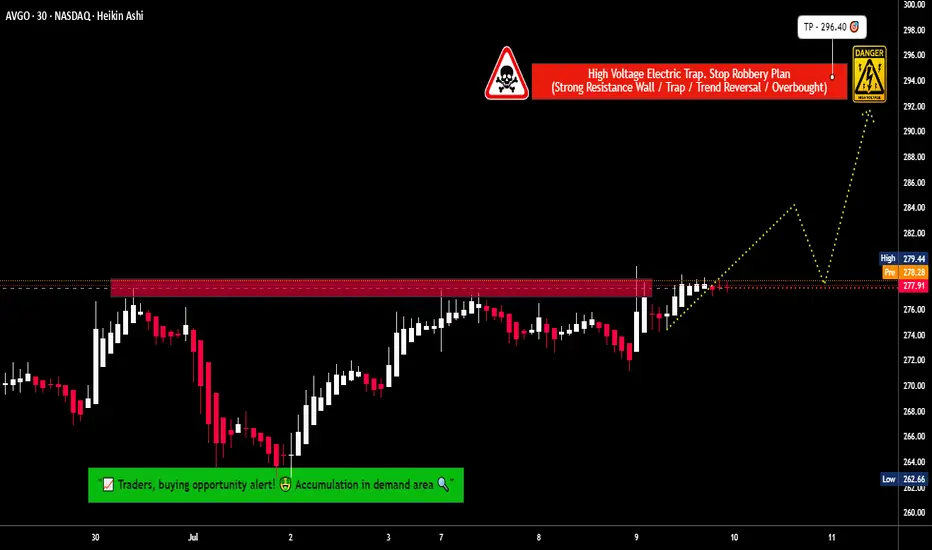
Steal the Breakout: Broadcom Bulls Are In!💎🔓 "Broadcom Break-In: Bullish Vault Raid in Progress!" 🔓💎
🌟Hi! Hola! Ola! Bonjour! Hallo! Marhaba!🌟
Dear Money Makers & Market Robbers 🤑💰✈️,
It’s time for a high-stakes raid on BROADCOM, INC (AVGO) — all based on our secret Thief Trading Strategy™, combining sharp technicals & a sniff of fundamentals.
🕵️♂️ Mission Brief:
Our target is the Bullish Vault – a swing/day trade play with upside momentum. The chart reveals a possible trap at overbought zones where unsuspecting bears get lured in... and we walk out rich! 😏💸
🎯 The Heist Blueprint:
📥 Entry (Buy-In Point):
🚪 “The vault’s open – grab the bullish bags!”
Swipe any bullish setup on the 15m/30m timeframe
Ideal: Buy Limit near recent swing low (support levels)
📳 Set alerts to stay ready – we rob smart, not fast
🛑 Stop-Loss (Escape Plan):
Place SL below recent 30m swing low — approx. 269.00
Adjust by your lot size & number of trades
Don't risk the whole bag – we ain't greedy thieves 😈
📈 Target (Take-Profit Point):
🎯 First Exit Zone: 296.00
💨 Or vanish before the cops (market reversal) arrive
🧲 Scalpers’ Secret:
Only scalp long – don’t fight the bullish flow
Got big capital? Enter early. Small bag? Join the swing crew
Use Trailing SL to guard your stolen gains 🏦🔐
💡 Behind the Heist:
AVGO is showing bullishness thanks to:
📰 Macro Drivers • COT Reports • Institutional Bias
📊 Sentiment Analysis • Index Correlations
💥 Geopolitical Developments – Always stay updated
🔎 Want more intel? Dive into the news, fundamentals, & positioning data that power this trade idea 💣
⚠️ Trade Smart, Thieves:
📛 News events cause chaos – avoid fresh entries during releases
📉 Use trailing stops to secure your loot & dodge slippage
💖 Like the Heist Plan? Hit Boost!
Let’s build the most notorious money-making crew on TradingView! 🚀
Daily gains using the Thief Style™ – not for the faint-hearted.
🔒 Stay sharp, trade like a phantom, and keep stacking that digital cash!
💬 Drop a comment if you’re in the gang – another plan’s coming soon! 🤑🐱👤
📌 Note: This is a general market analysis. Do your own due diligence before risking real capital.
📌 Stay updated — the market changes fast. Adapt or get trapped.
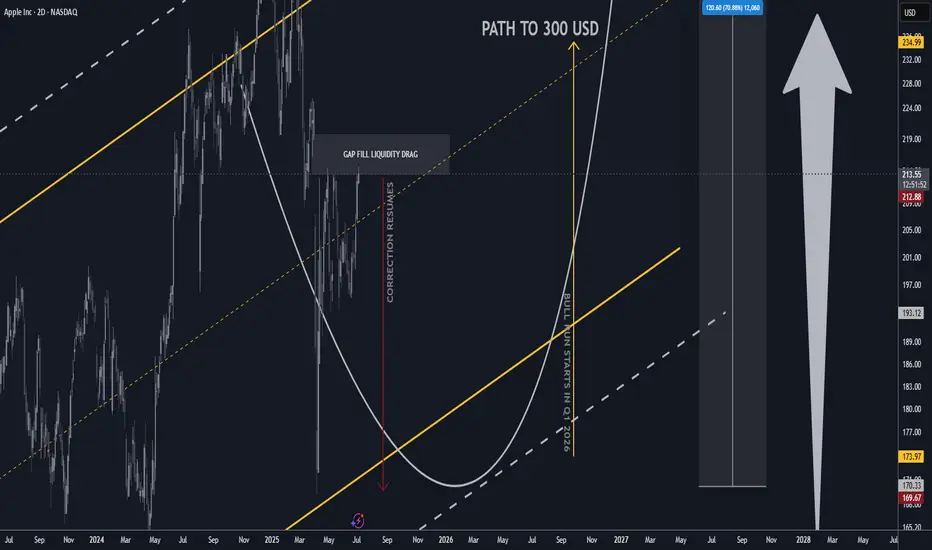
AAAPL: Updated Outlook and Best Level to BUY/HOLD 70% gains________________________________________
Apple Outlook: July 2025–Q1 2026
After peaking near $200 in late May, Apple (AAPL) remains under correction territory despite pockets of resilience, closing July around $193. The current correction is projected to persist until Q1 2026, as global macro and policy headwinds weigh on the broader tech sector. Technicals suggest AAPL could find its cycle low between Q3 and Q4 2025, potentially setting the stage for a renewed bull run into late 2026. Pullback until 170/175 USD. 📉
Catalysts Shaping Apple’s Stock Price in 2025–26
1. AI Integration and Apple Intelligence
Strength: 9/10
The roll-out of on-device Apple Intelligence features—including an upgraded Siri, ChatGPT integrations, and generative AI tools—continues to build anticipation for a major iPhone upgrade supercycle. Initial adoption has been strong, but broader impact will hinge on Q4 developer and enterprise feedback. 🤖
2. Services Segment Growth
Strength: 8.5/10
Apple’s Services business (App Store, iCloud, Apple Music, AI-powered subscriptions) is projected to post double-digit growth into Q4 2025, with consensus revenue estimates at $25–27B for the quarter. Analysts see upside from new AI-driven service bundles, which could add $5–8B in annualized revenue by 2026. 💡
3. Gross Margin Expansion & Cost Efficiencies
Strength: 8/10
Apple’s gross margin is forecast to improve by up to 60 basis points in Q4 2025 as the product mix tilts toward higher-margin services, and as component costs ease. Operational efficiencies from supply-chain automation may further cushion profit margins amid macro uncertainty. 📊
4. iPhone 17 Product Cycle
Strength: 7.5/10
The iPhone 17 lineup—rumored to include advanced polymer batteries and potential foldable form factors—is expected to launch Q4 2025, giving Apple a competitive hardware edge versus Android rivals. Early channel checks point to pent-up demand, though upgrade rates may lag previous cycles due to consumer caution. 📱
5. Vision Pro & Hardware Diversification
Strength: 7/10
Next-gen Vision Pro headsets and new AR/VR devices, boosted by Apple Intelligence, are expected to drive incremental growth in Q4 2025. However, high price points and limited mainstream adoption keep near-term impact contained. 🥽
6. Share Buybacks & Dividend Policy
Strength: 7/10
Apple’s $110B share buyback authorization and steady dividend growth provide valuation support, but recent market volatility has prompted a more cautious pace of repurchases. Yield-seeking investors are watching closely for any pivot in capital return policy if macro pressures persist. 💵
7. Supply Chain & Trade Policy Risks
Strength: 6.5/10
Escalating U.S.–China trade tensions—including the risk of expanded tariffs or tech export bans—remain a top concern. Apple is accelerating its assembly shift toward India and Vietnam to diversify risk, but any new policy shocks in Q4 could hit margins and unit volumes. 🌏
8. Regulatory & Antitrust Pressures
Strength: 6/10
The EU’s Digital Markets Act and potential U.S. antitrust probes could force Apple to further open up its iOS ecosystem by year-end, potentially capping Services revenue growth and adding compliance costs. ⚖️
9. Macro & Interest-Rate Environment
Strength: 5/10
With the Fed signaling “higher for longer” rates through mid-2026, tech sector valuations remain under pressure. Analysts see this limiting multiple expansion even if EPS growth resumes in late 2025. 📈
10. Smartphone Market Competition
Strength: 5/10
Aggressive pricing and innovation from Samsung and Chinese OEMs are intensifying competitive pressures, especially in emerging markets. Apple’s share gains are likely to slow until the macro environment improves and new hardware cycles fully materialize. 🥊
________________________________________
Analyst Projections for Q4 2025:
• Consensus Revenue: $108–112B (up ~4% YoY)
• EPS Estimate: $2.30–$2.42
• Gross Margin: 45–46%
• iPhone Unit Growth: 2–3%
• Services Revenue: $25–27B
Morgan Stanley and JP Morgan maintain “Overweight” ratings, but expect rangebound performance until macro and trade uncertainty clears. Most price targets for Q4 2025 hover between $195–$215, with upside potential post-correction into 2026. 📊
________________________________________
Analyst / Firm Date Rating Price Target (USD)
Barclays 06/24/2025 – 173 ()
Jefferies (E. Lee) 07/01/2025 Hold (Upgraded) 188.32
UBS (D. Vogt) 07/03/2025 – 210.00
J.P. Morgan (S. Chatterjee) 06/26/2025 Overweight 230.00
Morgan Stanley (E. Woodring) 03/12/2025 Overweight 252.00
Evercore ISI 01/31/2025 – 260.00
Redburn Partners 01/31/2025 – 230.00
D.A. Davidson (G. Luria) 05/02/2025 – 250.00
TradingView Consensus (avg) – Consensus 228.98
TipRanks Consensus (avg over 3mo) – Consensus 226.36
Broadcom - This was just the first all time high!Broadcom - NASDAQ:AVGO - just created new highs:
(click chart above to see the in depth analysis👆🏻)
Over the course of the past three months, Broadcom has been rallying an impressive +80%. However looking at market structure, all of the previous "dump and pump" was not unexpected. Following this recent bullish strength, Broadcom is likely to channel a lot higher.
Levels to watch: $250, $400
Keep your long term vision!
Philip (BasicTrading)

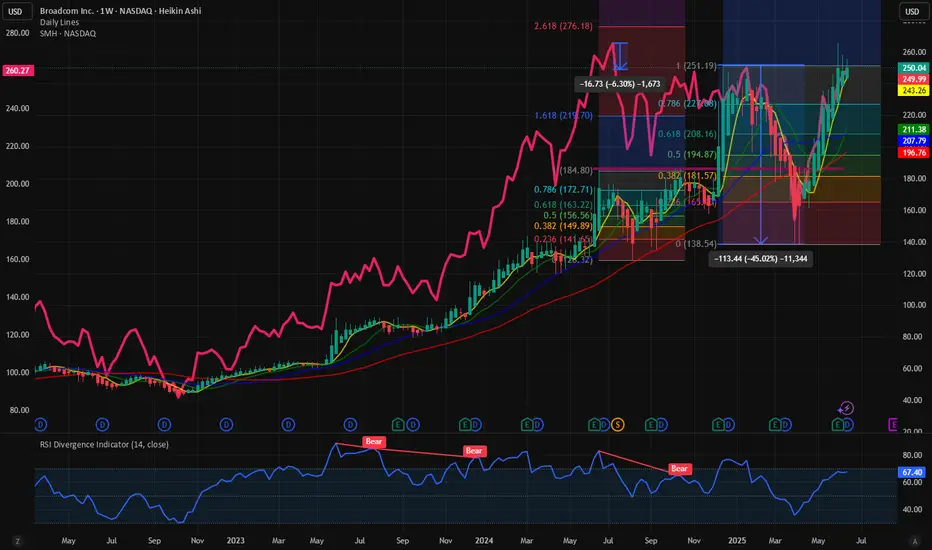
$AVGO above its previous ATH and holding on. 400 $ reachable. The poster child of the AI rally has been NASDAQ:NVDA and $AVGO. Here we have analysed both the stocks multiple times fundamentally and technically. But the lesser known NASDAQ:AVGO has performed better than the NASDAQ:NVDA since the April lows. NASDAQ:AVGO is still above its previous ATH and closed above yesterday which was 242 $ in Jan 2025. NASDAQ:NVDA is still below its Jan 2025 highs of 152 $.
The Semis index NASDAQ:SMH is also 6.3% below its ATH of 262 $. So not many stocks in this index have a more bullish chart than $AVGO. My assessment is that NASDAQ:AVGO will continue its dominant outperformance in the NASDAQ:SMH sector in comparison to others like $NVDA.
Going back to technical and plotting the Fib Extension levels form the last bull run before Aug 2024 we can see that the next possible near-term target is 275 $, a 10% upside form here and in the medium term the target is 400 $.
Verdict : Long NASDAQ:AVGO over NASDAQ:SMH and $NVDA. First Target 275 $ then we go to 400 $.
AVGO – All-Time High Breakout with Flag Pattern TriggerBroadcom ( NASDAQ:AVGO ) is breaking out of an 11-day consolidation flag, pushing through the trendline and into all-time highs — a textbook momentum setup.
🔹 Flag Pattern Breakout
After a strong run, NASDAQ:AVGO spent 11 days chopping in a tight flag just under highs.
Today, we’re seeing a clean trendline break, signaling the start of a potential fresh leg higher.
ATH breakout + flag pattern = momentum trader’s dream.
🔹 My Trade Plan:
1️⃣ Entry: Long on the flag breakout and trendline break.
2️⃣ Risk Level: Stop is down at $247, just under the consolidation base.
3️⃣ Target: Riding the trend — trailing stop strategy once price confirms above highs.
Why I Like This Setup:
Strong consolidation near highs = no weakness.
Breakout is happening with clean structure and clear volume pickup.
NASDAQ:AVGO is a leader name — when it goes, it goes.
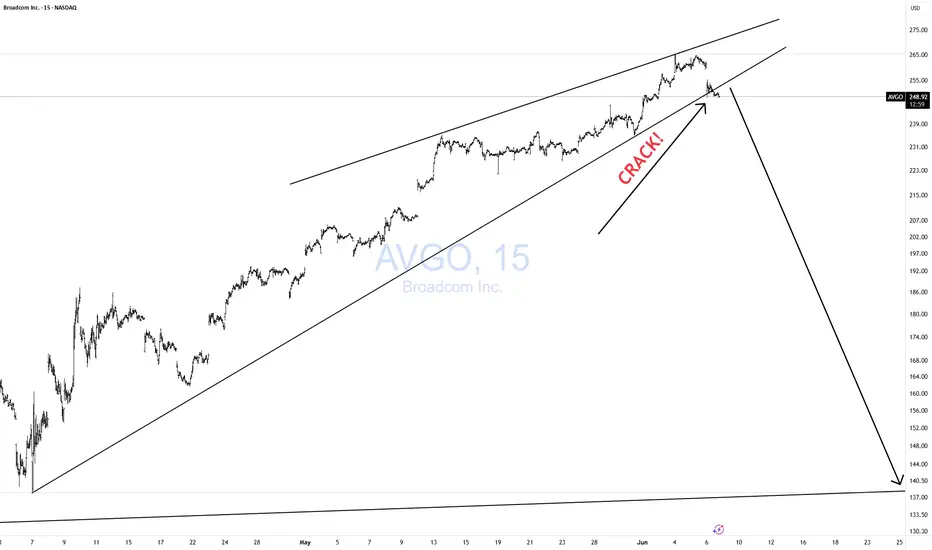
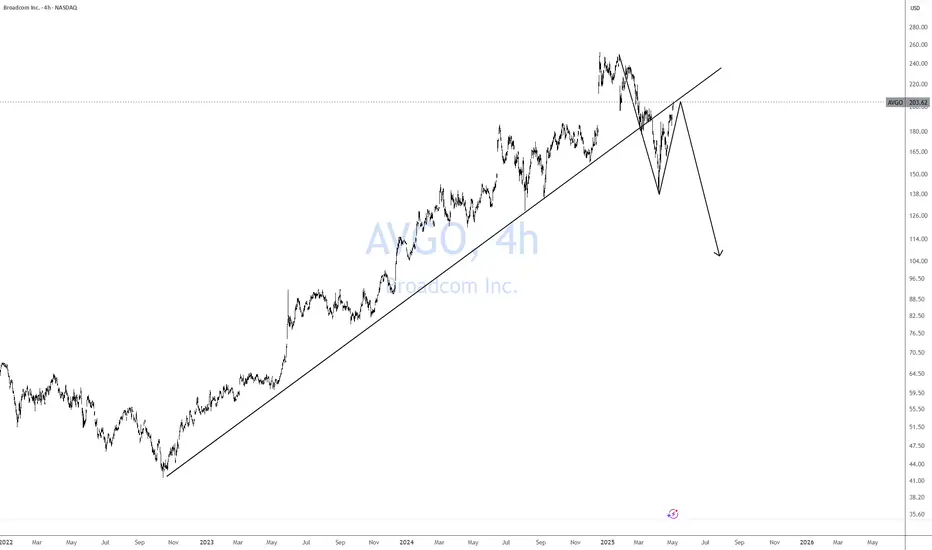
AVGO CRACK!Fun while it lasted.
Even though I like AVGO, a crack is a crack is a crack!
Rising bearish wedge.
Time to take profits.
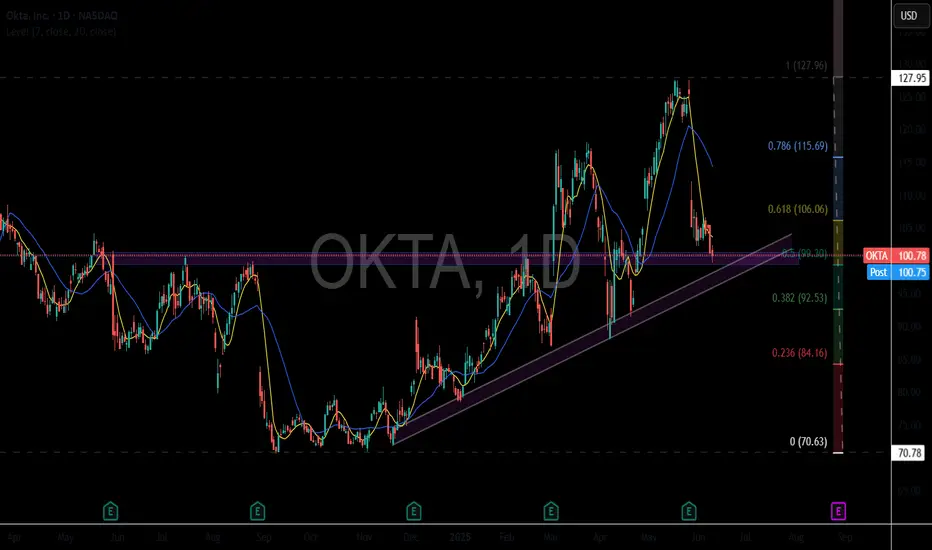
OKTA - DAY TRADE IDEAOKTA is setting up for a day trade scalp long...perhaps an aggressive swing trade as well. The day trade is a much higher probability of success around the $98.50-$99.30
Okta's stock has seen some volatility recently. After a strong rally earlier this year, it pulled back following cautious guidance from the company. Despite beating expectations on sales and earnings for Q1 fiscal 2026, investors were concerned about slowing growth, leading to a 14.6% drop in its stock price.
Okta reported $688 million in revenue, a 12% year-over-year increase, and positive free cash flow of $238 million, but its GAAP earnings were significantly lower than its adjusted earnings. The company maintained its full-year revenue forecast of $2.85 billion to $2.86 billion, reflecting 9% to 10% growth, but analysts tempered their optimism due to macroeconomic uncertainties.
Technicals
- Multiyear Support
- 50 % Fib Retrace
- Upsloping Trendline
- Positive Divergence building on 1/ 4 hour chart.
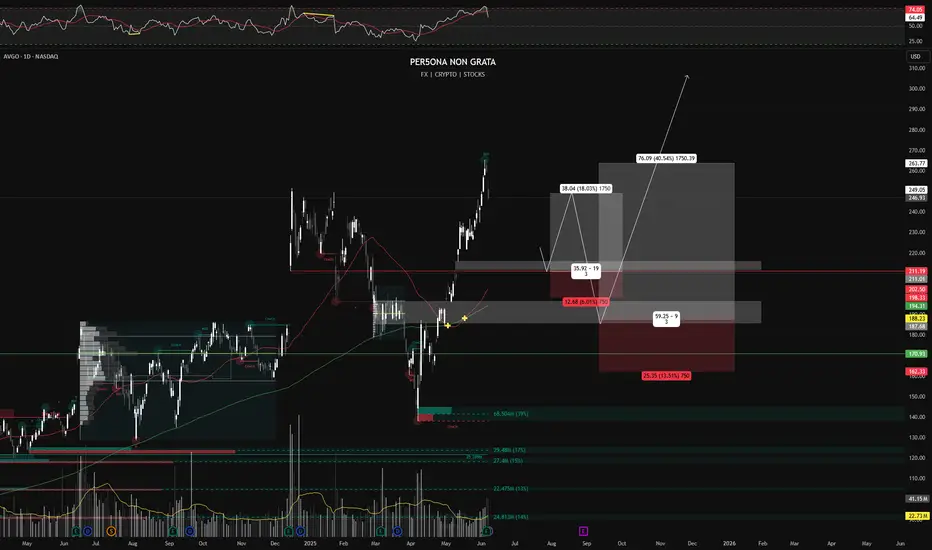
LONG | AVGO (Broadcom) | 1DScenario 1 – Pullback to Structure Zone
Entry: $211.01
Stop Loss: $198.33
Target: $259.05
Risk:Reward: ~1:3
Structure: Pullback to key fib level (~38.2%) and prior breakout base.
Market Logic: Reclaiming structure post pullback; trend resumption with minimal drawdown.
Scenario 2 – Deep Demand Zone
Entry: $187.68
Stop Loss: $162.10
Target: $263.77
Risk:Reward: ~1:3
Structure: 61.8% fib + institutional demand cluster; "if market breaks deep", re-entry possible here.
Market Logic: Value-buy zone; often unfilled unless broad market correction. Ideal for swing/position trader allocations.
_______________________________
Business Model & Sector Positioning
Core Focus: Broadcom designs and develops semiconductors and infrastructure software solutions. Their chips power AI data centers, 5G infrastructure and cloud networking—key growth pillars.
AI Exposure: AVGO provides custom silicon to hyperscalers like Google and Meta. Its next-gen networking and AI accelerator chips are integral to expanding AI workloads, which fuels earnings upside.
Earnings & Financial Momentum
Recent Results (Q2 FY25):
Revenue up ~43% YoY, beating consensus.
EPS surged ~50% YoY, driven by data center demand.
AI-related revenues now make up nearly 25% of total sales.
Guidance Raised: Management upgraded full-year revenue targets—signaling internal confidence.
Analyst Consensus & Institutional Flow
Buy Ratings: >85% of analysts rate AVGO a Buy.
Price Targets: Median PTs have moved from $260 to $285 post-earnings.
Ownership: High institutional interest—Vanguard, BlackRock and State Street are among top holders.
Dividends: Pays a sustainable dividend (~1.8% yield), increasing yearly—strong signal of financial health.
Macro Environment
Interest Rate Outlook: With the Fed expected to cut by late 2025, tech stocks are well-positioned. Lower yields boost growth stock valuations like AVGO.
Capex Trends: Global cloud providers are increasing AI data center spending—Broadcom is a primary beneficiary.
___________________________
Conclusion
Why The Setups Work Fundamentally:
$211.01 Entry: Technical pullback + fundamental tailwind from raised guidance.
$187.68 Entry: Deep value zone backed by secular demand + institutional conviction in AI.
Both zones represent opportunistic entries into one of the most fundamentally sound AI infrastructure plays, with upside tied to macro tech trends, strong earnings, and durable cash flow.
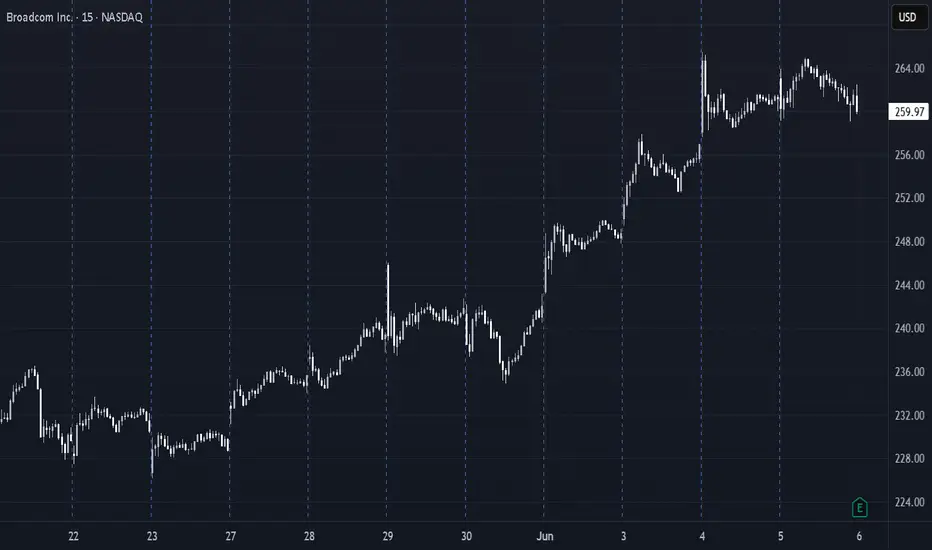
AVGO Earnings Setup – Overbought + “Sell the News” Risk 💥 AVGO Earnings Setup – Overbought + “Sell the News” Risk 🚨
📆 Earnings Date: June 5, 2025 (AMC)
🎯 Strategy: One-day event play using short-dated puts
🧠 Model Consensus Breakdown
Model Bias Strike Trade Type Confidence Notes
Grok/xAI 🟢 Bullish 262.5C Call 70% Sector momentum, IV high
Claude 🔴 Bearish 250P Put 65% Overbought RSI, max pain risk
Llama 🟢 Bullish 265C Call 80% Earnings momentum continues
Gemini 🔴 Bearish 242.5P Put 65% “Sell the news” scenario
DeepSeek 🔴 Bearish 237.5P Put 68% Institutional unwind
✅ Net Lean: Moderately Bearish (3 vs. 2)
📈 RSI > 80 across models → strong overbought condition
💣 Max Pain at $245 → gravity risk if earnings disappoint
📉 Elevated IV (75–85%) → IV crush post-earnings expected
🔎 Earnings Setup Snapshot
Current Price: ~$258.20
Historical Move (Earnings): ±5.9%
Implied Move (Straddle): ~6.15% → ~$16
Max Pain: $245
IV Rank: 0.75 → premiums rich
Overbought RSI: 82.6
✅ Recommended Trade Setup
Parameter Value
Instrument AVGO
Direction PUT (SHORT)
Strike 242.50
Expiry 2025-06-06
Entry Price $1.88 (ask)
Profit Target $4.70 (+150%)
Stop Loss $1.88 (full risk)
Position Size 1 contract (~3% risk)
Entry Timing pre-earnings close (6/5)
Exit Timing next-day open (6/6)
Confidence 67%
🧮 Breakeven: $240.62
🧠 Why this strike?
Inside expected move range
OTM → strong R:R
Low premium, defined risk
Aligned with bearish consensus
⚠️ Key Risks to Monitor
🔼 Strong beat + guidance → upside surprise
🌀 IV crush could outpace downside move
🟢 Broad market strength / sector rally
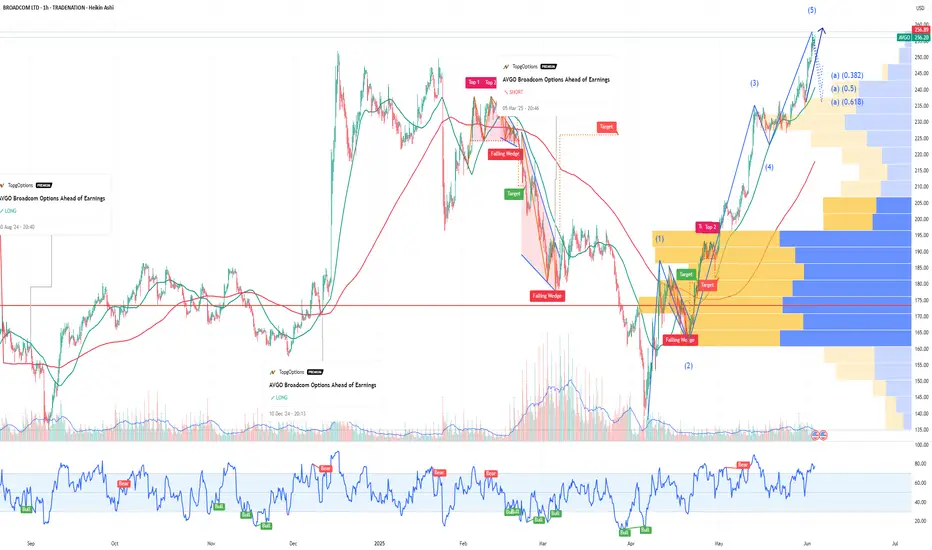
AVGO Broadcom Options Ahead of EarningsIf you haven`t bought AVGO before the rally:
Now analyzing the options chain and the chart patterns of AVGO Broadcom prior to the earnings report this week,
I would consider purchasing the 250usd strike price Calls with
an expiration date of 2025-6-13,
for a premium of approximately $14.75.
If these options prove to be profitable prior to the earnings release, I would sell at least half of them.
Disclosure: I am part of Trade Nation's Influencer program and receive a monthly fee for using their TradingView charts in my analysis.
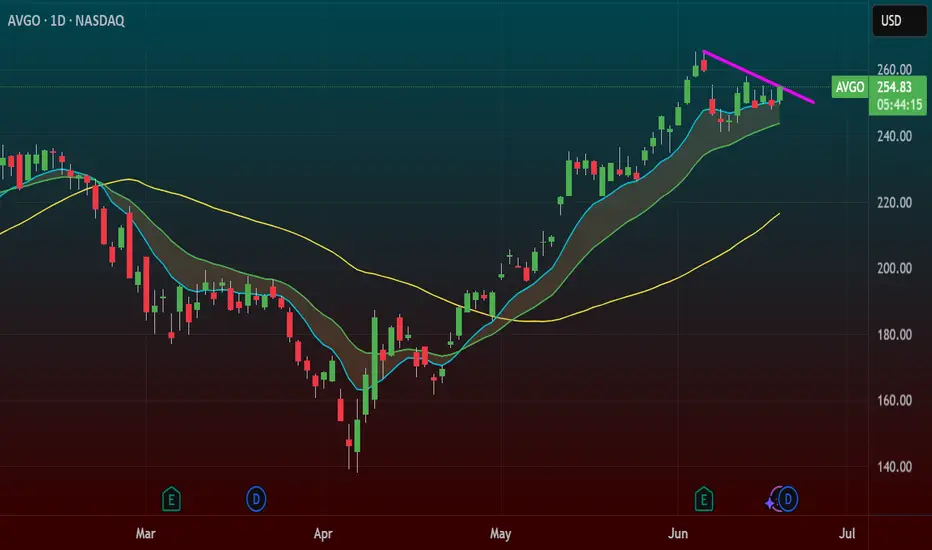
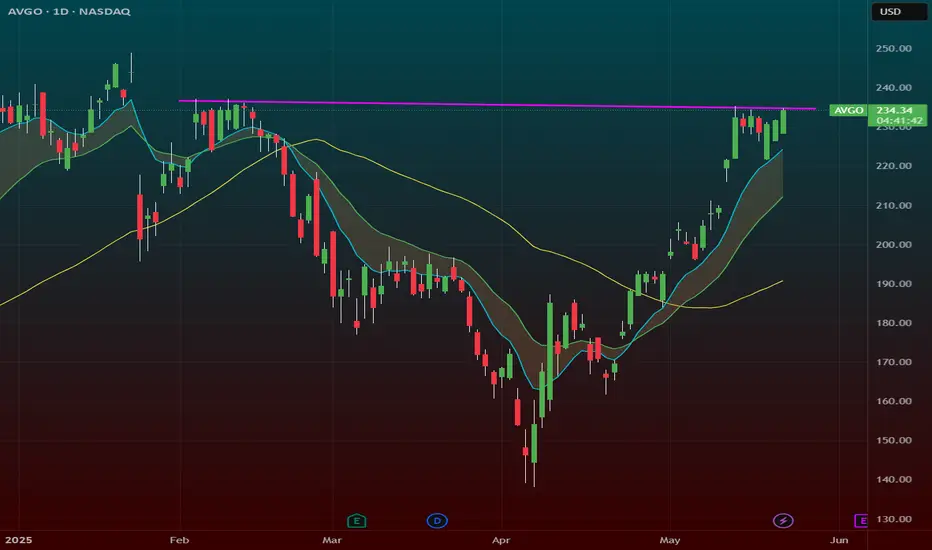
Broadcom (AVGO) Stock Price Rose by Approximately 25% in MayBroadcom (AVGO) Stock Price Rose by Approximately 25% in May
According to available data:
→ AVGO's closing price on 30th April was $192.42
→ The closing price on 30th May was $241.59
The 25% increase in Broadcom (AVGO) stock price made it one of the leaders in the market. For comparison, the S&P 500 index (US SPX 500 mini on FXOpen) rose just over 6%.
Why is the AVGO stock price rising?
Among the bullish factors contributing to the growth of Broadcom (AVGO) stocks in May were:
→ Growing demand for AI infrastructure. This stimulates demand for Broadcom’s products—such as high-performance networking chips, which are critical for building and scaling data centres for AI.
→ Positive news related to the successful integration of the previously acquired company VMware into Broadcom's business.
→ Optimism ahead of Broadcom’s quarterly earnings report, scheduled for 5th June.
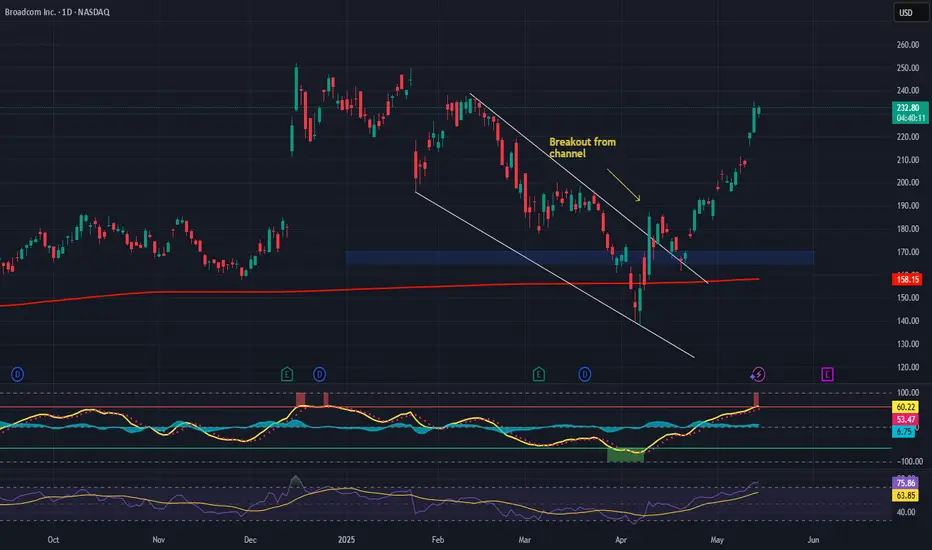
Technical Analysis of AVGO Stock Chart
Price movements in May formed an ascending channel (shown in blue).
From a bearish perspective: AVGO stock has risen to the psychological level of $250, which has acted as resistance since December 2024. Additionally, the strong rally in May may motivate some investors to sell previously purchased shares to lock in potential profits.
From a bullish perspective:
→ The price is in the upper half of the channel, which confirms strong demand.
→ A bullish gap highlighted a buyer-favoured imbalance around the $215 level.
Technically, it would be reasonable to expect a corrective move from the $250 resistance deeper into the ascending channel. However, considering the upcoming earnings report—which often triggers volatility—the bulls could attempt to break through the $250 level and set a new all-time high.
This article represents the opinion of the Companies operating under the FXOpen brand only. It is not to be construed as an offer, solicitation, or recommendation with respect to products and services provided by the Companies operating under the FXOpen brand, nor is it to be considered financial advice.
Broadcom (AVGO) is triggering a powerful breakout todayNASDAQ:AVGO – High Tight Flag + Range Breakout Setup
Broadcom ( NASDAQ:AVGO ) is triggering a powerful breakout today with two bullish patterns stacking up — a high tight flag and a larger range breakout.
🔹 High Tight Flag Breakout
Price action has been coiling tightly just under recent highs — a textbook high tight flag formation.
These setups often lead to strong continuation when they break with volume.
🔹 Range Break in the Works
We're now pushing through the $233–$234 zone, a key resistance level that has capped price recently.
A breakout here opens the door for a major trend continuation.
🔹 My Trading Plan:
1️⃣ Position: I’m playing the $235 calls for next week.
2️⃣ Entry Trigger: Breakout through the $234 level with volume.
3️⃣ Stop Loss: Stop will be based on intraday price action — likely below the 9 EMA or breakout level to manage risk.
🔹 Why This Setup Has Juice:
Strong consolidation near highs is a sign of strength, not weakness.
This is the kind of pattern where institutions start piling in.
Dual setup (flag + range breakout) increases probability of follow-through.
⚠️ Risk Management: Tight stop under breakout zone — manage risk, stay nimble.
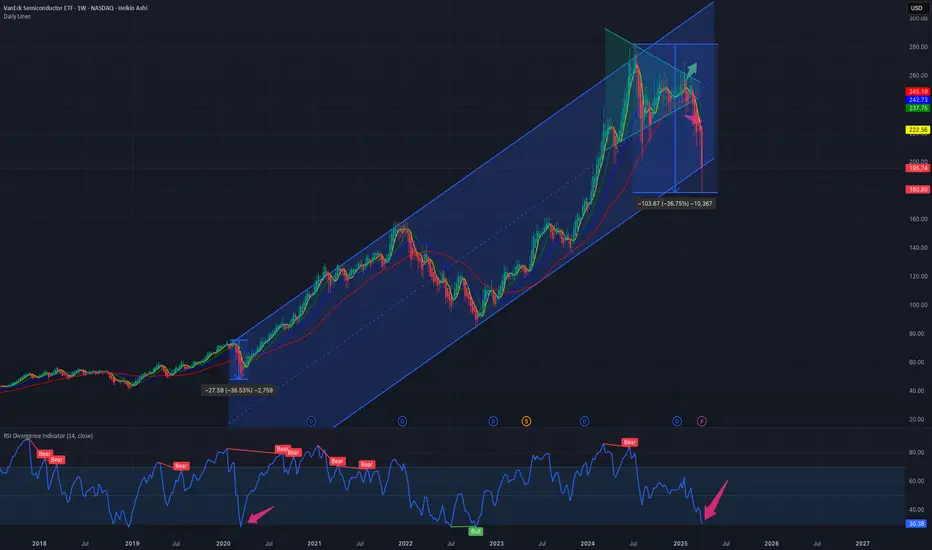
Bullish Semiconductors? SOXX The semiconductors NASDAQ:SOXX definitely tend to lead the market In bull rallies. I still think this saying will hold true for several years.
The NASDAQ:SOXX is flirting with some pretty decent resistance. This would be a perfect spot for sellers to exit and price action to digest recent gains.
If the chart plays out like I think it will, we should have a decent pullback in this area which could create an epic inverse head right shoulder. This pattern would be a very bullish setup that could take us into new All Time Highs in 2026.
This is a weekly pattern so allow the chart some tike to play out.

Broadcom Inc. (AVGO): Software-Driven Growth Meets AI Hardware ECompany Overview:
Broadcom NASDAQ:AVGO is undergoing a strategic transformation—shifting from a hardware-centric model to a hybrid software and subscription platform. The VMware acquisition is proving pivotal, reshaping AVGO’s margin profile and deepening its enterprise moat.
🔑 Growth Catalysts:
💻 VMware Integration = High-Margin Recurring Revenue
70%+ of top 10,000 VMware customers already moved to subscription model
Transition boosts revenue visibility, margin expansion, and valuation multiples
Strong cross-sell opportunities within Broadcom’s enterprise base
⚙️ Custom AI Chips – A Key NVIDIA Hedge
Broadcom’s custom AI accelerators offer an alternative amid export curbs
Strong demand from hyperscalers and cloud players (Amazon, Google, Meta)
Positioned as a strategic silicon supplier in the AI infrastructure stack
📶 Diversification = Resilience
Deep reach across networking, broadband, storage, and wireless
Reduced cyclicality vs. pure-play semiconductor firms
Balanced between enterprise software and hardware demand
🛡️ Geopolitical Edge
Broadcom’s chip solutions provide alternatives in regions impacted by U.S.-China tech tensions
VMware’s software suite ensures relevance in multi-cloud and hybrid IT environments
📊 Financial Highlights:
Consistent double-digit free cash flow growth
EBITDA margin expansion via software scale and cost synergy post-VMware
Shareholder-friendly with strong buybacks and dividend growth
📈 Investment Outlook:
✅ Bullish Above: $165.00–$170.00
🚀 Upside Target: $270.00–$280.00
🎯 Thesis: With AI tailwinds, VMware synergies, and rising recurring revenues, Broadcom is evolving into a software+silicon powerhouse—positioned for outsized returns and resilience in volatile markets.
#Broadcom #AVGO #VMware #AIchips #Semiconductors #EnterpriseSoftware #RecurringRevenue
$SPX Urgent! My <3 & My Soul: Slow Bleed Crash to 3k by Q4 26' Do be warned. Very important post here. I put my heart and soul into this. I made a video earlier and then it got deleted by accident, so I made a less happy one right after. I've got news for all the bulls and investors out there that feel they will be able to continue buying every single dip out there. Get ready for the dip that keeps dipping. Big names already cracking heavy. NASDAQ:META NASDAQ:TSLA NASDAQ:AMD NASDAQ:NVDA to name a few. Big tech is getting cleaned out and layoffs are on the rise. Tariffs create huge amounts of uncertainty. I don't feel like this is rocket science. Buffet is all cash. 89% of Hedge Fund managers believe the US market is the most expensive its ever been and Tutes have been selling at the highest rate ever before. I think it's time the US finally gets a shake down. Bullish conditioning has been running rampant, and I've seen Social Media Accounts discourage charting and only paying attention to price action? Price action involves the entire collective, not just one Timeframe. Anyways, here's an overlay from 01' ... the only one I could find that matches. Says short 560 around May 7th and then take profits around 500 again. Let's make this a nice one. Calls till 560 into May then flip to Puts into June. From then short 530 every time you can. $450 is My first target after we break previous lows. I will update as we go. Have a good one yall.

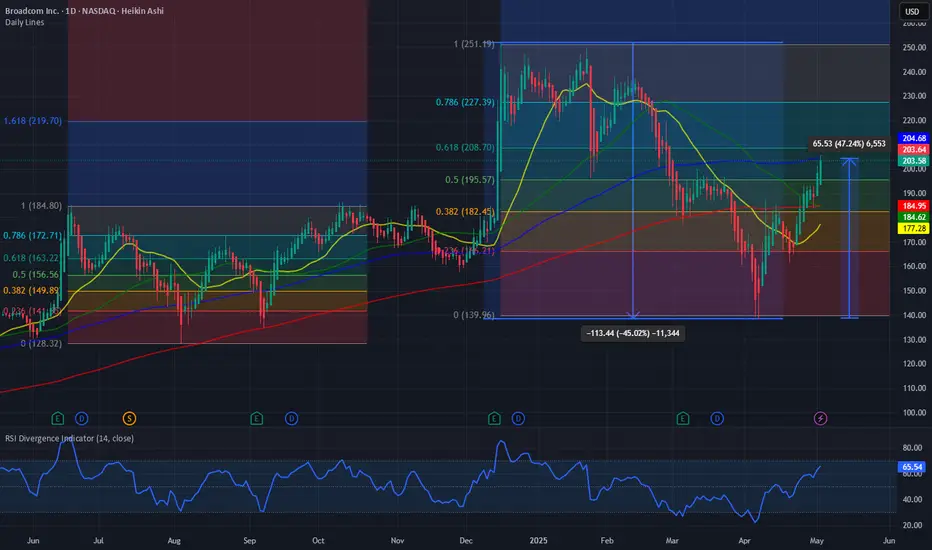
$AVGO looks bullish here. Can go as high as 276 $ NASDAQ:AVGO has seen a faster recovery from the April 8th lows faster that other Semi stocks. The recovery has been stronger than $NVDA. The stock lost 45% of its value during the recent bear market. Since then, the stock has also recovered 45% of its value form the lows of 145 $. The weekly close of NASDAQ:AVGO above the psychological level of 200 $ is very bullish for the stock.
If we plot the fib retracement level NASDAQ:AVGO form the Aug 2024 Yen carry trade sharp sell off, then we can see that the there are major levels which we can reach in the next few weeks. With the management declaring 10 Bn $ of stock buy back there is a floor for the stock price and it provide more upside support for the stock. In this blog we had said on 6th April that the price is good for accumulation, and we should go long on $AVGO. And that was a good trade for those who took it. We should stay long in NASDAQ:AVGO as the stock can go higher before any sell off can set in.
Verdict : Stay long $AVGO. Next stop 219 $ and 250 $.
BROADCOM: Long term Channel Up points to $350 within 2025.AVGO is bullish on its 1D technical outlook (RSI = 64.250, MACD = 3.500, ADX = 29.483) as last week it crossed and close over its 1W MA50 and on the current 1W candle it is about to close over the 0.618 Fibonacci retracement level as well. This is similar to the November-December 2022 fractal that followed after the last major market bottom. Both sequences bottomed on the same 1W RSI level (34.80), so the structures share more similarities than differences. Since the 3 year pattern is a Channel Up, the stock is now on the new bullish wave aiming for the next HH. The 2022 rebound reached the 1.618 Fib extension before consolidating for weeks, so our long term target is the current 1.618 Fib (TP = $350.00).
## If you like our free content follow our profile to get more daily ideas. ##
## Comments and likes are greatly appreciated. ##

AVGO -Break Test GO!This is a classic setup of a break structure, test the bottom, and GO!!!!
These moves are designed to provoke emotion, both to the downside and to the upside. They go up to give false hope and then rip it lower to deliver a perfect knockout combo.
Such setups are all over the charts in big names such as AAPL
Its better to be out of the market wishing you were in than in the market wishing you were out.
Take your profits and GTFO!
BROADCOM's 15 year chart is why you will regret not buying now.Broadcom Inc. (AVGO) has been on a strong correction in the past 4 months, completing so far 3 straight brutally red 1M (monthly) candles since January, having broken below its 1W MA50 (blue trend-line).
This month, it hit its 1W MA100 (green trend-line) for the first time since November 2022. This is a key Support level as it is AVGO's main Support during Bull Cycles that historically has only broken during Bear Cycles.
In fact, the stock has been trading within a 15-year Channel Up since it's IPO. And this is the reason why this correction is a blessing in disguise for long-term investors. The 1W MA100 was intact during the previous historic Bull Cycle from May 2013 to July 2018. So since we tested it now, there is a far stronger probability of it holding and extending the Bull Cycle that started on the October 2022 Low, than turning into a Bear Cycle.
Notice also how symmetric the rises have been within this Channel Up. The 2012 - 2015 rise has been +500% before the 1W MA50 was breached again. Similarly, AVGO has grown by +500% again from the October 2022 bottom to the recent All Time High, before it broke last month again below the 1W MA50.
If this is a new Low similar to August 2015, then we can expect an equally symmetric follow up rise of +178.64% in the next 2 years. This gives us a rough long-term Target of $380.
-------------------------------------------------------------------------------
** Please LIKE 👍, FOLLOW ✅, SHARE 🙌 and COMMENT ✍ if you enjoy this idea! Also share your ideas and charts in the comments section below! This is best way to keep it relevant, support us, keep the content here free and allow the idea to reach as many people as possible. **
-------------------------------------------------------------------------------
💸💸💸💸💸💸
👇 👇 👇 👇 👇 👇

Bear Flags: $NVDA first, then $AVGO In this AI Mega cycle there were 2 clear visible winners. NASDAQ:NVDA and $AVGO. Broadcom ( NASDAQ:AVGO ) has had a late bull run in the AI super cycle which started in 2022 and was ongoing until Dec 2024. During this tariff-based bear run NASDAQ:NVDA is almost down 40%. The same is true for Broadcom. NASDAQ:AVGO is also down 40% from the ATH.
But we must investigate the confluence of some more technical indicators on top of the simple % drawdown we see in stocks. The 2 most helpful indicators are the RSI and Fib retracement levels, which can give us some more price levels which we might be looking forward to in the upcoming weeks. The RSI is at 36 on the weekly chart for both the stocks NASDAQ:AVGO and $NVDA. But let’s focus on NASDAQ:AVGO in this blog. Today we are combining the Gan and Fib retracements levels on the weekly chart of NASDAQ:AVGO and we see the clear price levels. We are already at 0.618 Fib retracement which is the price level 145. We closed @ 146 $ on Friday. If we break tis support level, then the next level we are looking at is 121 $ which will be 0.5 Fib retracement levels. If that level is broken, then we are looking at a 100 $ Stock price on $ AVGO 0.382 Fib retracement level.
Verdict: Buy 33% now, buy 33% between 120 $ - 130 $ , buy the rest 33% between 95 $ - 100 $

$SMH: First the generals then the index NASDAQ:SMH with closing @ 180 $ on 04 April 2025 is equivalent to drawdown we saw during COVID crash. During the covid crash the semiconductor ETF lost 37% and this tariff crash we also saw 36% drawdown. If this tariff war on goes then we might see some more weakness. With this drawdown the NASDAQ:SMH is below its 200 Day SMA. ‘Nothing good happens below 200 Day SMA’ and the ETF is below the upward sloping channel. The RSI is also touching the lows the lows we saw during the COVID time reaching the oversold mark of 30.
This weakness can be attributed to heavy weights like NASDAQ:NVDA and NASDAQ:AVGO which have been down more than 40% form their ATH. But the question remains will the drawdown stop here or there is some more pain. But we should not forget the 3-day rule in the markets. Where the sell off peaks off in the 3rd Day. 07 April will be the 3rd Day after the tariff selloff.
Should we call the bottom here? Unless we think that there will be a recession then these are good levels to buy. But if the tariff negotiations go on for longer period, then there will be chop around for a longer period and instead of a V shaped recovery we might see a U-shaped recovery in SMH.
Verdict: Accumulate some NASDAQ:SMH here and go extra-long @ 170-180 $
$SOXL $SOXX BOTTOMED (ASCENDING TRIANGLE)An ascending triangle is a bullish breakout pattern that occurs when the price breaks through the upper horizontal trendline with increasing volume. The upper trendline is horizontal, showing nearly identical highs that create a resistance level. Meanwhile, the lower trendline slopes upward, indicating higher lows as buyers gradually increase their bids. Eventually, buyers become impatient and push the price above the resistance level, triggering further buying and resuming the uptrend. The upper trendline, which previously acted as resistance, then becomes a support level.
Semiconductors NASDAQ:SOXX are crucial to the United States for several reasons:
Technological Backbone: Semiconductors power essential technologies like smartphones, computers, cars, and medical devices. They are integral to almost everything with an on/off switch. The semiconductor industry aka NASDAQ:SOXX significantly contributes to the U.S. economy. It supports millions of jobs and drives innovation in various sectors, including artificial intelligence, biotechnology, and clean energy.
Semiconductors are vital for national security. They are used in military systems, aircraft, weapons, and the electric grid, making them critical for defense and infrastructure. Maintaining a strong semiconductor industry helps the U.S. stay competitive globally so BUY AMEX:SOXL , $SOXX. The CHIPS and Science Act, for example, aims to revitalize the U.S. semiconductor industry, create jobs, and support American innovation. Strengthening the domestic semiconductor supply chain reduces dependency on foreign sources, enhancing the resilience and security of supply chains.
BUY NOW AND HOLD
