OH NO! $SOXS is primed for a significant rise.The concept of a multiple bottom suggests that the stock has already experienced a significant decline, creating a buying opportunity at a lower price over time.
Plus, Trump is coming= BYE semidocutor stocks!
Stricter trade policies and tariffs on imported semiconductors could disrupt global supply chains, leading to higher costs and potential shortages.
During his previous presidency, Trump focused on "America First" policies, which included promoting domestic manufacturing and reducing reliance on foreign supply chains
Additionally, there were concerns about the potential mismanagement of federal initiatives like the CHIPS and Science Act, which aimed to boost domestic semiconductor manufacturing.
AMEX:SOXL , NASDAQ:NVDA , NASDAQ:AMD , NASDAQ:AVGO , NASDAQ:QCOM : Sell now to take the profit.
IT'S COMING
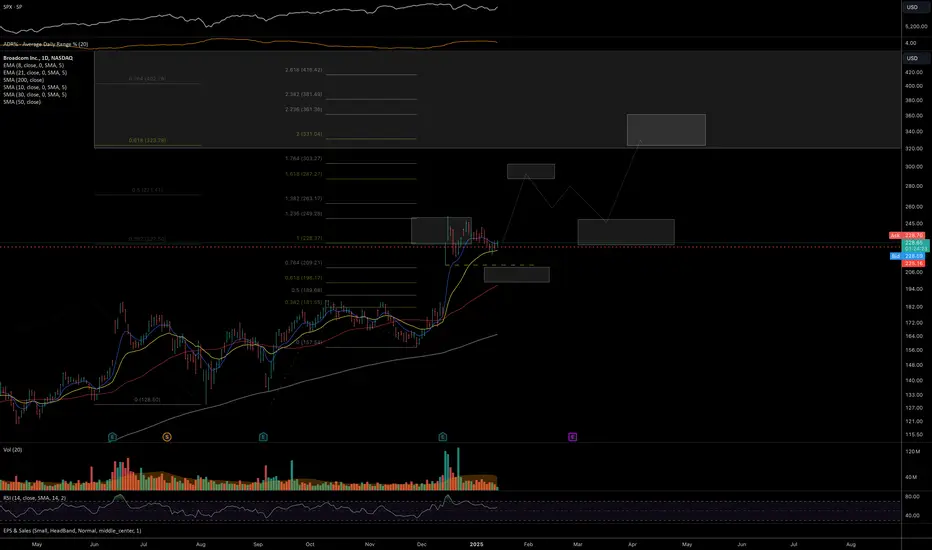
AVGO

BROADCOM Megaphone bottom hit. Will it hold?Broadcom Inc. (AVGO) has been trading within a Bullish Megaphone pattern since the January 05 2024 Low and this week it hit its bottom (Higher Lows trend-line). This technically concludes the Bearish Leg and should start the new Bullish Leg.
The last Bullish Leg's initial rebound hit the 0.786 Fibonacci retracement level before pulling back again. If the market starts the new one here, which is not as easy as last time as we've already broken below the 1D MA200 (orange trend-line) last week, the immediate Target is 228.50.
-------------------------------------------------------------------------------
** Please LIKE 👍, FOLLOW ✅, SHARE 🙌 and COMMENT ✍ if you enjoy this idea! Also share your ideas and charts in the comments section below! This is best way to keep it relevant, support us, keep the content here free and allow the idea to reach as many people as possible. **
-------------------------------------------------------------------------------
💸💸💸💸💸💸
👇 👇 👇 👇 👇 👇

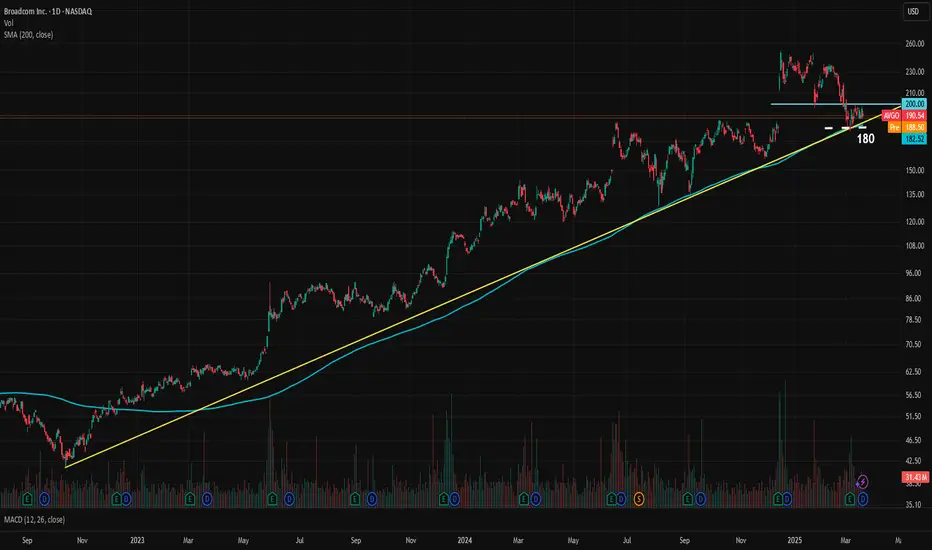
AVGO Stuck Between Key Levels, A Calm Before the Storm?Broadcom, one of the key favorites in the AI rally, is at a crossroads. AVGO has been in a steady logarithmic uptrend since October 2022, carrying the stock price from 41.51 to 251.88, marking an impressive 506% gain in about two and a half years. The company's EPS has been consistently increasing over the years and is expected to accelerate further this year. Although valuations are high, if Broadcom's performance in 2025 meets or exceeds expectations, the bullish case remains strong. The forward P/E for 2025 end is 28.7x.
Currently, the price is stuck between the trendline and the 200 resistance level. The uptrend is supported by the 200-day moving average. The trendline sits around 184, while the SMA is at 182.50. For a more cautious approach, 180 can be considered the key medium-term support level. If 180 holds and AVGO manages to break above the 200 resistance, there is significant upside potential for the bulls.
The current analyst consensus for the 12-month price target is 251, which also coincides with the stock's all-time high (ATH).
$AVGO Tradespoon - Long Entry $191.36Tradespoon model generated long signal for Broadcom Inc. ( NASDAQ:AVGO ). Predicted range: $191.36–$199.68. Trend: +0.86%. NASDAQ:AVGO

AVGO - It's time to Turnaround and GO!NASDAQ:AVGO
Monster Earnings and Move have been shrugged off...
- Ascending Triangle Successful Retest
- 50 WMA Successful Retest
- Volume Shelf
- Key S/R Zone
- Green Support Beam on Wr%
If market gets going then Broadcom is heading to $270 QUICK!
Not financial advice

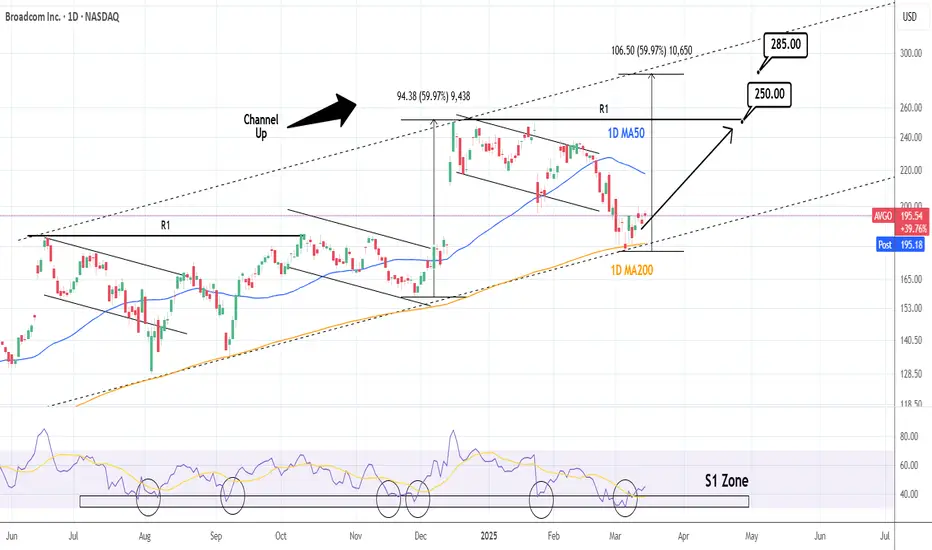
BROADCOM: Is this a legit recovery on the 1D MA200?AVGO is almost neutral on its 1D technical outlook (RSI = 44.867, MACD = -8.280, ADX = 49.944) as it has stabilized following a direct contact with the 1D MA200. That was the first time the price hit that level since the September 9th 2024 low. This is also a technical HL at the bottom of the 9 month Channel Up, while also the 1D RSI is rebounding on its S1 Zone. The Sep 9th 2024 rebound hit its upper R1 level, so our worst case target is 250 (TP1), while the November 27th 2024 low rose by +59.97%, which gives a best case target of 285 (TP2).
## If you like our free content follow our profile to get more daily ideas. ##
## Comments and likes are greatly appreciated. ##
Broadcom Inc. (AVGO) Stock Surges Over 8%Broadcom Inc. (AVGO) Stock Surges Over 8%
As shown on the chart, Broadcom Inc. (AVGO) shares soared by more than 8% in Friday’s trading session.
The bullish momentum is driven by strong quarterly results released last week and an optimistic outlook highlighting sustained demand in the artificial intelligence sector:
→ Earnings per share: $1.60 (Analyst forecast: $1.49)
→ Revenue: $14.92 billion (Expected: $14.61 billion), reflecting a 25% increase from $11.96 billion a year earlier.
Technical Analysis of AVGO Stock
The chart indicates that the market remains in an uptrend, with signs that the price has found support at:
→ The lower boundary of the channel.
→ The former resistance zone around $183 – which also aligns with the lower boundary of the price gap that formed in December 2024, as we previously noted.
This suggests that after forming a Bullish Flag pattern (marked in red), the upward trend may continue.
Broadcom (AVGO) Stock Price Forecast
Bank of America analyst Vivek Arya called the results from Broadcom a “reassuring update from an AI leader” and a “positive read-across for AI sentiment.”
According to TipRanks:
→ The average price target for AVGO shares is $248.
→ 27 out of 30 analysts recommend buying AVGO stock.
Trade on TradingView with FXOpen. Consider opening an account and access over 700 markets with tight spreads from 0.0 pips and low commissions from $1.50 per lot.
This article represents the opinion of the Companies operating under the FXOpen brand only. It is not to be construed as an offer, solicitation, or recommendation with respect to products and services provided by the Companies operating under the FXOpen brand, nor is it to be considered financial advice.
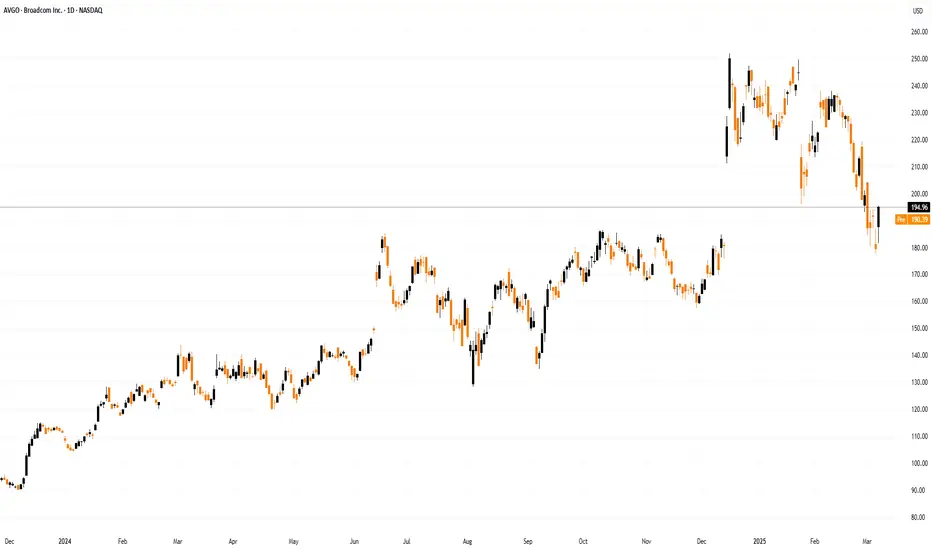
$AVGO almost down 30% Since the AI trade took hold of the S&P and NASDAQ the 2 stocks which we poster child in the AI trade were NASDAQ:NVDA and $AVGO. Out of the 100% of the real AI revenue done by Semis almost 15-20% is attributed to Broadcom $AVGO.
After the last quarter results the stock gapped up more than 20% and reached an ATH of 250 $ from the lows of 170 $. This week the stock almost touched 170 $. The Gap got filled as they usually do. So as usual in the technical patterns world the previous tops become support. The 200 Day SMA is at 178 $. I think between 170 $ and 180 $ is the accumulation zone for $AVGO. Tomorrow, being the earnings date of NASDAQ:AVGO we should watch out for volatility after the earnings. An implied move of +/- 10% in the price of NASDAQ:AVGO can happen after the earnings.
All in all, buy NASDAQ:AVGO between 170 $ - 180 $.

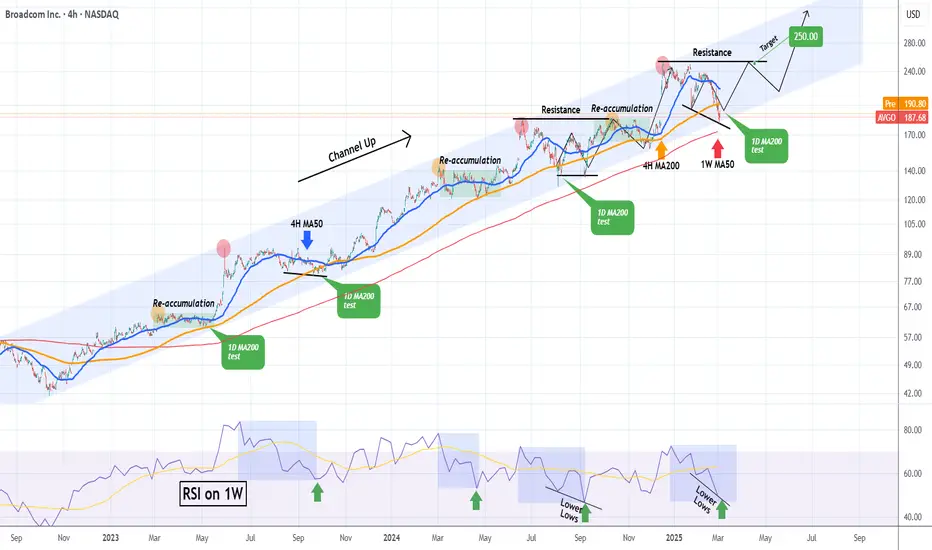
BROADCOM Is this the buy opportunity of the year?Broadcom Inc. (AVGO) has been trading within a multi-year Channel Up since the October 2022 market bottom and broke last week below its 4H MA200 (orange trend-line). In the past +2 years, every time the 4H MA200 broke, the stock was on its most optimal buy opportunity, as long as the 1W MA50 (red trend-line) held.
In fact, it has been holding since the December 09 2022 break-out so as long as it doesn't break now, AVGO is a low risk - high reward buy opportunity. Actually both in 1W RSI terms as pure price action, the current Low resembles the September 06 2024 one, which started the most recent Bullish Leg.
That sequence initially hit its previous Resistance (previous Higher High) before entering a Re-accumulation phase halfway before the Channel Up top. As a result, we expect to see AVGO hitting at least $250 before the next pull-back that quite possible may target $330.
-------------------------------------------------------------------------------
** Please LIKE 👍, FOLLOW ✅, SHARE 🙌 and COMMENT ✍ if you enjoy this idea! Also share your ideas and charts in the comments section below! This is best way to keep it relevant, support us, keep the content here free and allow the idea to reach as many people as possible. **
-------------------------------------------------------------------------------
💸💸💸💸💸💸
👇 👇 👇 👇 👇 👇
$SMH is in undecided watersMany Wall Street analyst will say there are no bull markets without the Semis. We have been going sideways for a few months. We are in a range within a major upward trend in the markets and the NASDAQ:SMH ETF. The same looks in the charts of NASDAQ:NVDA , NASDAQ:AVGO etc.
In this chart we plotted an upward trending parallel channel. The NASDAQ:SMH price have been within the parallel channel sweeping the upper and lower bound in this multiyear bull market. This is also evident here. But since hitting an ATH in July 2024. It has been sideways since then. It is forming a consolidating wedge pattern which can break either way. But usually, such consolidation pattern breaks in the direction of the underlying market trend.
Long NASDAQ:SMH now and here when in consolidation pattern.

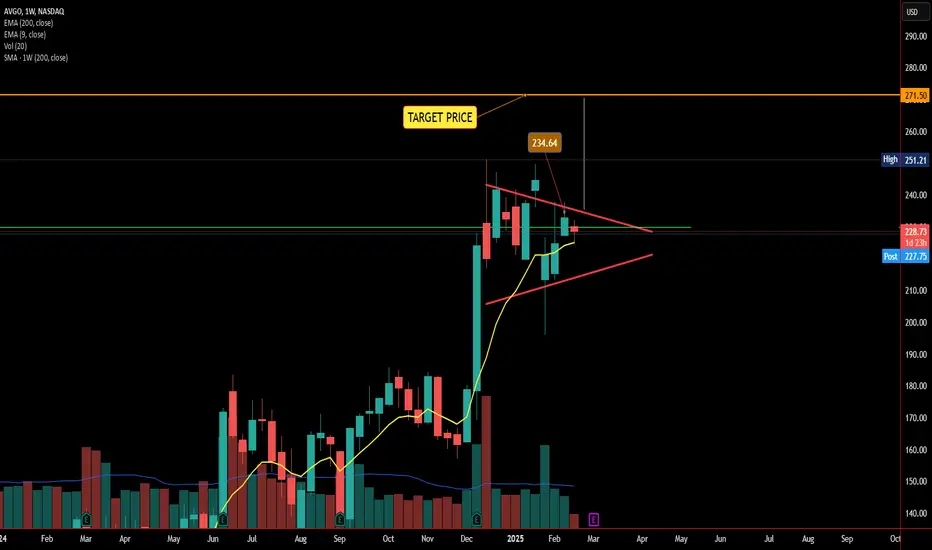
Bullish Pennant Forming on AVGO? Target: $271.50📊 Chart Breakdown:
AVGO is showing signs of a bullish pennant formation after a strong impulsive move up, followed by a period of consolidation.
🔹 Lower Highs & Trendline Resistance – The stock has been making lower highs, forming a downward sloping resistance.
🔹 Support at 9 EMA (Yellow Line) – The price has bounced off the 9 EMA, which suggests buyers are stepping in.
🔹 Volume Decline During Consolidation – A classic bullish pennant trait, showing a buildup before a potential breakout.
🔹 Breakout Confirmation Needed – A close above the descending trendline would confirm the breakout and push toward our target price of $271.50.
📈 Bullish Case:
If AVGO breaks out above resistance, we could see a strong continuation toward $271.50 in the coming weeks.
⚠️ Key Levels to Watch:
✅ Breakout Above: $232-$235
❌ Support to Hold: 9 EMA (yellow) & $220
💡 Final Thoughts:
With the current price action and EMA support, this setup favors the bullish case, but confirmation is key! Watch for a high-volume breakout for the best entry.
What do you think? Are you bullish on AVGO? Let’s discuss! 🔥📊
$ANET : A steady compounder under the shadows of $AVGOToday we dive into the world of stocks where we look at a little know cos. called Arista Networks $ANET. NYSE:ANET since its IPO almost 10 years ago has given a 2000% return to its investors. The next generation Networking cos with virtualized network platform on specialized designed chips and advanced Ethernet switches with low latency used in Cloud Data centers .
NYSE:ANET weekly chart looks amazing with higher high and higher lows. Recently most cloud networking stocks like NASDAQ:ALAB and NASDAQ:AVGO have been consolidating. NYSE:ANET is @ 100 Day SMA which is currently at $ 106. NYSE:ANET consolidation around 100 Day SMA is always a great buying opportunity.
Long NYSE:ANET @ 100-Day SMA.

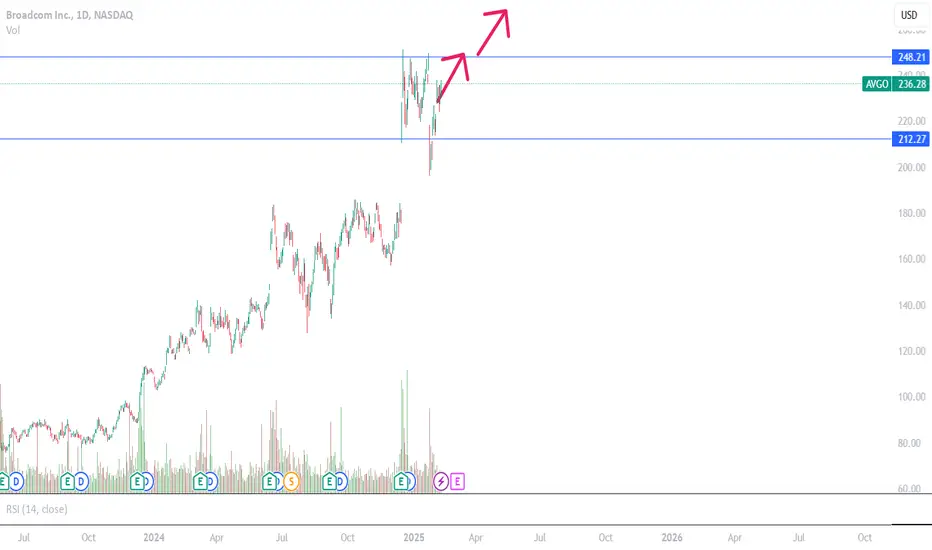
Broadcom - This Chart Is Just Splendid!Broadcom ( NASDAQ:AVGO ) is starting the rejection:
Click chart above to see the detailed analysis👆🏻
For the past decade, Broadcom has been trading in an obvious rising channel formation, perfectly rejecting the upper resistance as well as the lower support trendline. With the recent weakness, Broadcom is now preparing for a clean rejection away from the major reversal area.
Levels to watch: $250, $150
Keep your long term vision,
Philip (BasicTrading)

Semiconductors Finishing Consolidation for Next Move UpSemi's are ready to move after a long consolidation. This is a big signal for Nvidia that is likely to lead and significantly outperform.
Good luck!

BROADCOM: Buy the next dip under the 1D MA50 and target $285.AVGO is neutral on its 1D technical outlook (RSI = 52.924, MACD = 2.910, ADX = 23.178) despite a recent end of January rebound on its 1D MA50. Technically the bearish wave of the Channel Up isn't completed, it should do so once the 1D RSI touches the S1 Zone again. Once it does, aim for a little under a +60% price increase (TP = 285.00).
## If you like our free content follow our profile to get more daily ideas. ##
## Comments and likes are greatly appreciated. ##

AMD: A Once-in-a-Lifetime Opportunity!**🔥 AMD: A Once-in-a-Lifetime Opportunity!**
In pre-market, AMD briefly touched **$125** following earnings. You all know how this works—sooner or later, the algos will bring it back to that level. No hesitation, I’m **quadrupling my bet—going in MASSIVELY!** 🚀💰

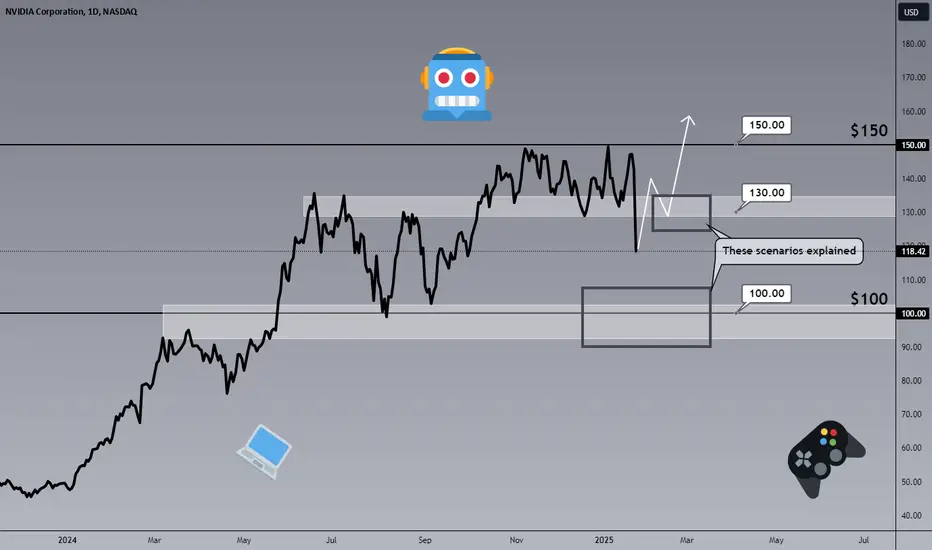
NVIDIA's Technical Outlook After the Market CrashYesterday, the market experienced a sell-off that pushed most stocks into the red. One of the key stocks in the spotlight was NVIDIA (NVDA).
From a technical perspective, NVDA had been drifting between the $130 and $150 range for the past three months without establishing a clear direction. During this time, the stock made several attempts to break above the $150 level, but all efforts failed – investors simply weren’t ready to pay such a high price.
Yesterday, the stock finally found a direction: not above $150, but instead below $130. Slightly lower price levels have now taken over.
Current Technical Outlook
At the moment, the stock is once again trapped between two levels – $130 as resistance and $100 as support. Currently, the price sits in what I’d describe as "no-man’s land," and for me, the optimal buy zone would be in the range of $90–$107.5. If the price doesn’t reach this area (pre-market is already up 5%) and instead rebounds back above $130, we can react there, in what I’d consider a safer zone. For now, it’s best to let things settle.
Opening positions at this stage might be risky; ultimately, it’s about balancing risks with your strategy. Personally, I always aim for the best possible prices or the safest scenario. For me, the lower zone between $90 and $107.5 offers the best potential value.
Second Scenario
Another approach is to wait for the price to break back above the current resistance level of $130 and secure a strong weekly close above it. This would signal that the price has moved into a potentially safer zone, suggesting that market panic may have ended well for NVDA holders. This scenario also allows us to take advantage of further potential growth.
Sector Stocks of Interest
Here are a few stocks from this sector that caught my attention and might also be of interest to you:
Broadcom (AVGO)
ASML Holding (ASML)
Marvell Technology (MRVL)
Strongest levels below the current price.
All the best,
Vaido
AVGO Bullish and bearish at the same timeAVGO had an amazing Gap up opening due to fantabulous earnings and guidance related to AI .
Looking at historic trend AVGO always fill the gap up openings by bearish moment
At this point in time AVGO is in bear trend and looking to fill the gap but we can give AVGO benefit of doubt and it seems like 212 is a very strong support as well
Entry advice
Buy at 212 or 212 when it bounces off that support
Second entry can be at 185 as that is a very strong support and will bounce off from that support level
Stop loss 155

$AVGO - Another Blow Off Top is Loading!NASDAQ:AVGO
Parabolic move followed by a resting period!
What comes next? HIGHER! 👆
They will follow these MASSIVE AI/ Semi earnings names higher IMO
🎯247🎯252🎯270
Not financial advice
$NVDA Buy now when everyone is in fear! Easy Rally to $165 !!Based on recent analyses and expert forecasts, NVIDIA's stock price (NVDA) is anticipated to perform robustly in the first quarter of 2025. Analysts have set a target price around $170 if the stock can convincingly surpass the $145 mark.
Reason to BUY NASDAQ:NVDA
Strong Demand for AI: NVIDIA's GPUs play a critical role in training complex AI models. The rising demand for AI technologies, particularly from major tech companies, is boosting the need for NVIDIA's specialized chips.
Data Center Growth: NVIDIA's data center revenue has been experiencing significant growth. This segment now accounts for a substantial portion of their total revenue, and ongoing investments in data centers by cloud service providers are expected to further drive demand.
New Product Launches: NVIDIA is preparing to increase shipments of its new H200 GPU, which boasts greater efficiency and power compared to its predecessor. This could attract more customers and boost sales.
Positive Market Sentiment: Analysts maintain a bullish outlook on NVIDIA's stock, with some predicting further price increases due to sustained demand and strong financial performance.
AI Monetization: Companies such as Microsoft and Meta are seeing increased monetization from AI applications, potentially leading to higher spending on NVIDIA's products.
BUY NOW NASDAQ:NVDA !!
Fear & Greed Index: 39 (FEAR)
Green Days: 13/30 (43%)
RSI as of 01/13/2025
200-Day SMA: $119.35
50-day SMA: $139.86
Volatility: 3.12%
I also anticipate a dramatic increase due to the following events:
CPI 01/15/2025
Trump Administration 01/20/2025
FOMC Meeting: 01/29/2025
Broadcom - This Chart Tells Us Everything!Broadcom ( NASDAQ:AVGO ) is retesting massive resistance:
Click chart above to see the detailed analysis👆🏻
For roughly a decade, Broadcom has been trading in a quite obvious rising channel pattern, perfectly rejecting the lower support trendline back in the end of 2022. After the recent rally of more than +200%, it is quite likely that we will now see a substantial move lower from here.
Levels to watch: $250, $150
Keep your long term vision,
Philip (BasicTrading)

AVGO: mid-term trend structure If price is to hold above 209-198 area of support, next resistance zones are: 287-303 and 320-330-360.
Macro trend structure also assumes higher targets for the uptrend since 2022 bottom (Monthly):
Thank you for your attention!