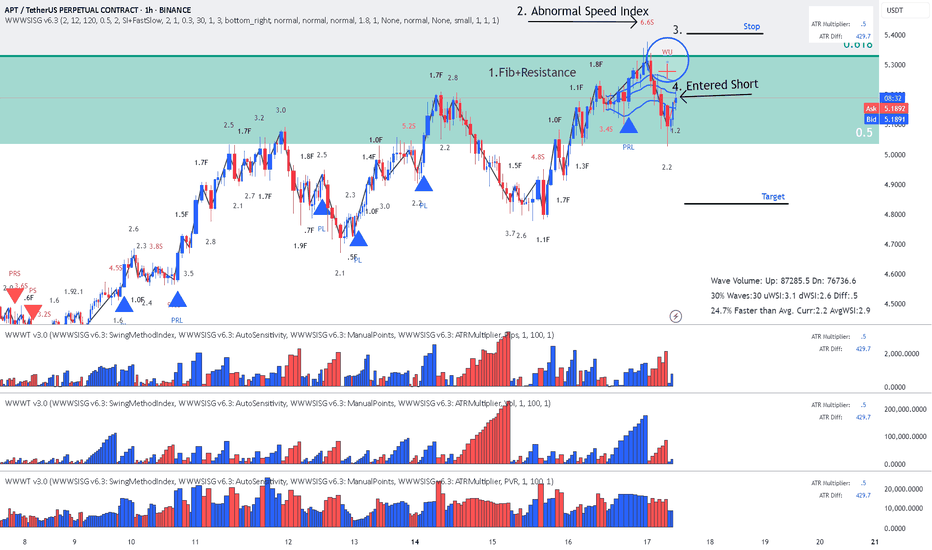
Avwap
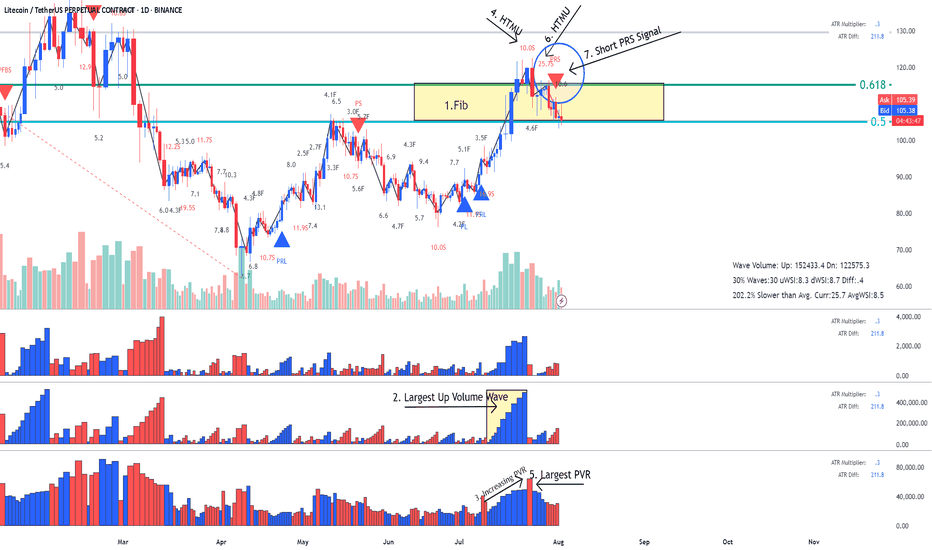
LTC- LitCoin - This is how a Fake Break on Fib looks like This is how a Fake Break on Fib looks like using Weis Wave with Speed Index
Reading the Daily Cha rt
1. Fib Location - Sellers could enter here
2. Largest Up volume wave after a while - also sellers could be hidden in there.
3. Increasing PVR (progressing volume rate) = as we approve the top more volume comes in (sellers)
4. This up wave has the highest Speed Index 10.0S of all the up waves in the trend, that's a HTMU (hard to move up = sellers)
5. The highest PVR bar =sellers
6. Another Abnormal Speed Index 25.5 S - that's another HTMU = more sellers on the up move, price cannot progress upward anymore.
7. and finally down we go with a PRS signal.
All the ingredients for the Short were there. Reading Weis Wave with Speed Index is like reading a book, page after page, until you reach to the last page that the writer has kept the surprise, the only difference is that this is never ending chart book with many stories. This was the story of LTC for now. I think this story has not ended yet and continue to drop to another Fib, the details on the 1HR!.
I hope you enjoy this chart reading lesson using Weis Wave with Speed Index.
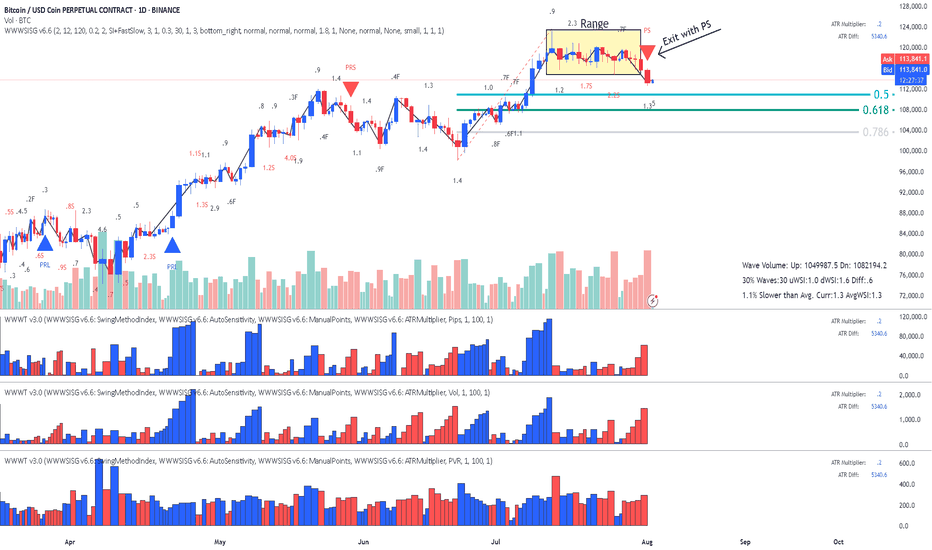
BitCoin - Is it heading for the Fib?This is a classic Entry Short for Weis Wave with Speed Index owners called " Exit from Range with a Plutus Signal" and in this case it was a PS. It looks that it's heading for the Fib, I will wait for some pullback on 1HR to confirm with Speed Index and the waves, as well as getting a better RR.
I
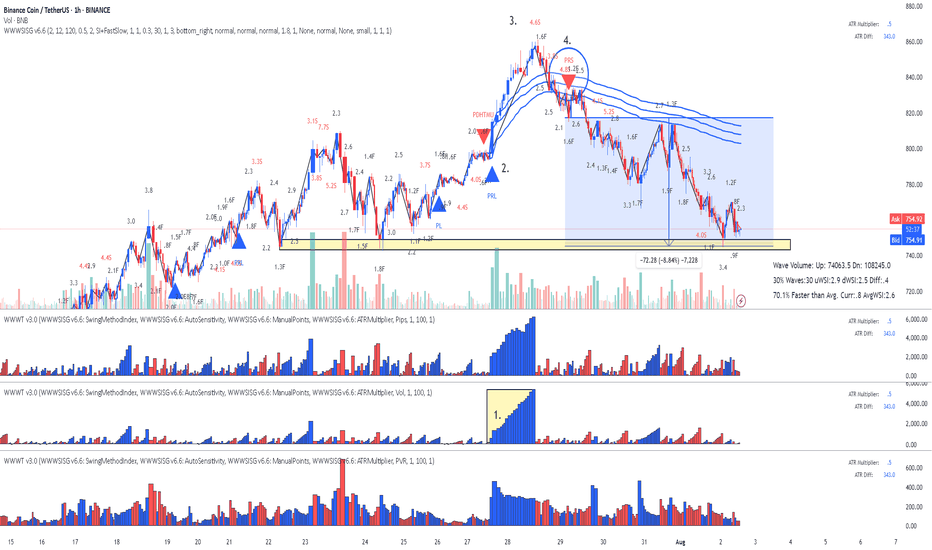
BNB Binance Coin: Lesson 15 methodology did the job again
Lesson 15 methodology (annotations in sync with the chart):
1. Largest up volume wave after a while - sellers might be in there.
2. Placed AVWAP and waited for price to cross downwards and pullback again on AVWAP
3. HTMU (hard to move up) - Abnormal Speed Index 4.6S at the top
4. Entry short signal PRS with abnormal SI 4.8.2 (price has a hard time to move up - absorption)
Simple as that. Enjoy!
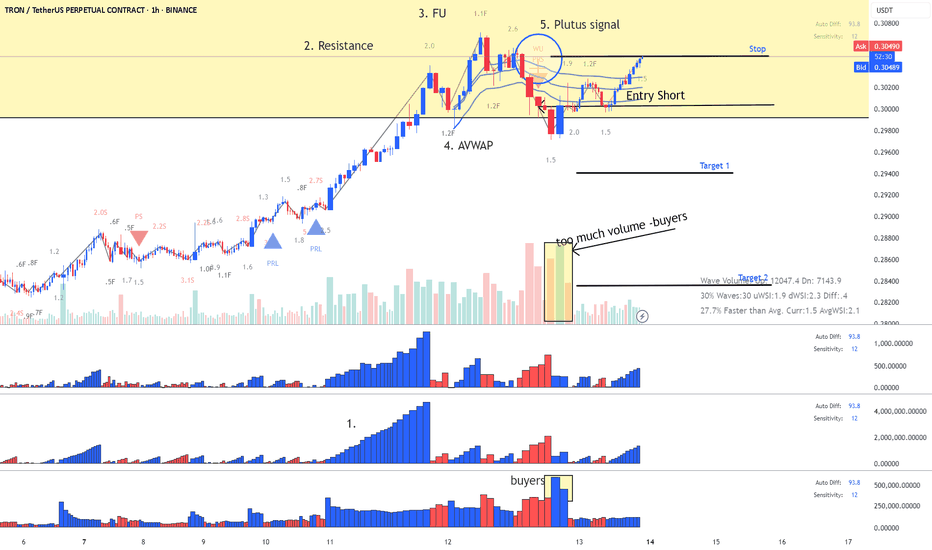
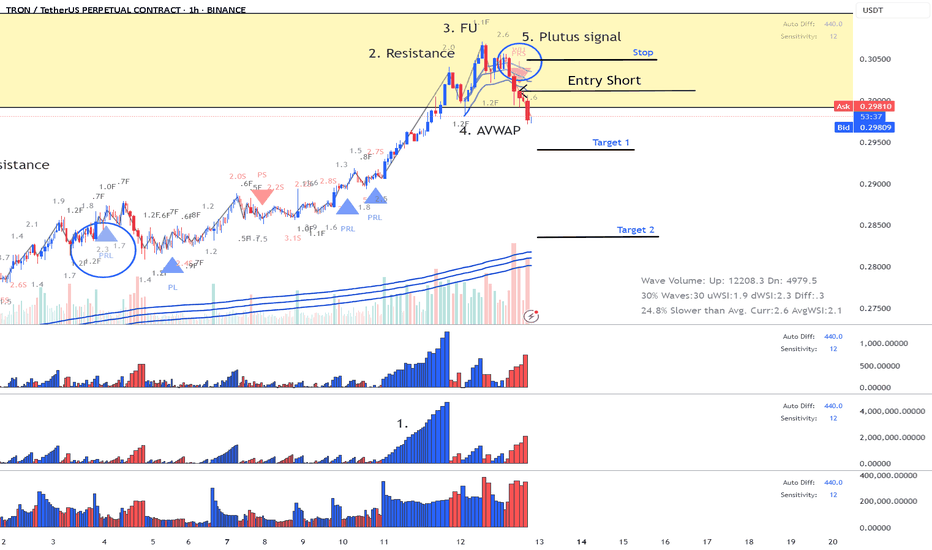
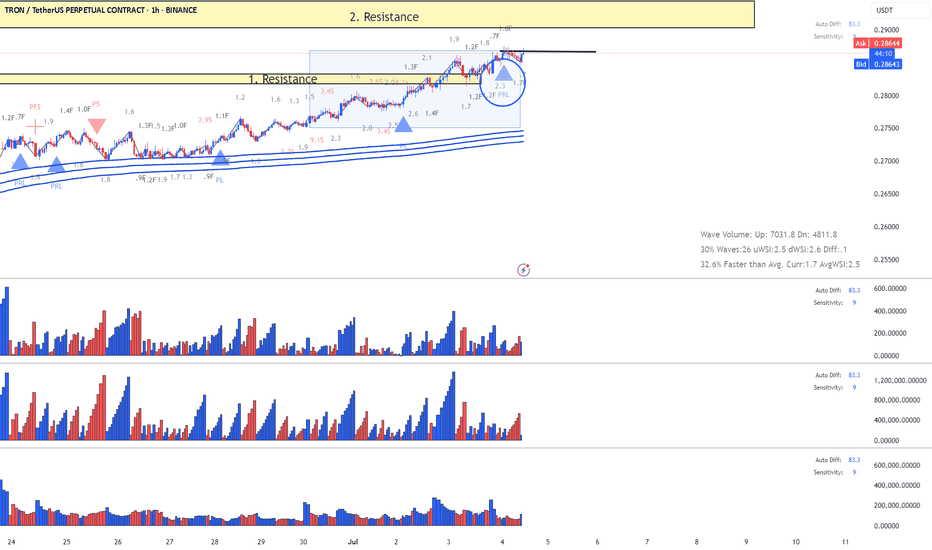
TRX - Double signal short Wyckoff Up-Trust + PRS Reading the chart (annotations in sync with chat):
1. Largest Up volume wave
3. Resistance Level coming from Daily chart
3. Fast Up Wave (could be fake)
4. Placed AVWAP on fast wave and
5. Our Entry: Double Plutus signal after the retracement Wyckoff Up- Trhust + PRL
Enjoy reading the waves , speed index and Plutus signals.
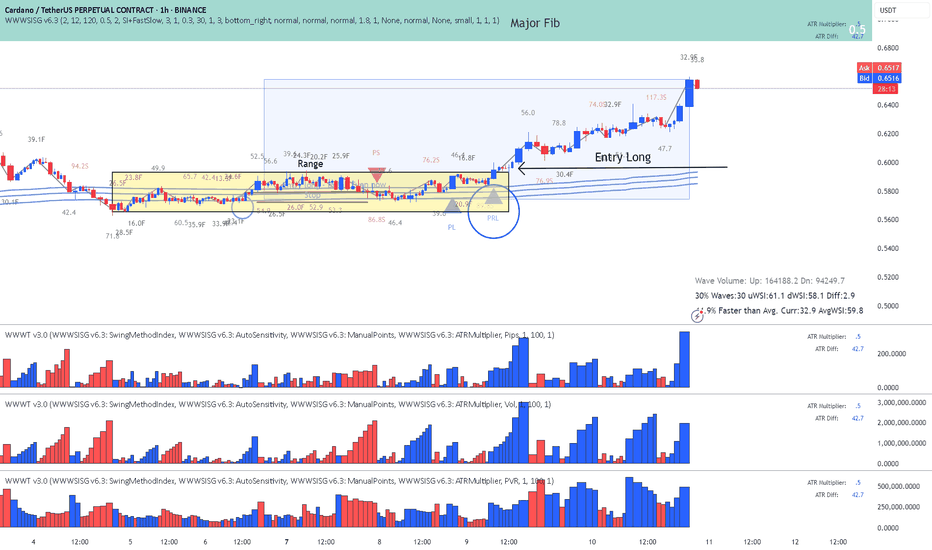
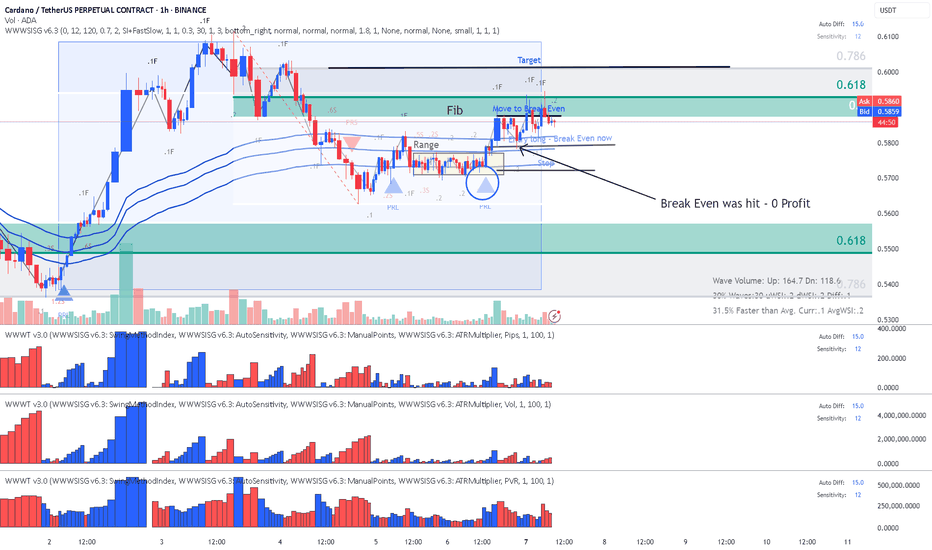
ADA- Cardano - Classic Exit from Range with Plutus signalReading the chart :
AVWAP acted as resistance and we started ranging.
This is a classic entry long for the "SI traders" called Exit from Range with a Plutus signal and in this case it was the PRL signal.
ADA is heading for a major Fib I will not advise any entries now.
Enjoy wave and speed index reading!
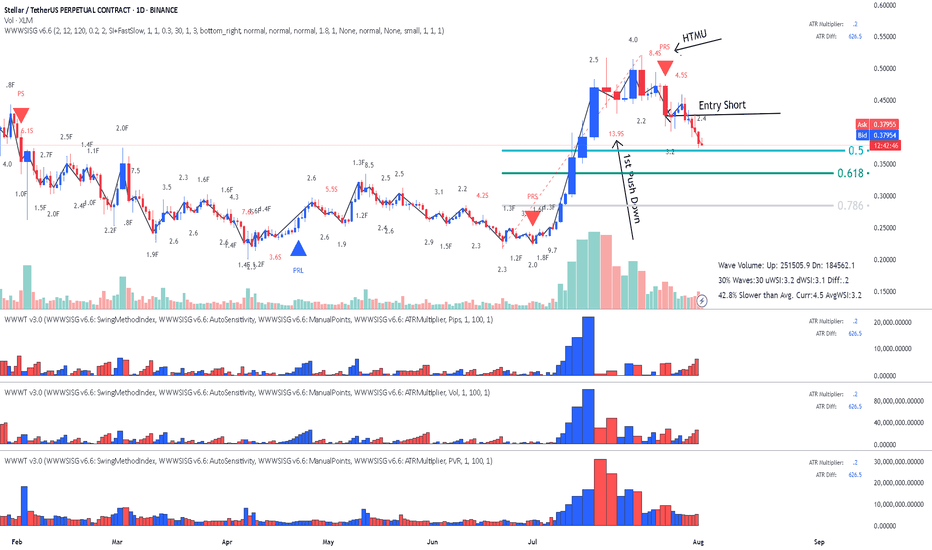
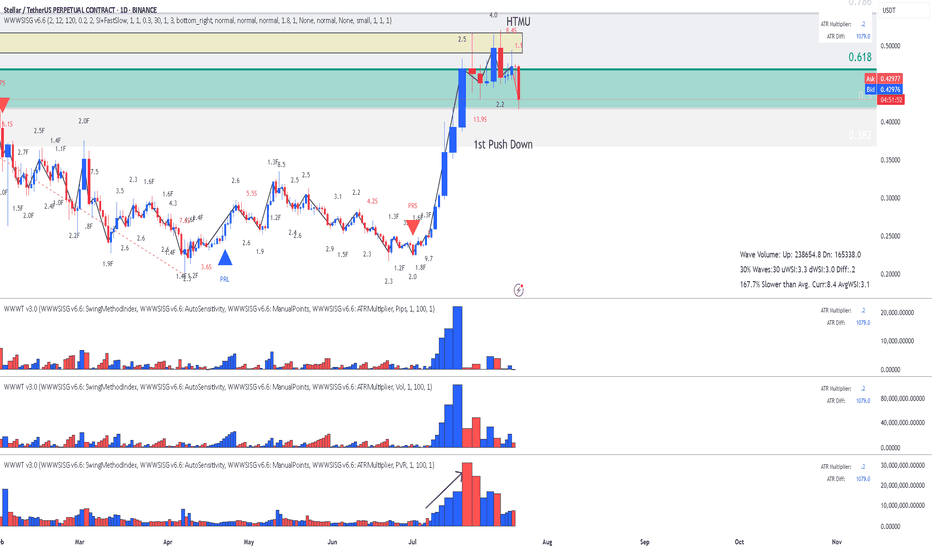
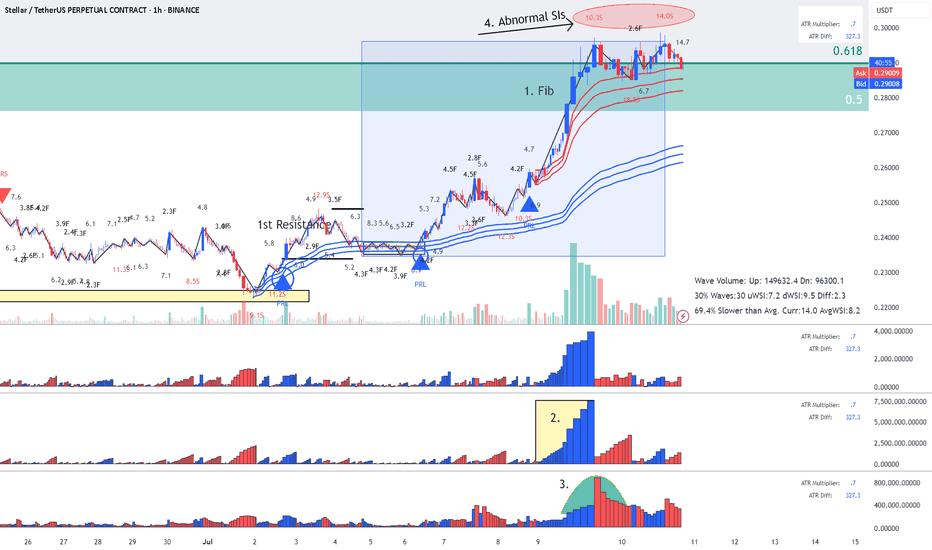
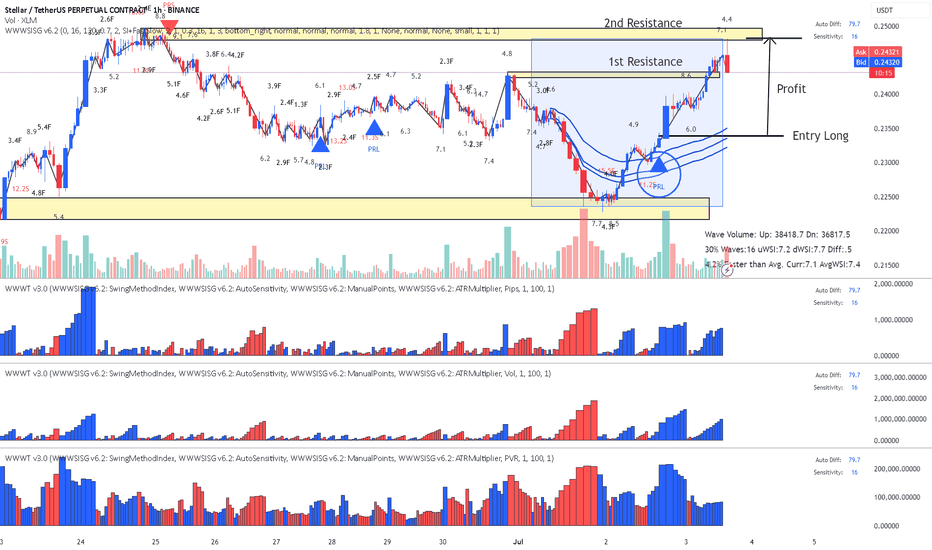
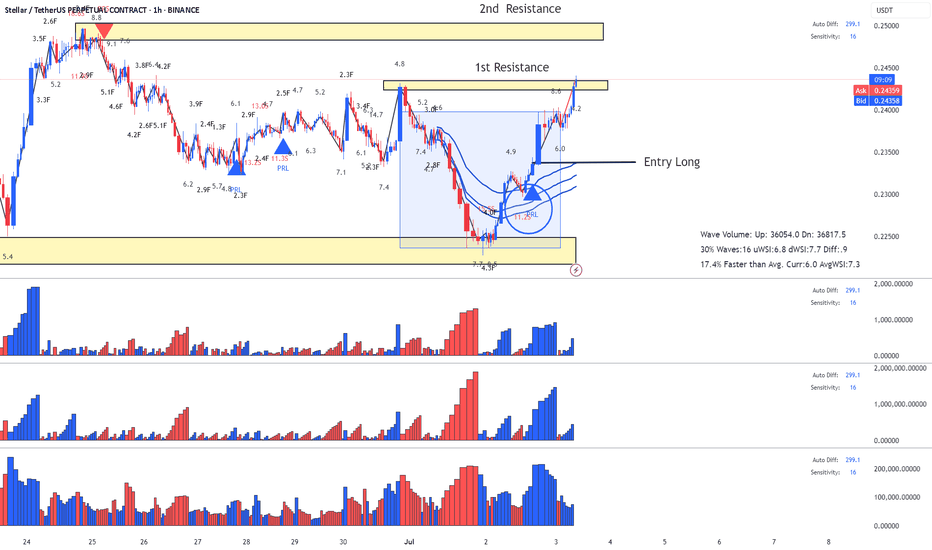
XLM - Stellar - Possible Short coming up - This is Why?Reading the chart (annotations in sync with chart):
1. Location: Fib over-shoot - possible sellers
2. Largest up volume - possible sellers in there
3. Mountain shape PVR - increasing volume as wave progress
4. Abnormal SIs at top (could be closing positions but it also could be sellers absorbing buy orders.
Risky Entry but with better RR enter now. stop above tops, target blue AVWAP
Conservative Entry with worse RR: wait for the break downwards of red AVWAP, target blue AVWAP.
Enjoy, wave and speed index reading!
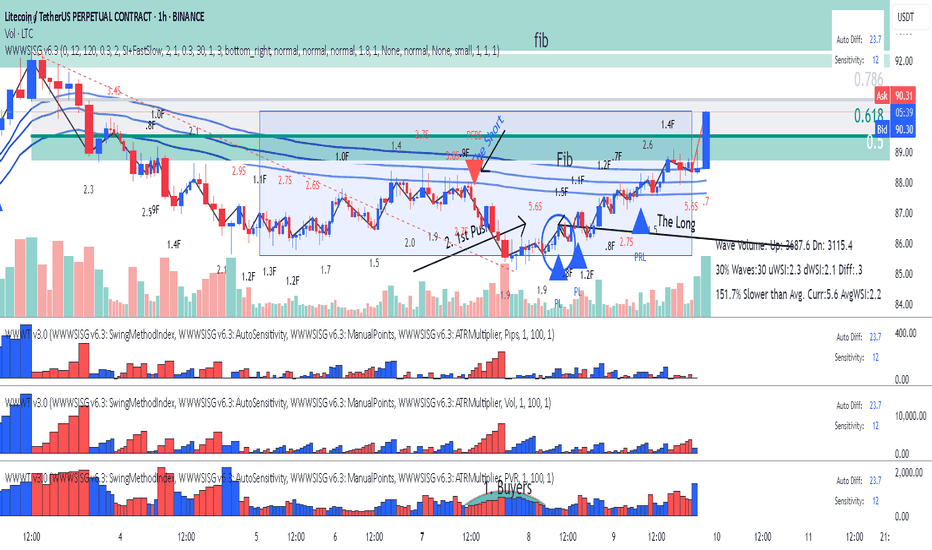
LTC - Litecoin - After the Short the LongAfter the short Signal on the AVWAP line we found buyers at the bottom.
1. PVR mountain shape is the first indication that buyers are coming in.
2. Abnormal SI 5.6 is what I call 1st Push Up.
Finally the entry Plutus signal PL.
You should be careful now because we are crossing Fib 61.8, get you profits sellers might be in that high volume bar. The reaction later waves will be indication if we are going to continue or reverse.
Enjoy Trading the Volume Wave and Speed Index!
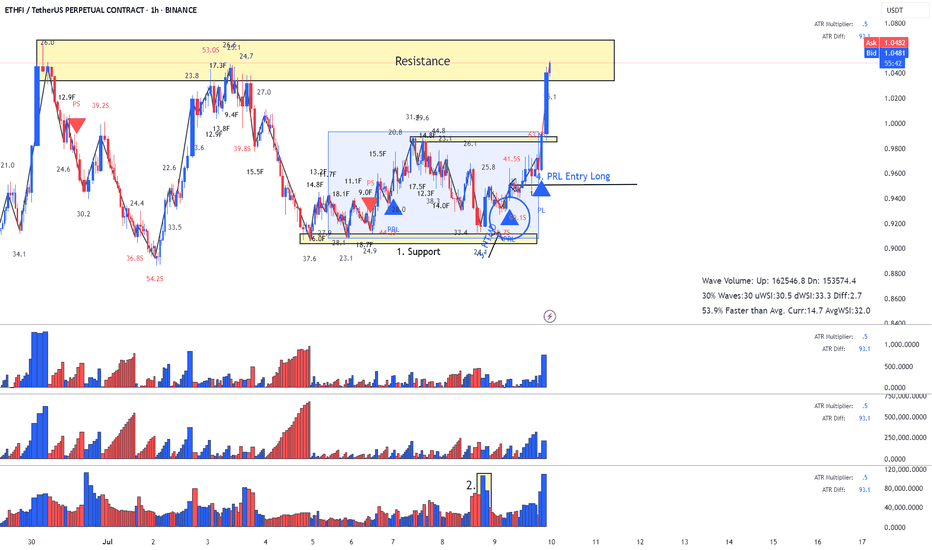
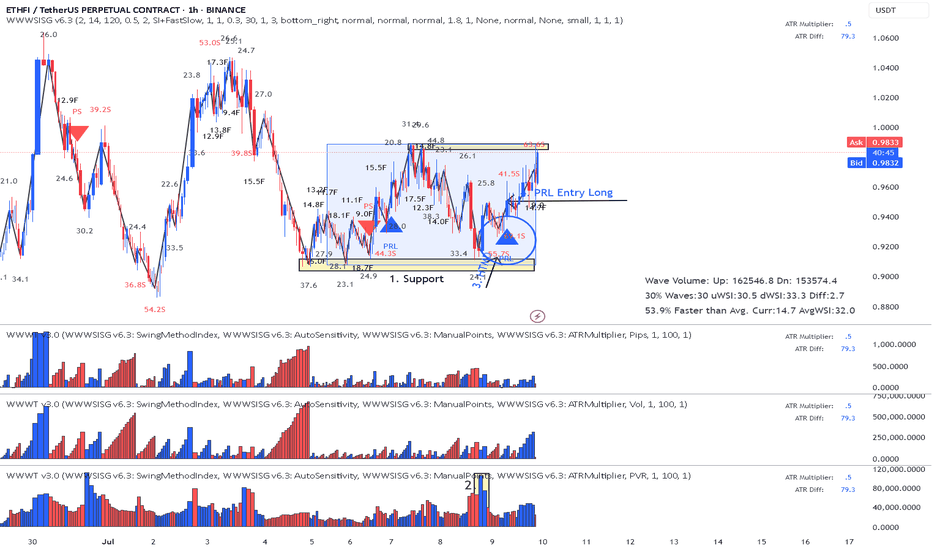
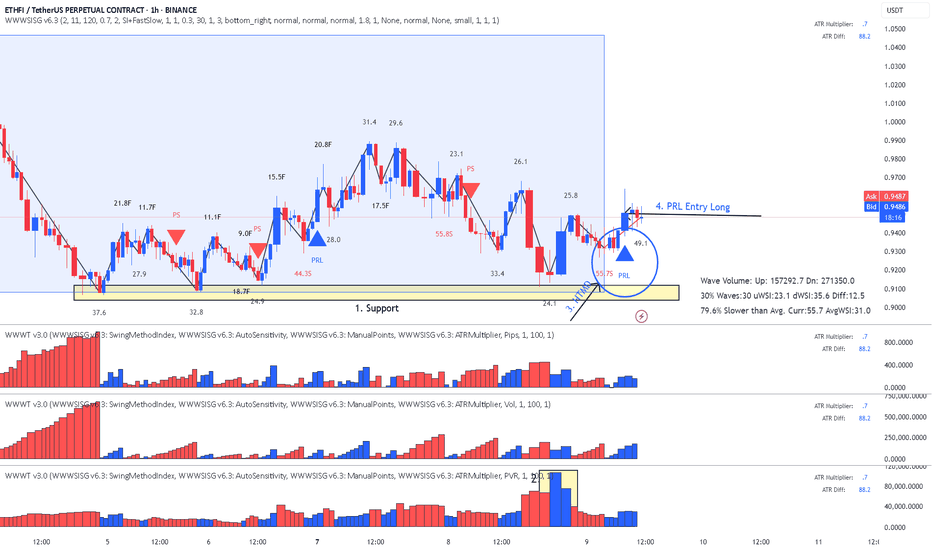
ETHFI _ just went Long reading the waves and Speed IndexReading the recent history of the waves (annotations in sync with the chart):
1. Support
2. Huge volume on PVR indicator at the bottom (buyers)
3. Abnormal Speed Index 55.7 on the down wave , that's Hard to Move Down , more buyers
4. Finally the Entry on a PRL signal.
Enjoy!
PS. I have no idea what this ETHFI crypto is, I just analyzed the chart and it looked like a high probability trade.
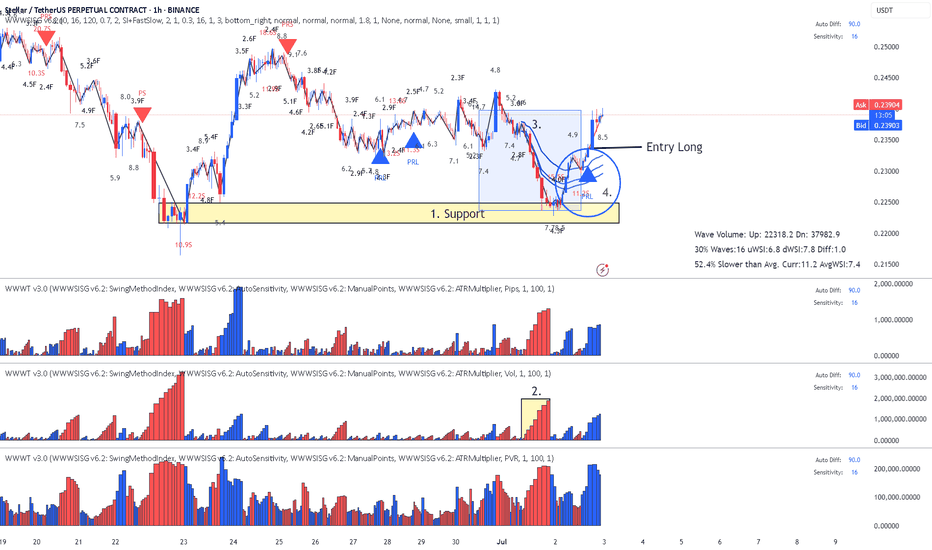
XLM Stellar - Classic Lesson 15 said Long Lesson 15 methodology (annotations in sync with the chart):
1. Support (this where buyers can come in)
2. Largest dn volume wave after a while - Look left - buyers came in previously at the same location.
3. Placed AVWAP and waited for price to cross upwards and pullback again on AVWAP
4. Entry signal PRL with abnormal SI 11.2 (price has a hard time to move down - absorption) after the pullback and that's our entry.
Enjoy!
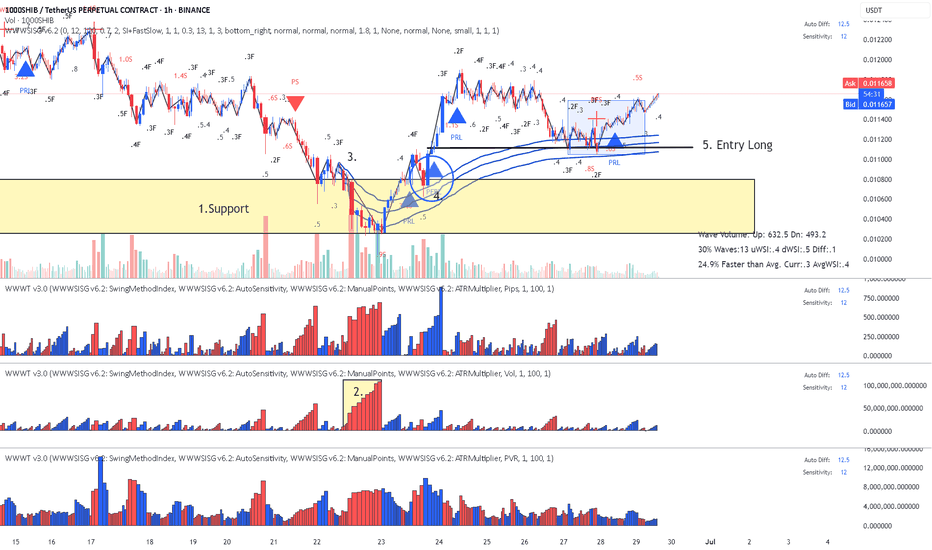
SHIB - Lesson 15 this is how to read the chartUsing Lesson 15 to read the chart (annotations in sync with chart):
1. Support (coming from daily chart)
2. Largest down wave (buyers could be in there)
3. Placed AVWAP wait for the price to cross upwards and pull back
4. PFBL Long signal on the pull back and up we go
Enjoy !
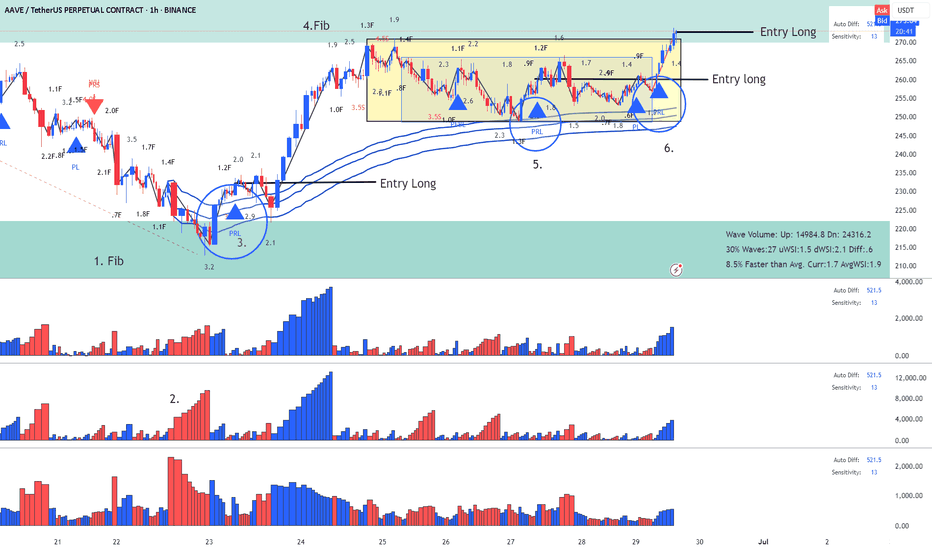
AAVE - Lesson 15 said Long and the pull back another LongReading the chart using Lesson 15 and Exit from Range methodology (annotations in sync with the chart)
1. Fib Location (buyers might enter)
2. Largest down volume wave (potential buyers in there) - Placed AVWAP at the beginning of the down wave wait for price to cross upward and pullback
3. Entry Long with PRL signal - first target fib closed with profit
4. Fib was reached and pull back started
5. PRL long on AVWAP acting a resistance
6. This my last Entry using strategy Exit from Range with a Plutus signal.
This is a risky Long since we are on Fib area, but I will take the risk.
Enjoy!
Beating the S&P 500 with TradingView's Stock ScreenerThis is Mo from MWRIGHT TRADING. The date is Friday, June 27th, 2025.
This video is about selecting stocks that collectively have the potential to consistently beat the S&P 500
I look for smooth and consistent long-, mid-, and short-term performance. For that we need
Building a Screener
What I look for
- Liquidity - that means money, or trading volume.
- Room to move - no overhead resistance
- Favorable trends - stable moving averages
- Good short term signals - a good intraday chart
Filters
- Market Cap 300M to 2B
Not too big, and not too small
- Perf 10Y > Perf 5Y
No long term dips in performance
- Perf 5Y > Perf 1Y
No short term dips in performance
- SMA(300) < Price
Price above moving average
- SMA(200) < Price
Price above moving average
- Avg Volume 10D > 100K
No lightly traded stocks. Liquidity needed
- + SMA(200) >= SMA(300)
Stacked long-term SMAs
- + SMA(50 >= SMA(200)
Stacked short-term SMAs
- + ROE, Trailing 12 Months > 0% (Chris Mayer)
Improving ROE
Examples
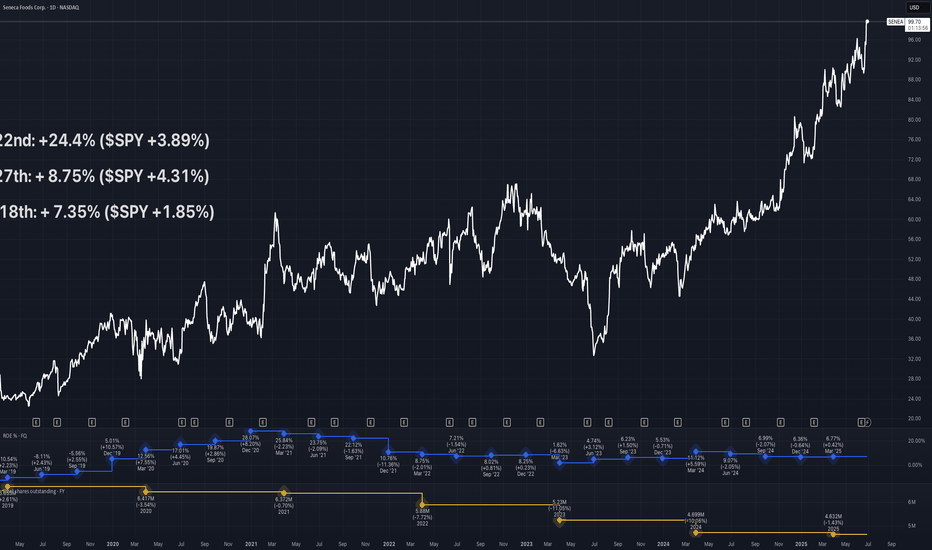
- SENEA
- DGII
Review the charts
- Verify short term performance
- Multi-VWAP (1 hr Chart) - Free Indicator
- Above a rising 5-Day AVWAP
- Magic Order Blocks (5 min Chart) - Free Indicator
- No major overhead resistance
- Verify fundamentals and long term performance
- ROE (Quarterly) - TV Indicator
- Rising ROE
- Float Shares Outstanding - TV Indicator
- Lower float means lower supply. When high demand occurs, this can act as a price catalyst.
- Multi VWAP from Gaps - Free Indicator
- Stacked is good
- 3 SMA Ladies - Custom Indicator
- Stacked is good
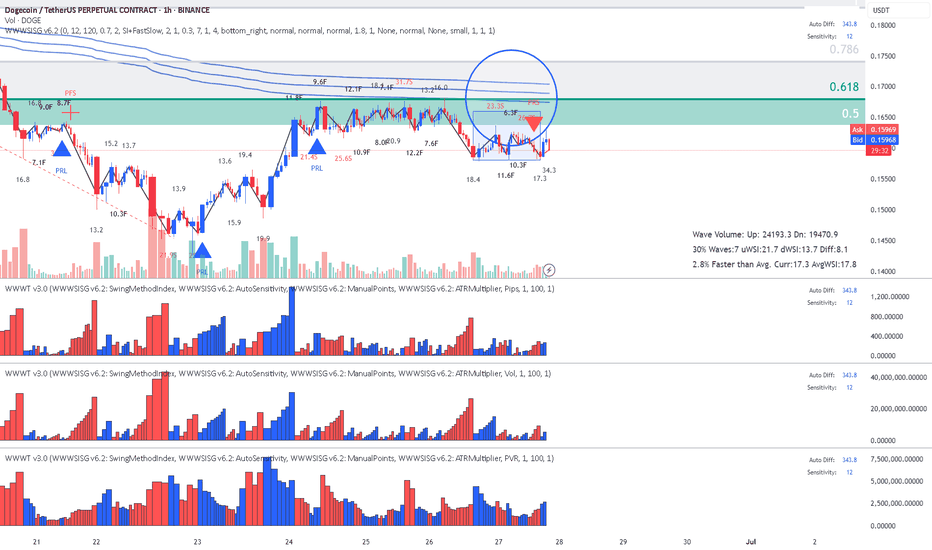
DodgeCoin - Speed Index is telling me ShortReading the chart
1.Location: Fib + touch AVWAP low
2. Speed Index numbers at top on the High side (red numbers) which means Hard to Move Up.
3. PRS Short signal
4. If we do not get stuck into range and break it downwards , it's Short!
Enjoy! Reading the chart with Speed Index!
