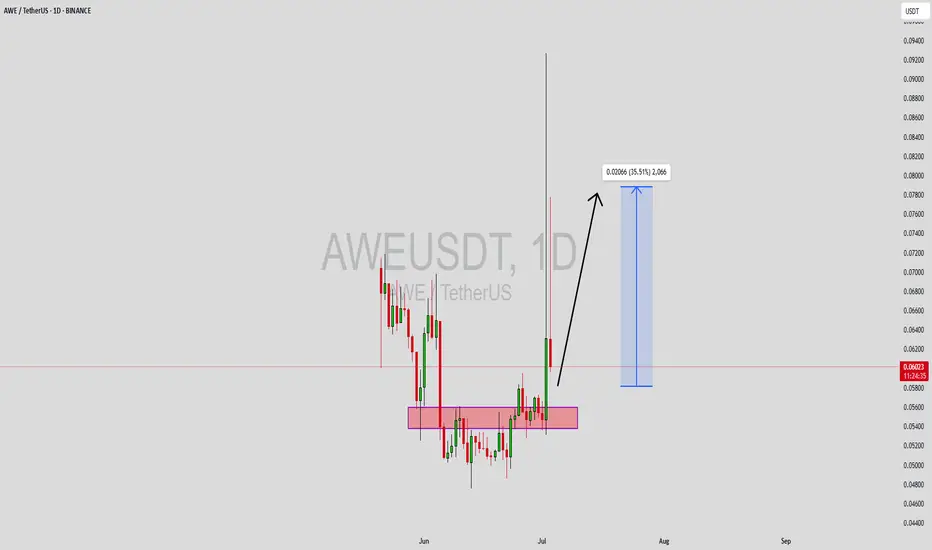
AWEUSDT Forming Bullish TrendAWEUSDT is gaining momentum among traders as it shows signs of a promising breakout from its recent consolidation zone. The chart highlights how the price has tested a key support zone multiple times and has now begun to push upward with increasing volume, suggesting that accumulation is taking place. This healthy volume is often the first sign that smart money is entering the market, laying the groundwork for a sustained rally.
Currently, technical indicators point towards a short-term bullish trend with a potential gain of 30% to 35%+. Such a move could be fueled by the break above the highlighted accumulation area, which has acted as a solid base for this possible upside. Traders looking for opportunities in altcoins with clear risk-to-reward setups will find AWEUSDT’s structure attractive as it shows a balance of stability and momentum.
Adding to the optimism is the fact that more investors are showing interest in this project, hinting at improving sentiment and stronger fundamentals. As the market sentiment improves, coins like AWEUSDT with good liquidity and technical patterns often lead the way for short but impactful moves. It’s a setup worth monitoring closely for swing traders who thrive on these breakout opportunities.
✅ Show your support by hitting the like button and
✅ Leaving a comment below! (What is You opinion about this Coin)
Your feedback and engagement keep me inspired to share more insightful market analysis with you!
AWE
See if we can hold the price above 0.05709
Hello traders.
Please "Follow" to get the latest information quickly.
Have a nice day today.
-------------------------------------
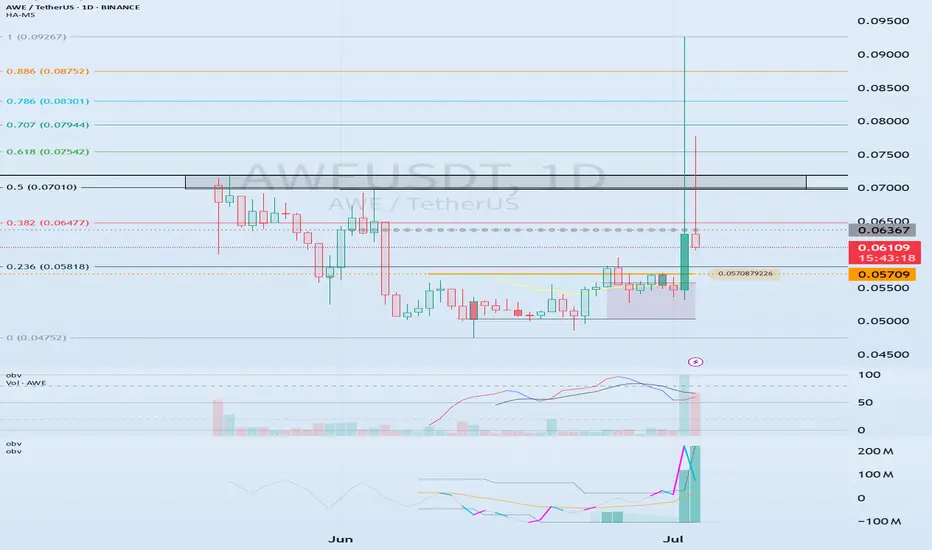
(AWEUSDT 1D chart)
The total supply of 2 billion has been unlocked.
Therefore, it seems that temporary profit taking will occur.
We will have to wait and see what kind of flow it will show in the future, but I think the key is whether there is support around 0.05709, which is the HA-Low indicator point.
Since the volume profile section formed on the current 1D chart is formed at 0.06367, we need to check whether there is support around this area.
The 0.06981-0.07188 section corresponds to the previous high point of the 1M chart.
Therefore, the start of the uptrend is expected to begin when the price breaks through the 0.06981-0.07188 section upward and is maintained.
-
In summary of the above,
- The time to buy is when support is confirmed around 0.05709.
- The resistance section is likely to be around 0.06367 and the 0.06981-0.07188 section.
Therefore, you should create a response strategy depending on whether there is support at the points or sections mentioned above, that is, 0.05709, 0.06367, 0.06981-0.07188.
If the price falls below 0.05709, you should stop all trading and wait and see.
The reason is that it is likely to lead to a step-down trend.
Even if it rises, it is expected that there will be a limit to the rise due to profit taking for the time being because all tokens have been unlocked.
-
Thank you for reading to the end.
I hope you have a successful trade.
--------------------------------------------------
- This is an explanation of the big picture.
(3-year bull market, 1-year bear market pattern)
I will explain more details when the bear market starts.
------------------------------------------------------
AWEUSDT Analysis: A Safe Zone in a MinefieldIn this period where the general market seems like a minefield, I have a striking observation regarding AWEUSDT: I believe this altcoin offers a safe zone compared to the rest of the market. The blue boxes I've marked on the chart stand out as very attractive points for potential entries.
As an intelligent trader, I don't use this "safe zone" designation lightly. These blue boxes represent areas where the price has previously found buyer interest or strong support. When the price approaches these regions, I will be monitoring the market's reaction very closely.
Before entering, as always, I will be seeking confirmation. I will particularly delve into the volume footprint; this is vital to understand if buyers are truly stepping in with strength and conviction. Additionally, I will pay attention to CDV (Cumulative Delta Volume) divergences; these divergences can reveal genuine buying power accumulating in AWEUSDT, contrary to the general market sentiment.
And of course, low timeframe (LTF) confirmations are indispensable for me. Following a breakout from one of the blue boxes, a successful retest of the broken level as support will be a reliable entry signal for me. This is one of those moments where the market is telling you, "I'm here."
Remember, I only trade coins that show a sudden and significant increase in volume. This potential "safe zone" in AWEUSDT and the possible activation of buyers are sufficient reasons for me to keep it on my radar. Despite the general market uncertainty, focused and confirmed opportunities like AWEUSDT can always be found.
Keep a close eye on these blue boxes. Let's listen to the market's whispers and take safe steps in this minefield.
📌I keep my charts clean and simple because I believe clarity leads to better decisions.
📌My approach is built on years of experience and a solid track record. I don’t claim to know it all but I’m confident in my ability to spot high-probability setups.
📌If you would like to learn how to use the heatmap, cumulative volume delta and volume footprint techniques that I use below to determine very accurate demand regions, you can send me a private message. I help anyone who wants it completely free of charge.
🔑I have a long list of my proven technique below:
🎯 ZENUSDT.P: Patience & Profitability | %230 Reaction from the Sniper Entry
🐶 DOGEUSDT.P: Next Move
🎨 RENDERUSDT.P: Opportunity of the Month
💎 ETHUSDT.P: Where to Retrace
🟢 BNBUSDT.P: Potential Surge
📊 BTC Dominance: Reaction Zone
🌊 WAVESUSDT.P: Demand Zone Potential
🟣 UNIUSDT.P: Long-Term Trade
🔵 XRPUSDT.P: Entry Zones
🔗 LINKUSDT.P: Follow The River
📈 BTCUSDT.P: Two Key Demand Zones
🟩 POLUSDT: Bullish Momentum
🌟 PENDLEUSDT.P: Where Opportunity Meets Precision
🔥 BTCUSDT.P: Liquidation of Highly Leveraged Longs
🌊 SOLUSDT.P: SOL's Dip - Your Opportunity
🐸 1000PEPEUSDT.P: Prime Bounce Zone Unlocked
🚀 ETHUSDT.P: Set to Explode - Don't Miss This Game Changer
🤖 IQUSDT: Smart Plan
⚡️ PONDUSDT: A Trade Not Taken Is Better Than a Losing One
💼 STMXUSDT: 2 Buying Areas
🐢 TURBOUSDT: Buy Zones and Buyer Presence
🌍 ICPUSDT.P: Massive Upside Potential | Check the Trade Update For Seeing Results
🟠 IDEXUSDT: Spot Buy Area | %26 Profit if You Trade with MSB
📌 USUALUSDT: Buyers Are Active + %70 Profit in Total
🌟 FORTHUSDT: Sniper Entry +%26 Reaction
🐳 QKCUSDT: Sniper Entry +%57 Reaction
📊 BTC.D: Retest of Key Area Highly Likely
📊 XNOUSDT %80 Reaction with a Simple Blue Box!
📊 BELUSDT Amazing %120 Reaction!
📊 Simple Red Box, Extraordinary Results
📊 TIAUSDT | Still No Buyers—Maintaining a Bearish Outlook
📊 OGNUSDT | One of Today’s Highest Volume Gainers – +32.44%
📊 TRXUSDT - I Do My Thing Again
📊 FLOKIUSDT - +%100 From Blue Box!
I stopped adding to the list because it's kinda tiring to add 5-10 charts in every move but you can check my profile and see that it goes on..

ALTO is rising with earnings expected ASCENDING CHANNELNASDAQ:ALTO
ALTO has earnings post-market 8/8/22. per Yahoo! Finance
last earnings were significantly 10% of share price
Chart (60 minutes) shows a two-week ascending channel as well
as increasing relative volume now sitting at a volume
profile resistance shelf and consistently above
the cloud indicator.
Will ALTO continue on the uptrend or bounce off resistance?

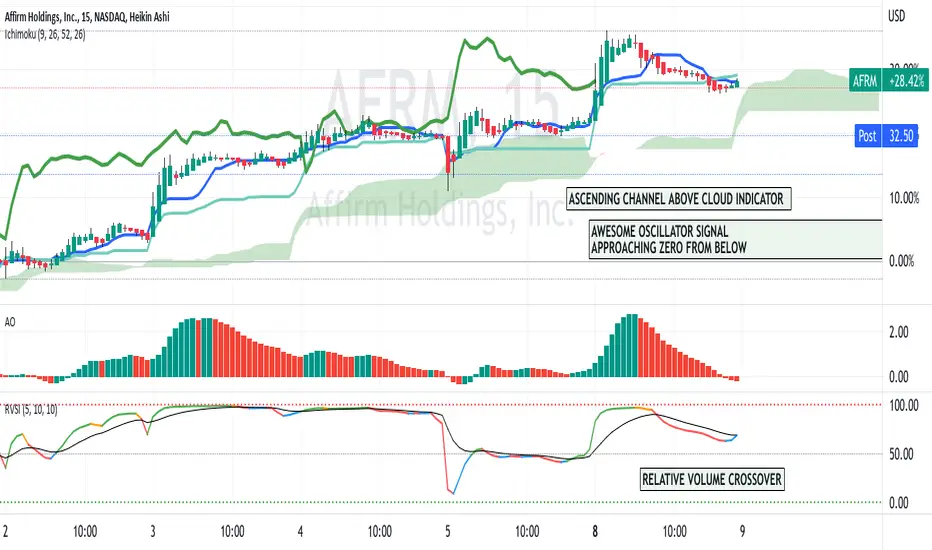
AFRM SWING TRADE ( ASCENDING CHANNEL PATTERN)NASDAQ:AFRM
AFRM has ran 30% for the first third of August
Indicators on the chart validate the uptrend.
FINTECH has been a good sector of late,
This is looking like a good swing trade or call option.
Please offer your opinion