Smart Liquidity in TradingIntroduction: What Is Smart Liquidity in Trading?
Liquidity is the backbone of financial markets—it refers to how easily assets can be bought or sold without causing drastic price changes. But as markets have evolved with the rise of algorithmic trading, decentralized finance (DeFi), and AI, a more sophisticated concept has emerged: Smart Liquidity.
Smart Liquidity isn’t just about having buyers and sellers in a market. It’s about efficient, dynamic, and intelligent liquidity—where technology, data, and algorithms converge to improve how trades are executed, how markets function, and how risks are managed. Whether in traditional stock markets, forex, or blockchain-based platforms, smart liquidity is now central to modern trading strategies.
Chapter 1: Understanding Traditional Liquidity
Before diving into smart liquidity, let's revisit the basics of traditional liquidity:
Bid-Ask Spread: A narrow spread indicates high liquidity; a wide one shows low liquidity.
Market Depth: The volume of orders at different price levels.
Turnover Volume: How frequently assets are traded.
Price Impact: How much a large order moves the price.
In traditional finance, liquidity providers (LPs) include:
Market makers
Banks and financial institutions
High-frequency trading firms
Exchanges
Liquidity ensures:
Stable pricing
Smooth trade execution
Lower transaction costs
Chapter 2: The Evolution Toward Smart Liquidity
What Changed?
Algorithmic Trading: Algorithms can detect, provide, or withdraw liquidity in milliseconds.
Decentralized Finance (DeFi): Smart contracts offer on-chain liquidity pools without intermediaries.
AI & Machine Learning: Predictive models can identify where liquidity is needed or likely to shift.
Smart Order Routing (SOR): Optimizes trade execution by splitting orders across multiple venues.
These technologies gave rise to “smart liquidity,” where liquidity is not static but adaptive, context-aware, and real-time optimized.
Chapter 3: Components of Smart Liquidity
1. Liquidity Intelligence
Advanced analytics track:
Market depth across exchanges
Order flow trends
Latency and slippage statistics
Arbitrage opportunities
This helps institutions dynamically manage their liquidity strategies.
2. Smart Order Routing (SOR)
SOR systems:
Automatically split large orders across venues
Route based on fees, liquidity, latency, and execution quality
Reduce market impact and slippage
SOR is key in both equity and crypto markets.
3. Algorithmic Liquidity Providers
Market-making bots adjust quotes in real-time based on:
Volatility
News sentiment
Volume spikes
Risk exposure
They enhance liquidity without manual intervention.
4. Automated Market Makers (AMMs)
Used in DeFi:
No traditional order book
Prices determined algorithmically via a liquidity pool
Traders interact with pools, not people
Popular AMMs: Uniswap, Curve, Balancer.
Chapter 4: Use Cases of Smart Liquidity
1. HFT Firms and Institutions
Use predictive liquidity models
Deploy SOR to reduce costs and slippage
Balance exposure across markets
2. Retail Traders
Benefit from tighter spreads and faster execution
Use platforms with AI-driven order matching
3. Decentralized Finance (DeFi)
Anyone can provide liquidity and earn fees
Smart liquidity enables 24/7 trading with no intermediaries
New protocols optimize capital allocation via auto-rebalancing
4. Stablecoin & Forex Markets
Smart liquidity ensures 1:1 peg stability
Algorithms prevent arbitrage imbalances
Chapter 5: Key Metrics to Measure Smart Liquidity
Metric Description
Slippage Difference between expected and actual execution price
Spread Efficiency How close bid-ask spreads are to theoretical minimum
Fill Rate How much of an order is filled without delay or rerouting
Market Impact Price movement caused by a trade
Liquidity Utilization How efficiently capital is allocated across pairs/assets
Latency Time taken from order input to execution
These metrics help evaluate the quality of liquidity provided.
Chapter 6: Risks and Challenges of Smart Liquidity
Despite its benefits, smart liquidity isn’t perfect.
1. Flash Crashes
Caused by sudden withdrawal of liquidity bots
Example: 2010 Flash Crash in U.S. equities
2. Manipulation Risks
Predatory algorithms can spoof or bait other traders
"Liquidity mirages" trick algorithms
3. Smart Contract Failures (DeFi)
Vulnerabilities in AMMs can drain entire liquidity pools
Hacks like those on Curve and Poly Network show smart liquidity can be fragile
4. Impermanent Loss (DeFi)
LPs may lose value if asset prices diverge significantly
Complex math and simulations needed to manage it
5. Regulatory Uncertainty
Especially in crypto, regulators still debating on decentralized liquidity protocols
Conclusion
Smart liquidity represents the next evolution of market infrastructure. It's not just about having capital in the market—it's about how that capital moves, adapts, and executes.
From hedge funds deploying intelligent routing systems to DeFi users earning yields through AMMs, smart liquidity touches every corner of modern finance. As technology continues to mature, expect liquidity to become even more predictive, responsive, and intelligent—unlocking a new level of speed, precision, and access for traders around the world.
AXISBANK
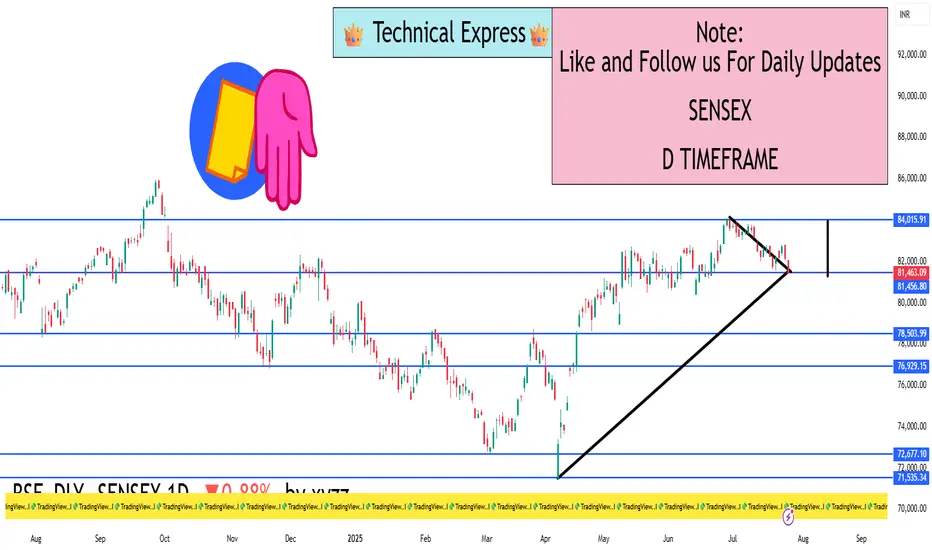
SENSEX 1D Timeframe📉 SENSEX Daily Overview (as of July 25, 2025)
Current Price: Around 81,460
Daily Change: Down by approximately 720 points (–0.9%)
Day’s High: About 82,070
Day’s Low: About 81,400
Previous Close: Around 82,184
📊 1-Day Candlestick Analysis
The candle for today is bearish, indicating strong selling pressure.
The price opened near previous levels but faced resistance at around 82,000.
Sellers dominated most of the day, pushing the index toward the 81,400 support zone.
🔍 Key Support and Resistance Levels
Level Type Price Range
Resistance 82,000 – 82,200
Support 81,400 – 81,000
If Sensex breaks below 81,400, the next target could be around 80,500 or 79,900.
If it holds above support and bounces, it could retest 82,200.
🧠 Technical Trend Analysis
Short-Term Trend: Bearish
Medium-Term Trend: Neutral to mildly bullish (as long as above 80,000)
Market Structure: Lower highs forming, suggesting pressure building on bulls
Indicators (assumed):
RSI may be approaching oversold
MACD likely showing bearish crossover
Volume increasing on red candles—indicating strong sell interest
📌 Sentiment & Market Context
Financial stocks (like banking, NBFCs) are under pressure.
Global cues (such as interest rate uncertainty and geopolitical concerns) are impacting investor confidence.
FII outflows and weak earnings in key sectors are adding to bearish momentum.
The broader trend remains range-bound, but with short-term downside bias.
✅ Strategy Suggestions (For Traders & Investors)
Swing Traders: Wait for a reversal candle (like a bullish engulfing or hammer) before considering long positions.
Breakout Traders: Watch for breakdown below 81,000 for continuation of the fall.
Positional Traders: Can wait to enter near 80,000–79,500 if the market holds that key level.
🔄 Summary
SENSEX is under pressure with a drop of 720+ points.
Technical structure suggests caution, especially if 81,000 breaks.
Support: 81,000 – 80,500
Resistance: 82,000 – 82,200
Review and plan for 18th July 2025Nifty future and banknifty future analysis and intraday plan.
Analysis of quarterly results.
This video is for information/education purpose only. you are 100% responsible for any actions you take by reading/viewing this post.
please consult your financial advisor before taking any action.
----Vinaykumar hiremath, CMT

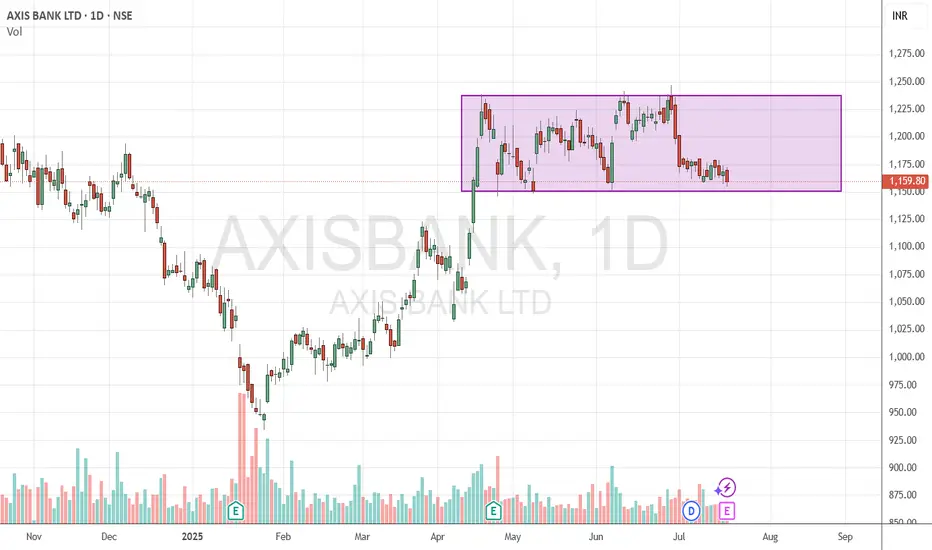
Axis Bank BuyAxis Bank trading in range. Currently it is near the bottom of the range. Buy @CMP (1165) with SL of 1140 (6 points below previous low of the range. Price may make new low before going up) and target of 1200 & 1235.
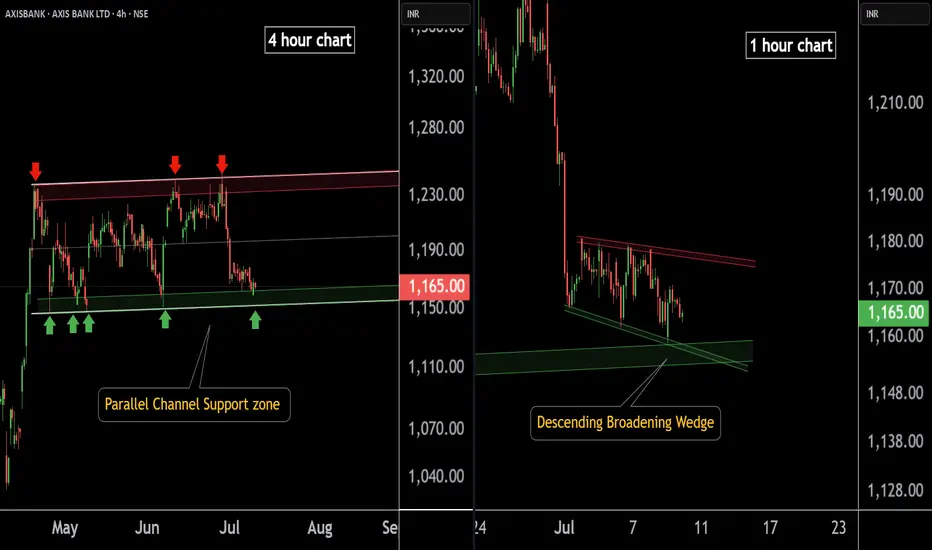
AXIS BANK at Best Support !!Here are two charts of Axis Bank — one in the 4-hour timeframe and the other in the 1-hour timeframe.
4-Hour Timeframe Chart:
In this chart, Axis Bank is moving within a parallel channel, with the support zone lying in the 1150–1160 range.
1-Hour Timeframe Chart:
Axis Bank is forming a descending broadening wedge pattern, with support near the 1150–1155 zone.
If this level is sustain ,then we may see higher prices in Axis Bank.
Thank You !!
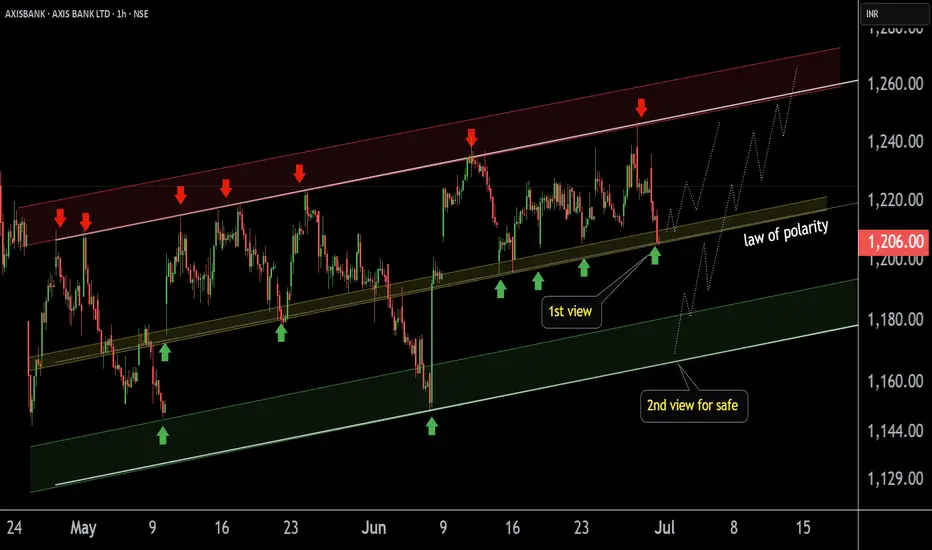
AXIS BANK at Best Support !!This is the 1 hour chart of AXIS BANK .
Axis bank having a good law of polarity at 1200 level.
Axisbank is moving in well defined parallel channel with support range 1160-1180 .
If this level is sustain , then we may see higher prices in AXISBANK.
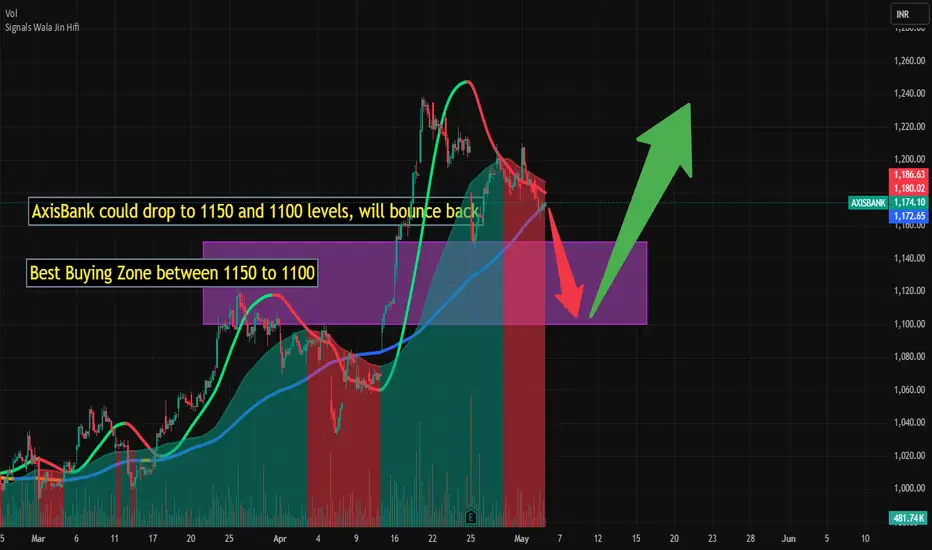
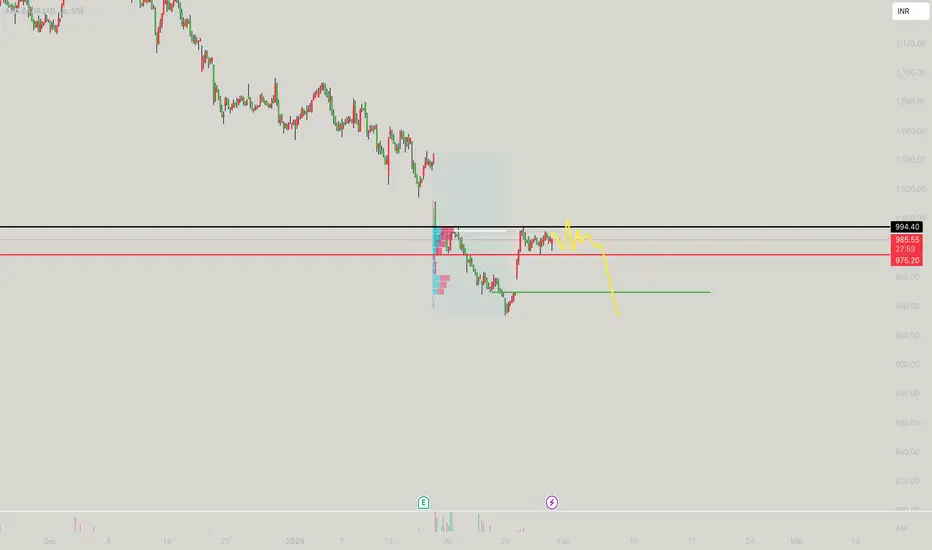
AxisBank could drop to 1150 and 1100 for bounce backAxis Bank could drop to 1150 and 1100 levels for bounce back to 1200 and plus levels.
Note: This is not a buy/sell trade call. Trade at your own will and analysis. Use stop loss too.
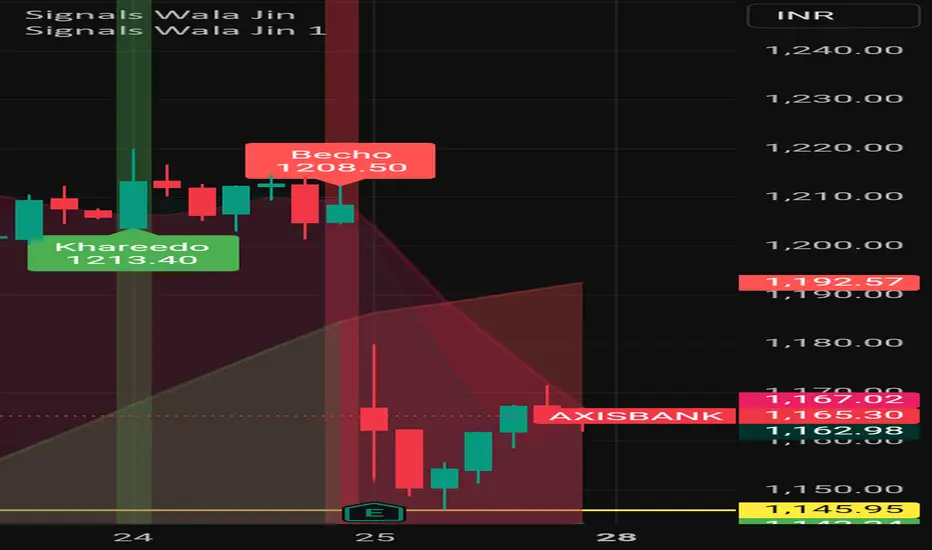
Live buy signal in AxisBank at 1182.6Live Khareedo (Buy) signal in AxisBank at 1182.6. Lets see how much it will rise.
Note: This is not a buy/sell trade call. Use stop loss.
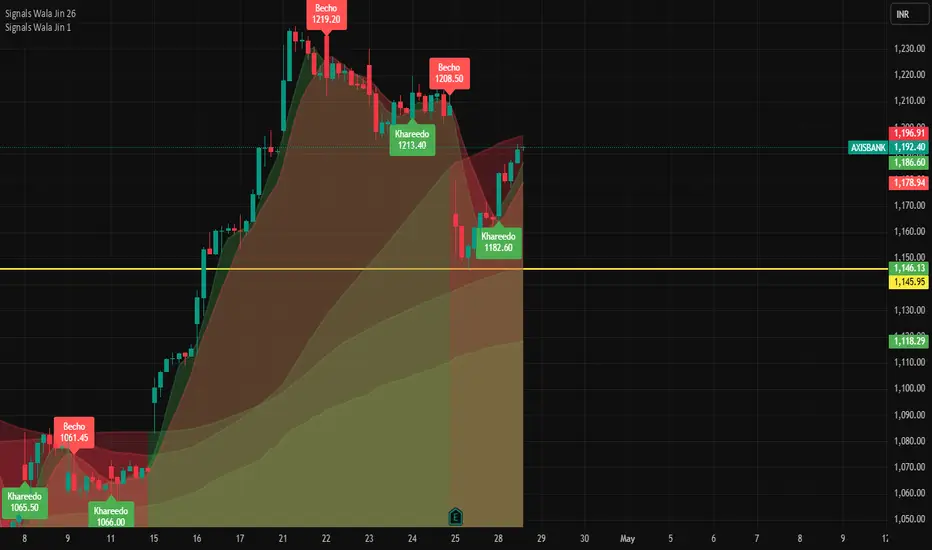
63 points dropped #AxisBank after #SignalsWalaJin signal63 points dropped #Axisbank share after generation of Signal "Becho" means sell by my custom designed indicator named SignalsWalaJin
Note: This is not a buy sell trade call. Trade at your own will. Use stop loss too.
Axis Bank left bearish zoneAxis bank just left bearish zone and entered bullish zone.
Note. This is not a buy sell trade call.

AXISBANKNSE:AXISBANK
One Can Enter Now !
Or Wait for Retest of the Trendline (BO) !
Or wait For better R:R ratio !
Note :
1.One Can Go long with a Strict SL below the Trendline or Swing Low.
2. R:R ratio should be 1 :2 minimum
3. Plan as per your RISK appetite and Money Management.
Disclaimer : You are responsible for your Profits and loss, Shared for Educational purpose

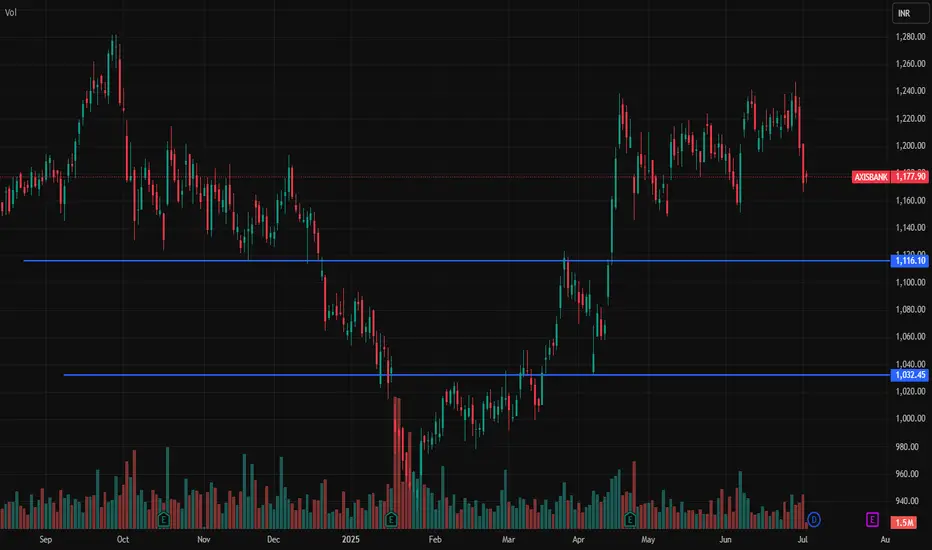
AXISBANK - Whats nExt?So after some anticipation from my indian friends for HDFC Bank LTD, here its for AXISBANK ltd. Here breaking blackline with vol, would fill the 1033 the upside tasuki gaps, but high FVG below the line i marked!
Axis Bank ShortAxis Bank Short & then Long Trade
Short Entry
CMP
Target 981
Long Entry 980
Target 1135
Price will enter long term correction after that.
SL 1193
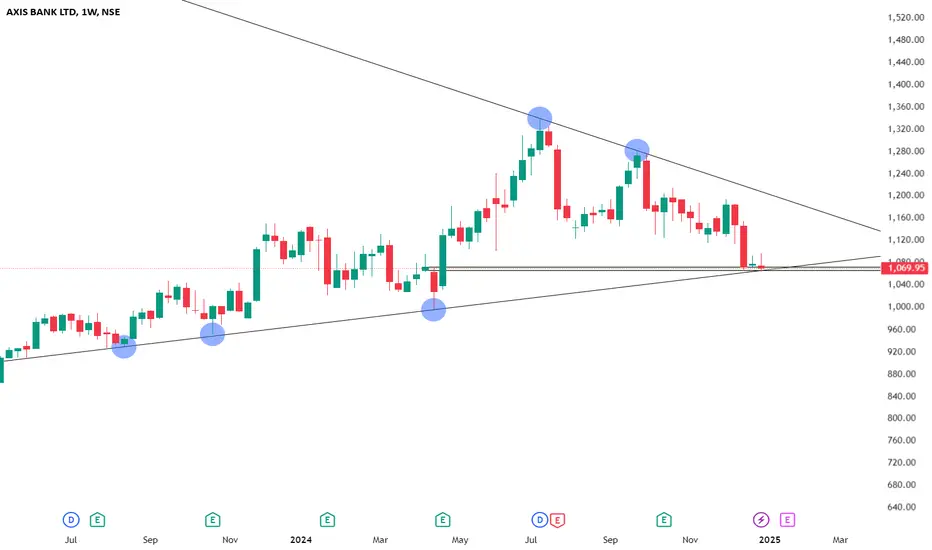
AXIS BANK AT TL SUPPORT
Axis Bank is forming a **symmetrical triangle pattern**, and it’s better to wait for a **candle confirmation** at the weekly time frame closing before planning an entry. For a **short-term plan**, can expect a target up to the **resistance level**.
AXISBANK--Near Its Demands??This stock is bullish from long term.
we have to look for buying opportunities to continue in the trend.
if we see trendline is acting as support multiple times at bottom side...
on the topside we have dynamic resistance in the form of trendline.
when price takes the support again from the bottom side trendline,
we will go for buying, when price breaks the topside trendline and retest.
we have a lot of liquidity is lies below the trendline on bottom side.
If price takes all the liquidity then an immediate entry is placed at 960 to 920 levels.
Look for buying opportunities in this stock.

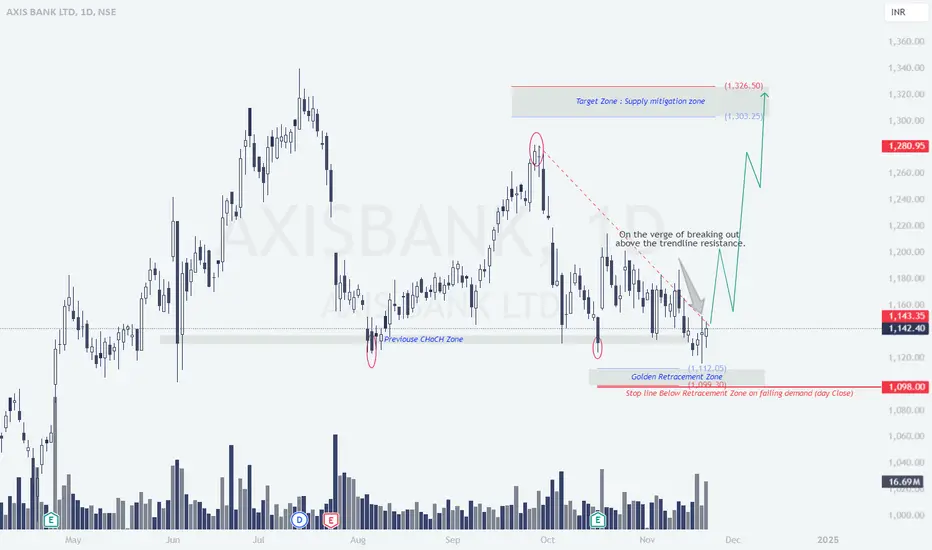
Axis Bank: Preparing to Break Resistance – A Rally in the MakingCurrent Price: ₹1,142.40 (+0.29%)
Axis Bank is consolidating near its Golden Retracement Zone (₹1,098 - ₹1,112) after breaking out of its Previous CHoCH Zone (Change of Character). It is also testing a trendline resistance, with potential for a breakout rally toward supply mitigation levels.
Key Levels:
Buy Zone: ₹1,112 - ₹1,143 (Golden Retracement Zone)
Stop Loss: ₹1,098 (on a daily close below the retracement zone)
Target 1: ₹1,280
Target 2: ₹1,303 - ₹1,326 (Supply mitigation zone)
Key Observations:
Golden Retracement Zone: Acts as a strong support for a bounce.
Trendline Breakout: A successful breakout above the resistance line may lead to sustained upward momentum.
Supply Zone: ₹1,303 - ₹1,326 is the next key level to watch for profit booking.
Disclaimer:
This analysis is for educational purposes only and is not financial advice. I am not a SEBI-registered analyst. Please do your own research or consult a financial advisor before making any investment decisions.
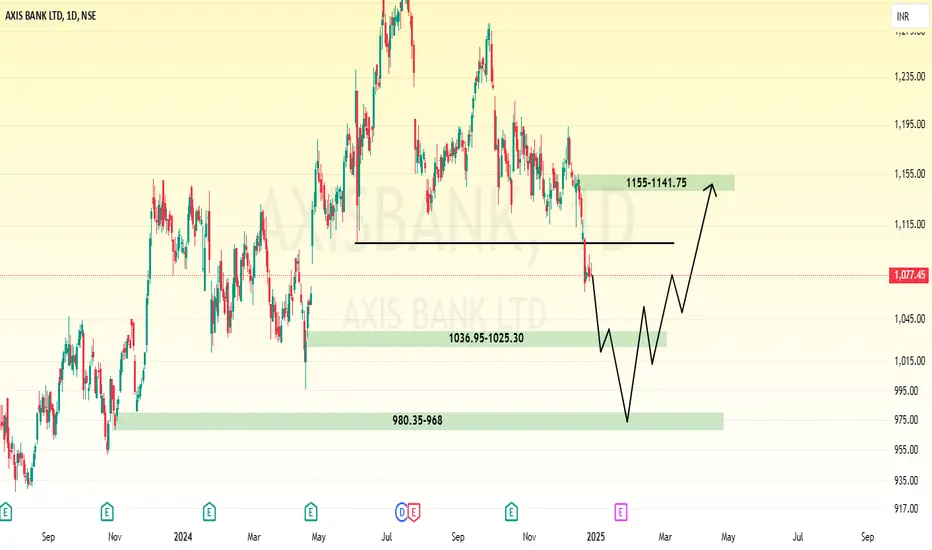
Axis Bank Technical Analysis: Cautious Outlook Near Key Support
Axis Bank is currently trading near a crucial support level at approximately ₹1120, significantly below its all-time high of ₹1340. Recent price action within a range of around ₹1133 indicates a period of consolidation.
Bearish Scenario: A decisive break below ₹1120 would be a bearish signal, potentially triggering a further decline towards ₹1080.
Market Context: It's vital to consider the broader market. Both Nifty and Bank Nifty indices are also trading near their support levels, suggesting a potential market-wide rebound. This adds a layer of uncertainty to the Axis Bank outlook.
Bullish Scenario: Conversely, a sustained move above the resistance level of ₹1200 would signal a significant shift in momentum, potentially initiating a rally.
Recommendation: Given the current market dynamics and Axis Bank's proximity to key support, we recommend a cautious approach. Investors should closely monitor price action and volume before making any significant trading decisions. A break above or below the key levels, accompanied by strong volume, would provide greater confirmation of the prevailing trend.

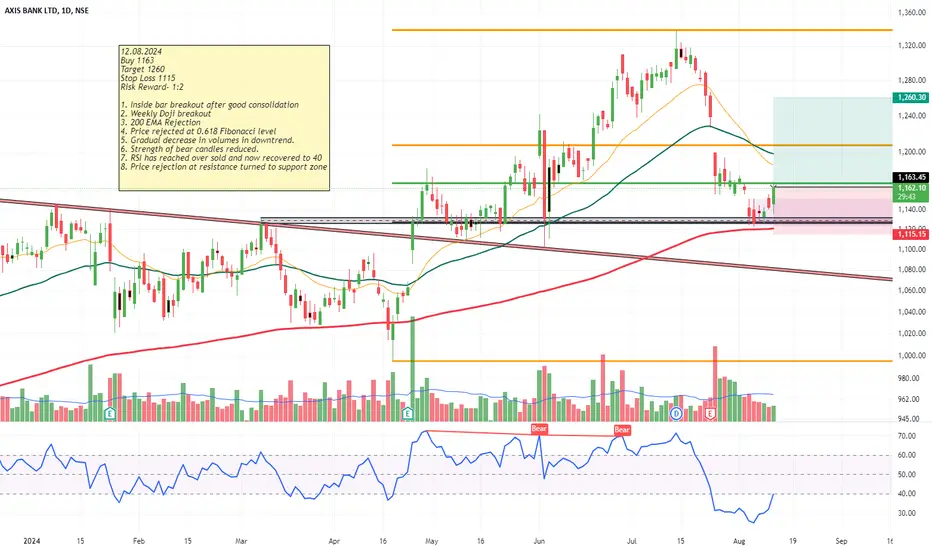
Axis Bank-Bullish Swing- Strong Supply zone!!
12.08.2024
Buy 1163
Target 1260
Stop Loss 1115
Risk Reward- 1:2
1. Inside bar breakout after good consolidation
2. Weekly Doji breakout
3. 200 EMA Rejection
4. Price rejected at 0.618 Fibonacci level
5. Gradual decrease in volumes in downtrend.
6. Strength of bear candles reduced.
7. RSI has reached over sold and now recovered to 40
8. Price rejection at resistance turned to support zone
NSE:AXISBANK
Ascending triangle | Trend continuation | Intradayhey Traders,
An intraday entry awaiting.
Its a ascending triangle breakout and works as a trend continuation.
Enter after the triangle breakout, make an aggressive entry.

Axis BankImportant points marked.
*****Education purpose only*****
*****Investing in Equity is subjected to market risk do own research before investing*****

Axis Bank Ltd breaks key levels, bullish momentum building!➡️ Bullish breakout above ₹1,199.70, with next target at ₹1,324.3
