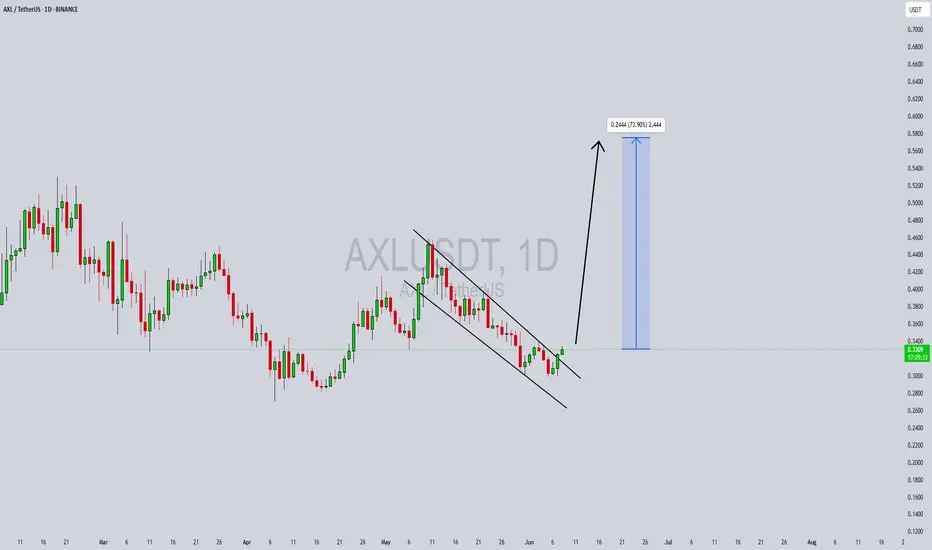
AXLUSDT Forming Descending Wedge bullishAXLUSDT is currently showing strong bullish signals after consolidating at a significant support level, with a notable uptick in trading volume. This renewed volume interest often precedes a breakout move, and the technical structure is shaping up for a potential surge. With momentum building and price action tightening, a projected gain of 60% to 70% is realistically within reach in the short to mid-term. This aligns well with historical price behavior and upcoming support-to-resistance flips.
Axelar (AXL) continues to attract investor interest due to its foundational role in cross-chain communication and interoperability. As more blockchains develop in silos, the need for protocols like Axelar grows. Its ability to facilitate seamless transfers across multiple chains makes it a strong contender in the next wave of infrastructure-focused crypto projects. Market participants are increasingly positioning themselves in utility-driven tokens like AXL that solve real scalability and connectivity problems in DeFi and the broader crypto ecosystem.
From a technical perspective, AXLUSDT is forming a bullish continuation pattern, suggesting that the recent consolidation is simply a pause before another impulsive leg to the upside. The presence of strong support zones, combined with increased volume and investor sentiment, makes this a high-probability setup for breakout traders and swing investors alike. If bullish momentum continues, the upside targets fall well within the 60% to 70% projected gain range.
Traders should keep a close watch on breakout confirmation signals and volume spikes, which could mark the start of a sustained bullish rally. As adoption and attention around cross-chain solutions grow, AXL is likely to see further market traction and price appreciation.
✅ Show your support by hitting the like button and
✅ Leaving a comment below! (What is You opinion about this Coin)
Your feedback and engagement keep me inspired to share more insightful market analysis with you!
Axlusdtlong
AXLUSDT 1D AnalysisAXL ~ 1D Analysis
#AXL Managed to penetrate this resistant line and is currently trying to maintain it. As long as the price is above this S/R line, bullish can still encourage prices.

#AXL/USDT#AXL
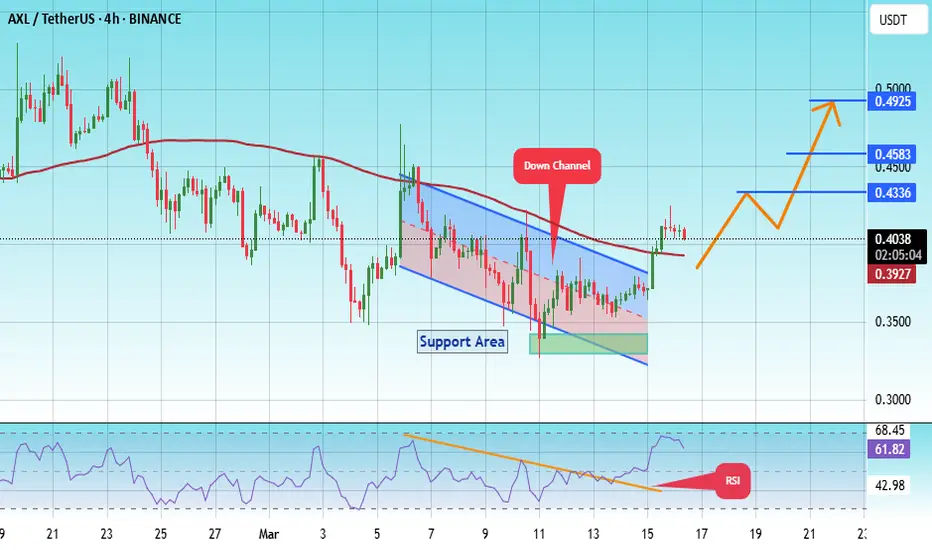
The price is moving within a descending channel on the 1-hour frame, adhering well to it, and is heading for a strong breakout and retest.
We are experiencing a rebound from the lower boundary of the descending channel, which is support at 0.3360.
We are experiencing a downtrend on the RSI indicator, which is about to break and retest, supporting the upward trend.
We are looking for stability above the 100 Moving Average.
Entry price: 0.4040
First target: 0.4336
Second target: 0.4580
Third target: 0.4925
AXLUSDT 1DAXL ~ 1D Analysis
#AXL High risk trading, Buy after successfully penetrating this resistant line or buy after successfully testing this support block. with a short -term target of at least 10%+.

AXLUSDT 2DAXL ~ 2D Analysis
#AXL Test this support, buy from here if you still have a Conviction on this Coin with a minimum target of 15%+

#AXL/USDT#AXL
The price is moving within a bearish channel pattern on the 4-hour frame, which is a strong retracement pattern
We have a bounce from a major support area in green at 0.5000
We have a tendency to stabilize above the Moving Average 100
We have a downtrend on the RSI indicator that supports the rise and gives greater momentum, upon which the price is based higher at the discount
Entry price is 0.5720
The first target is 0.7670
The second target is 0.9000
The third goal is 1.05

AXLUSD - 4h Consolidation ZoneAXLUSD - 4h Consolidation Zone
If you like my AT, and you agree with the approaches, please FOLLOW ME and press BOOST so we can share it with more people. We are working on an automated trading tool so that everyone can apply their strategies in a VISUAL and PROFESSIONAL way, as we present in the analysis.
Thank you!
_______________________________________________________
AXLUSD - 4h Consolidation Zone
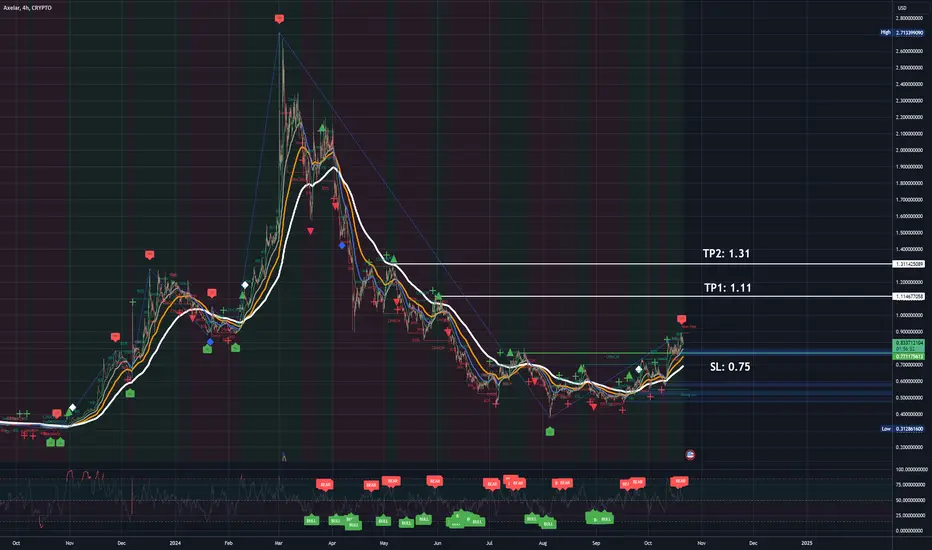
AXL broke strongly from 0.40 which we marked as dynamic support and is now trading at 0.81
It is possible that the price will test 0.75 before developing a new momentum that leads the value to seek 1.11.
LEVELS:
SL: 0.75
TP1: 1.11
TP2: 1.31
Part of its development will have to do with what btc does, but it seems that October will continue to be a BULLISH month.
______________________________________________________
Automated Cryptocurrency Trading Bots: All these strategic alternatives can be configured with TradeX BoT, since it will allow you to position in both directions without having to block any amount per position. It will only be necessary for the conditions to be met, either downward or upward, for the orders to be executed in one direction or another, taking the necessary deposits from your portfolio.
TradeX BoT (in development): Tool to automate trading strategies designed in TradingView. It works with both indicators and technical drawing tools: parallel channels, trend lines, supports, resistances... It allows you to easily establish SL (%), TP (%), SL Trailing... multiple strategies in different values, simultaneous BUY-SELL orders, conditional orders.
This tool is in the process of development and the BETA will soon be ready for testing.
FOLLOW ME and I will keep you informed of the progress we make.
I share with you my technical analysis assessments on certain stocks that I follow as part of the strategies I design for my portfolio, but I do not recommend anyone to operate based on these indicators. Inform yourself, train yourself and build your own strategies when investing. I only hope that my comments help you on your own path :)
AXL/USDT Potential Breakout AheadAxs/USDT is showing potential for a breakout from a symmetrical triangle pattern on the 4-hour time frame. A solid breakout could happen soon. If the price breaks out and successfully retests the breakout level, we might see a surge of 40-80% in the coming days. Keep an eye on this movement, as it could be significant. This is not financial advice—please do your own research.

AXL still has a great trade set upAXL on pull backs to 0.61-0.65 level presents a great position trade for the long term. I will be accumulating in any pull back. My initial price target is 1.26.
This is a 2 day chart so it will take some time to play out. Wait for the pull backs. Both Market Cipher and my modified MACD looks good for a long trade. This is not a financial advice. DYOR.

AXLUSD 1D - Rises above $0.70AXLUSD 1D - Rises above $0.70
AXLUSD is a stock to watch. It had a continuous rise that took it to a maximum of $2.70. It is now trading at $0.60.
It has already overcome the downward trend and is settling its price to begin a new price escalation. It has to overcome the previous lower high at $0.70 to be ready for a bullish rally.
Before breaking upwards, it could mark a DOUBLE BOTTOM in the $0.40 area. Hence the importance of breaking the $0.70 levels and not losing the dynamic support.
The objectives are clearly marked.
This strategy can be executed with TradeX BoT when we finish developing it.
TradeX BoT (in development):
Tool to automate trading strategies designed in TradingView. It works with both indicators and graphic design tools: parallel channels, trend lines, supports, resistances… It allows you to easily establish SL (%), TP (%), SL Trailing… multiple strategies in different values, simultaneous BUY-SELL orders, conditional orders.
This tool is in the development process and the BETA will soon be ready for testing.
FOLLOW ME and I will keep you informed of the progress we make.
I share with you my technical analysis assessments on certain values that I follow as part of the strategies I design for my portfolio, but I do not recommend anyone to operate based on these indications. Inform yourself, train yourself and build your own strategies when investing. I only hope that my comments help you on your own path :)

AXL/USDT Plan Axl/USDT is currently approaching a potential breakout from a triangle pattern, suggesting that a significant price movement could be on the horizon. If the breakout is successful, I anticipate a bullish trend in the coming days. It's important to monitor key resistance levels for confirmation. Remember, this is not financial advice; always do your own research (DYOR) before making any investment decisions.

AXLUSDT 2DAXL ~ 2D
#AXL We would say Bullish on this Token once it breaks the resistance line of this descending pattern.

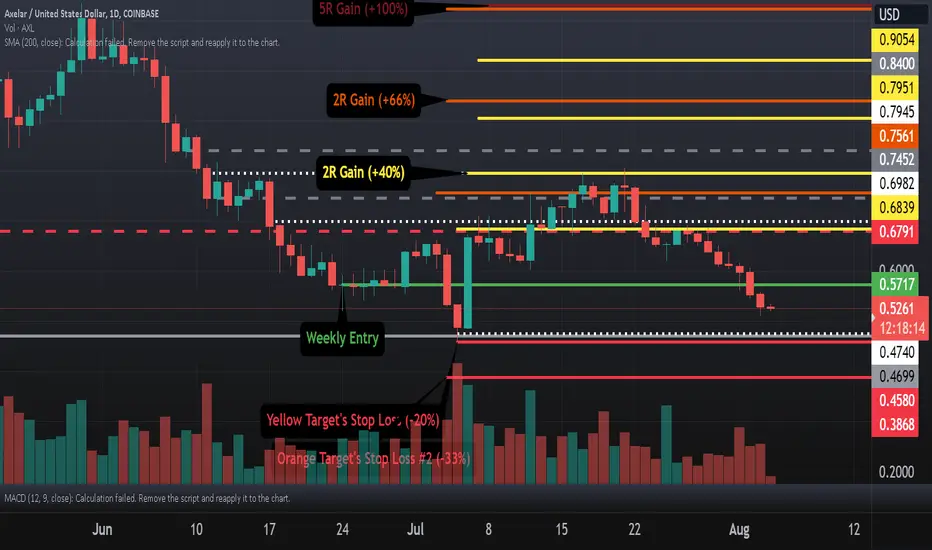
AXL 8R Trade Idea with Entry, Targets, and Stop LossAXL is down from entry and has tagged the previous weekly entry that sent price down 32% and then up 500% (47 cents entry to 32 cents low, and finally a rally to $2.7). Price has retraced this move back to the previous entry of 47 cents AND made another weekly entry at 57 cents.
Targets based on the risk from that entry have been drawn.
Yellow Stop loss of -20% is based on previous lows.
Orange stop loss of -33% is based on how low price went after the previous weekly entry of 48 cents before the rally (-32% from weekly entry)