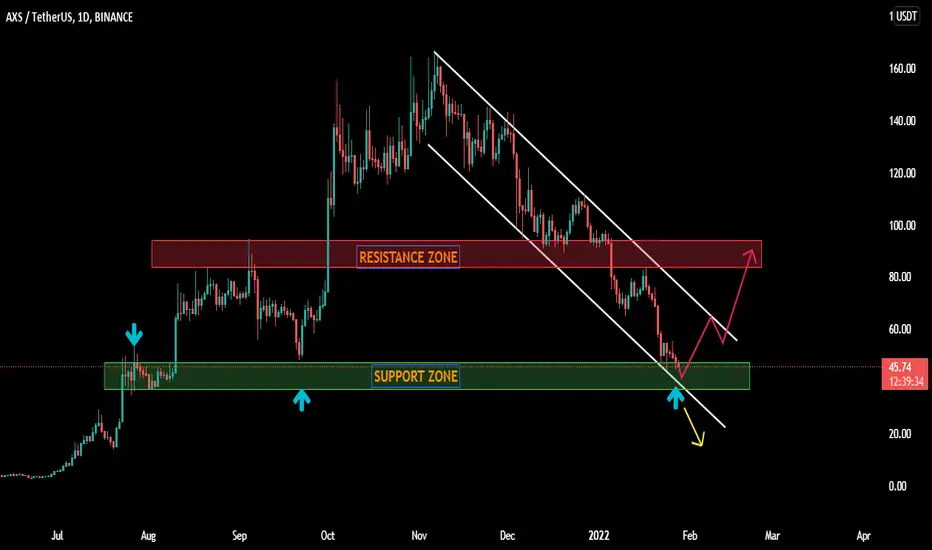
Possible long on AxieWe will likely see the volatility spike on $AXS as it is bouncing off the long-term support level and the major descending trendline is pretty close to the price right now. In case of the breakout through the trendline - bullish movement in expected to continue and reach the resistance level at 112$
AXS
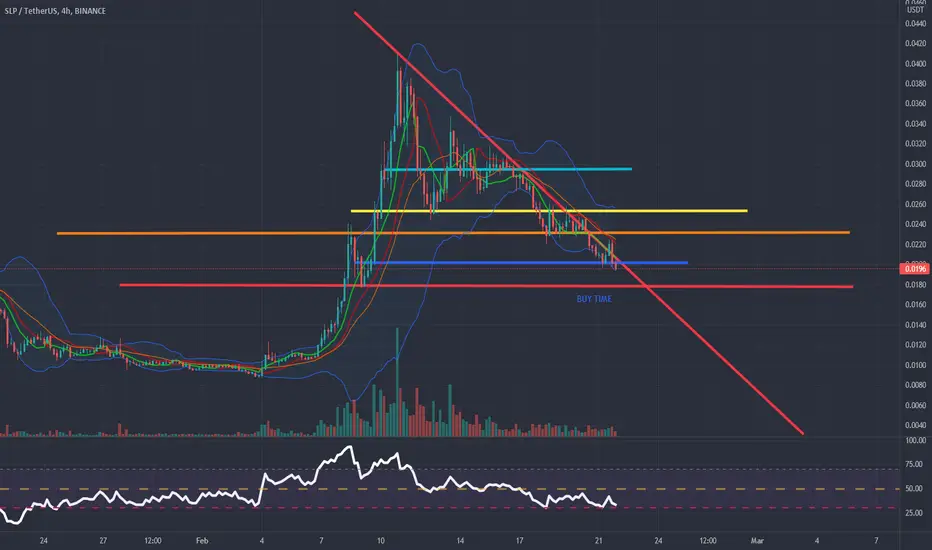
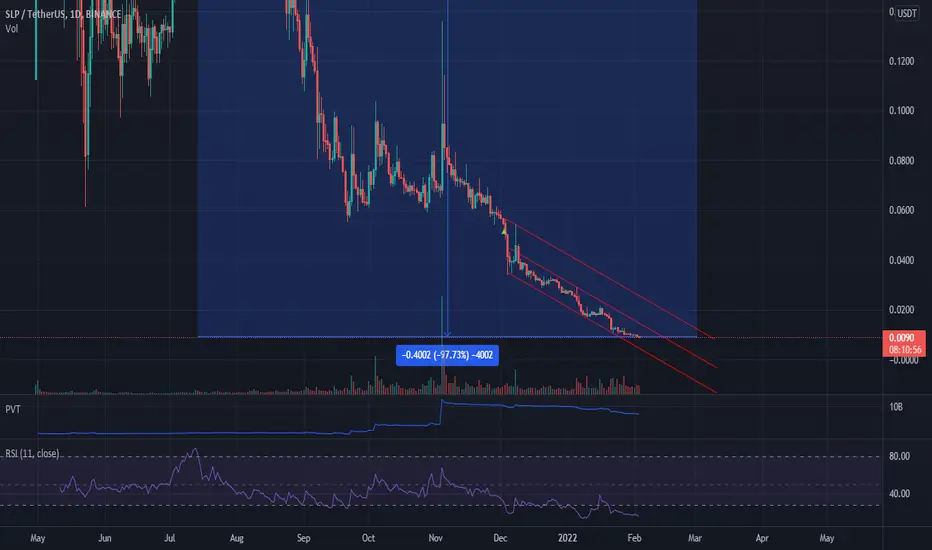
SLP TECHNICAL ANALYSISThis technical analysis is still valid. We will be expecting the slp will hit around .0179 $ :D
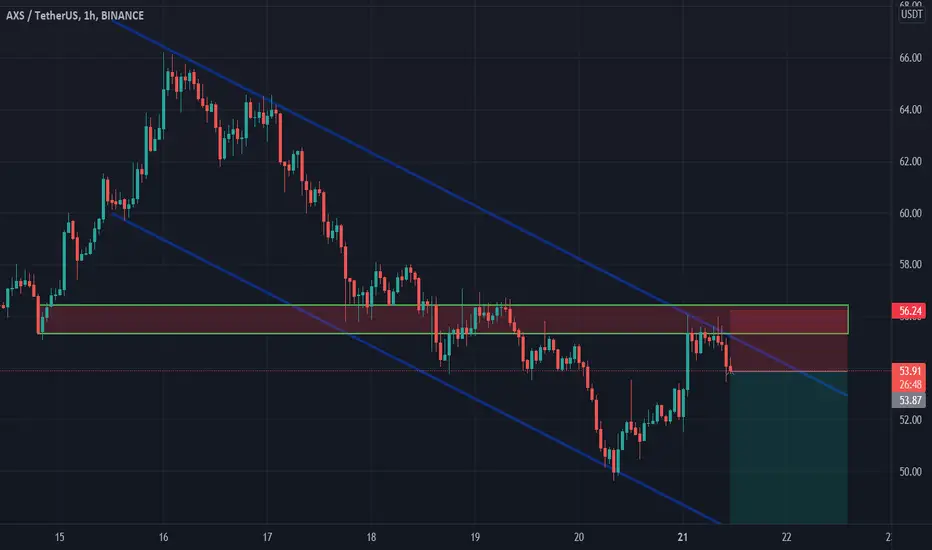
Axie Infinity shortAxie Infinity bounced off the resistance area. Asset bounced off the upper boundary of descending channel. Decline to support level at 47 is expected to happen.
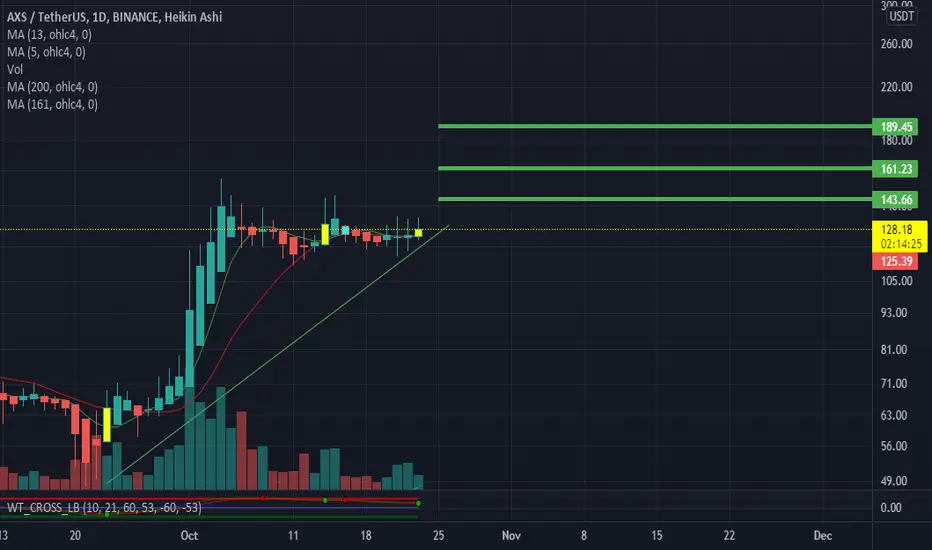
Good Sign For AXS/usdt AXS showing a good u trend with good sign to go Long
Targeting 143 then 161 then 189
stoploss 1 hour close under 111 or breaking out the trend line
goodluck
Axie Infinity shortAxie Infinity bounced off the resistance area. Asset bounced down off the bearish trendline. Decline to support level at 46.15 is expected to happen.

AXS cup & handle targets to 82 for first TPAXS cup & handle targets to 82 for first TP AXS cup & handle targets to 82 for first TP AXS cup & handle targets to 82 for first TP
@micdot7

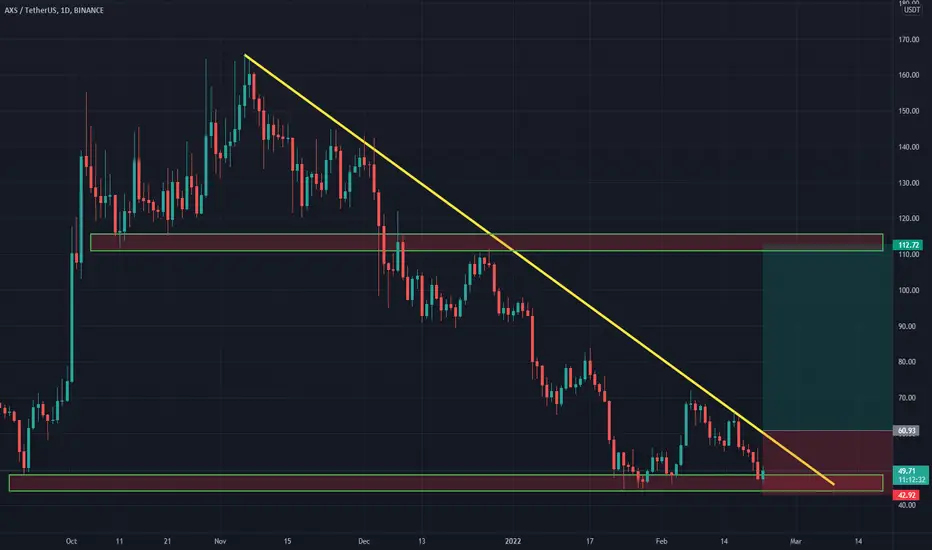
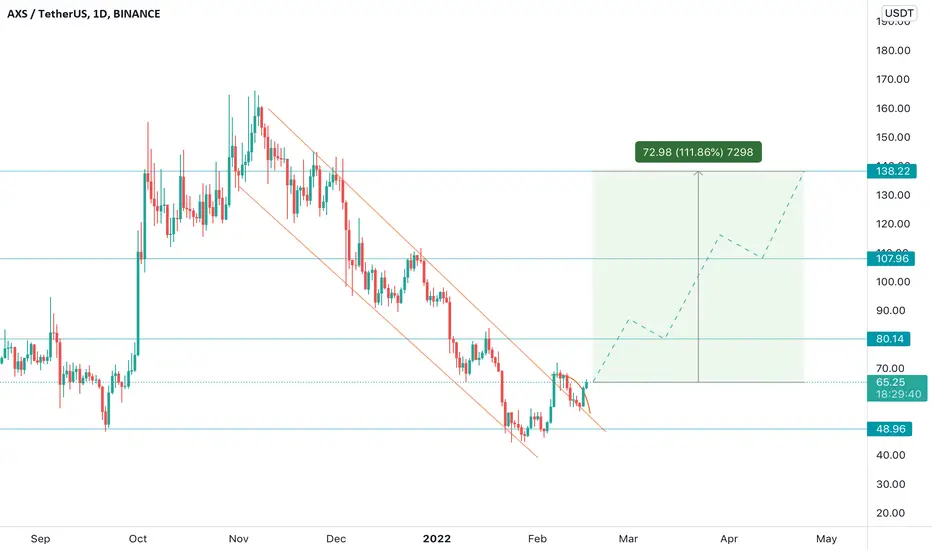
AXS 100% upside potentialAxie Infinity has broken out after a strong mid-term correction. It has an upside potential of 100%. You can start beginning to collect AXS in spot. Always try to buy in parts to Dollar Cost Average.
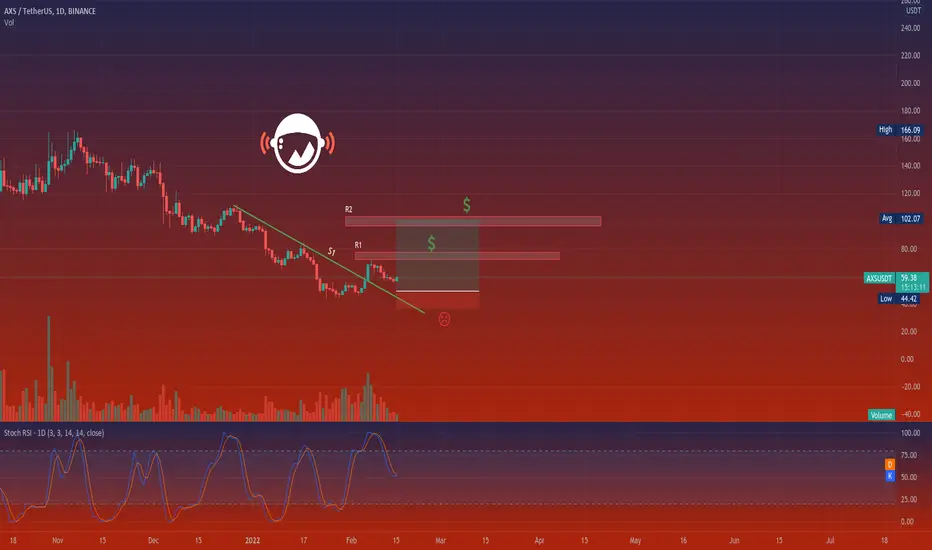
AXSUSDTHello Crypto Lovers,
Mars Signals team wishes you high profits.
We are in the daily time frame. The S1 line which was previously the resistance line is broken. You can set another Buy order at this area and save your profit at the R1 and R2 lines. Always remember to save a certain amount of your profit at one resistance and the rest at the other because the price can hit the first resistance and then fall leaving you in loss. If the price goes lower than the specified area, then there would be more falling.
Warning: This is just a suggestion and we do not guarantee profits. We advise you analyze the chart before opening any position.
Wish you luck
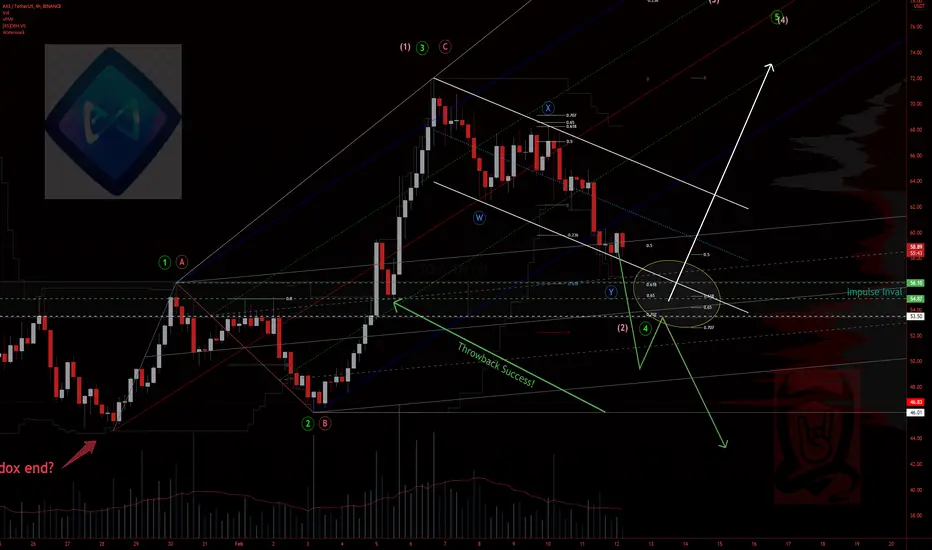
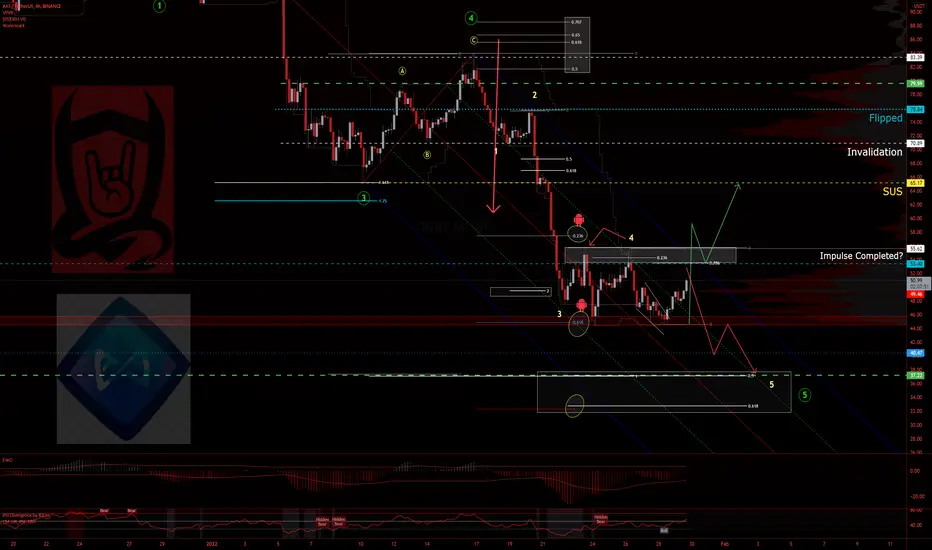
AXS Elliott Wave Analysis : Will the pivot hold?Bullish scenario from last chart played out pretty good.
Looks like there was a pivot put in at that point.
But will it hold?
So a couple things of note for me when I look at this PA stand alone in a bubble.
Currently the PA is nearing an Invalidation area, once it crosses 56.60.
But I still think there is a chance that a motive wave, expanding Diagonal, could still be considered.
Another option still on the table, is a 1,2/1,2.
The 3rd short term bullish option would be that there is a completed ZZ and the move down from 71.78
could be an X wave, but I have not zoomed out to consider the context to see how it could fit.
Holding 46.01 would be a key pivot to hold for these options to stay viable/considered.
The Bearish option is that a ZZ has completed and a new low is possible.
A completed ZZ does not necessarily mean the correction is complete as it could be the gateway to a
larger corrective structure.
If it breaks below 55$, by more than just a wick, and throws back for a retest that could lead to a LL as well.
But for now watching this area.
Already in the algo buy zone, but would be even more interesting if there is one more low to test the support
as well as there is ample other factors to contribute to the confluence, MO.
Algos
Previous Flip
Some Elliott Wave fibs as well.
Staying above 53.50 would be ideal.
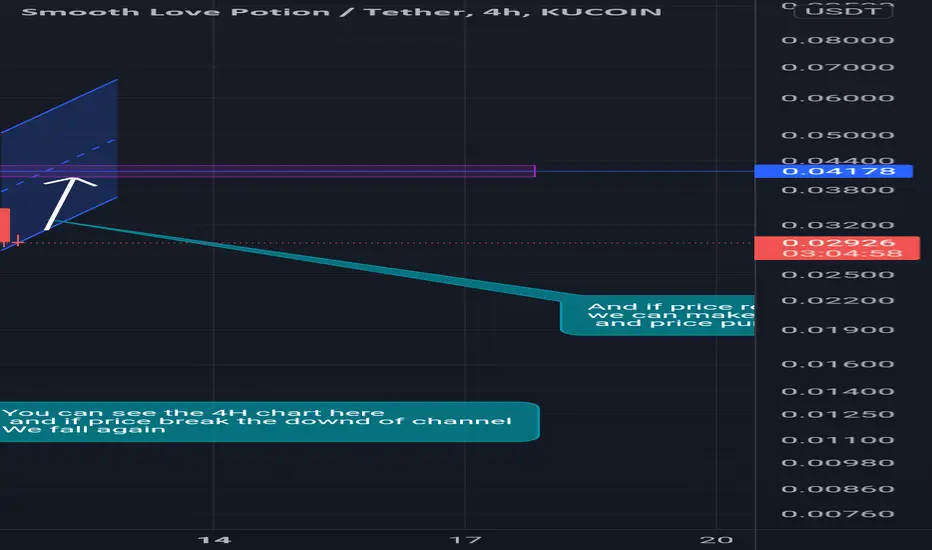
SLP can pump again ?KUCOIN:SLPUSDT
This is not financial advice 🙏🏼👌🏼
Do not forget financial management💸💰💷
Follow us for further analysis😎💞
Please write your comments for us 🤙🏼💬
Please share with your friend 👬👫😍😘
Be always profitable🤑🤩
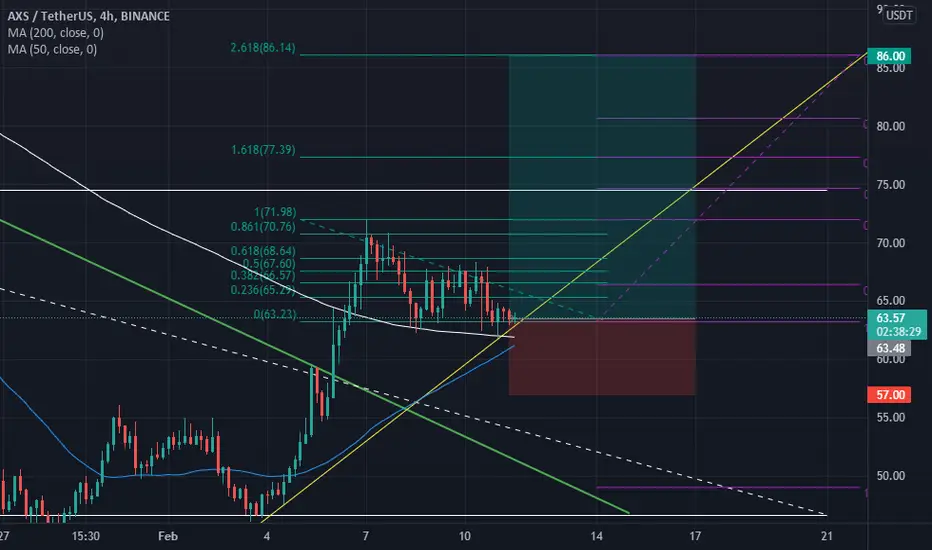
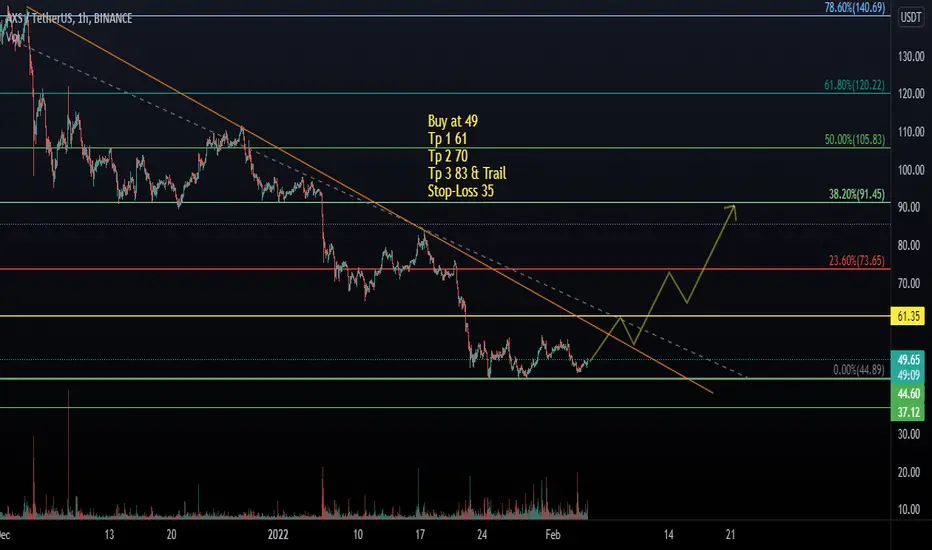
Can AXS surprise us again with pump ?As you can see we can see a GOLDEN CROSS on 4H timeframe .also we have dynamic support after breaking last downtrend . i opened the position at 63 USD . my target is 86 usd at 2.618 fibonaci . also do your researches and set your stop loss.
Axie Infinity (AXS) Buy ZoneAxie Infinity (AXS) Buy Zone
--------------------
BIAS
Mid-Term : Bullish
Risk : Medium
Axie Infinity broke above and retested our trendline, showing the market is short-term gaining bullish momentum and strength. If the retest gets successful, we would be heading to at least target 3 in short-term.
--------------------
$AXS/USDT LONG SETUP
Leverage : x3 - x5
Entry Price : 63 - 67
TP 1 : 69.25
TP 2 : 73
TP 3 : 77.75
TP 4 : 82
TP 5 : 87
TP 6 : 91.5
TP 7 : 97.5
TP 8 : 107
Stop Loss : 56.25
*Maximum 3% of Portfolio.
*Unload 12.5% at each TP. Whenever TP 2 hits, Move stop loss to entry.
--------------------

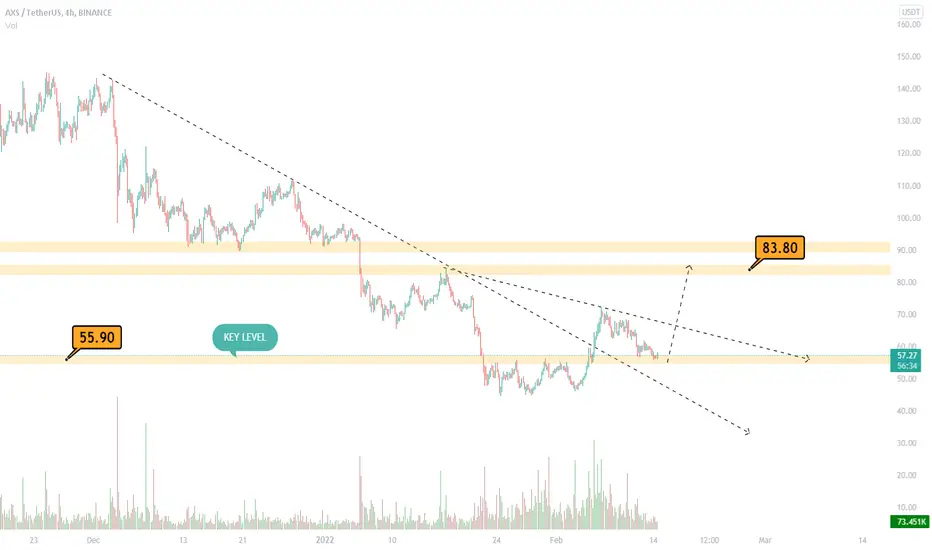
AXSUSDT 1D ; Bullish If Breaking AXSUSDT If the trend line specified in the chart is broken, the price is likely to increase up to the specified points, otherwise it is to fall to support and lower.
@AtonicShark
⚠️ This Analysis will be updated
⚠️ DYOR
SLP trading ideaIt's been probably 1.5 year + since I made trading analysis on $slp $eth trading pair. Now I am back.
SLP is impossible to chart. Why? Because Its highly inflationary and currency is meant to be a reward for $AXS game players. Because of it's super inflationary nature #slp shouldn't be held LONG term
...unless something changes on its fundamental level.
This is trading channel. Could fall to 0.005$ or rise to 0.012 or even above 0.02$ per $slp. Who knows. This shitcoin that shouldn't even be traded on such exchanges as #binance, #bitstamp or any other reputable exchange in fact. It's not fair to noobs (or anyone in that matter). 98% loss within half a year???
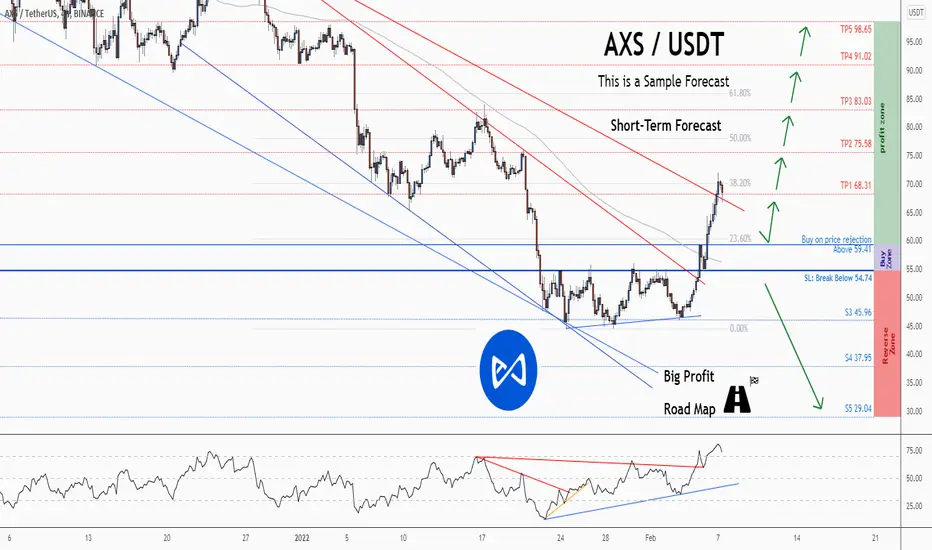
💡Don't miss the great buy opportunity in AXSUSD @AxieInfinityTrading suggestion:
". There is a possibility of temporary retracement to the suggested support line (59.41).
. if so, traders can set orders based on Price Action and expect to reach short-term targets."
Technical analysis:
. AXSUSD is in an uptrend, and the continuation of the uptrend is expected.
. The price is above the 21-Day WEMA, which acts as a dynamic support.
. The RSI is at 73.
Take Profits:
TP1= @ 68.31
TP2= @ 75.58
TP3= @ 83.03
TP4= @ 91.02
TP5= @ 98.65
SL= Break below S2
❤️ If you find this helpful and want more FREE forecasts in TradingView
. . . . . Please show your support back,
. . . . . . . . Hit the 👍 LIKE button,
. . . . . . . . . . Drop some feedback below in the comment!
❤️ Your support is very much 🙏 appreciated!❤️
💎 Want us to help you become a better Forex / Crypto trader?
Now, It's your turn!
Be sure to leave a comment; let us know how you see this opportunity and forecast.
Trade well, ❤️
ForecastCity English Support Team ❤️
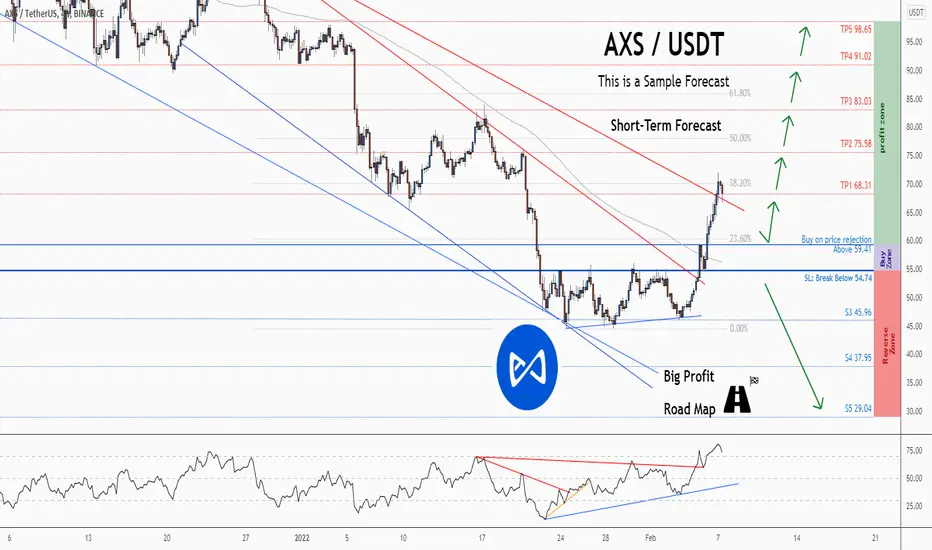
💡Don't miss the great buy opportunity in AXSUSD @AxieInfinityTrading suggestion:
". There is a possibility of temporary retracement to the suggested support line (59.41).
. if so, traders can set orders based on Price Action and expect to reach short-term targets."
Technical analysis:
.AXSUSD is in an uptrend, and the continuation of the uptrend is expected.
. The price is above the 21-Day WEMA, which acts as a dynamic support.
. The RSI is at 73.
Take Profits:
TP1= @ 68.31
TP2= @ 75.58
TP3= @ 83.03
TP4= @ 91.02
TP5= @ 98.65
SL= Break below S2
❤️ If you find this helpful and want more FREE forecasts in TradingView
. . . . . Please show your support back,
. . . . . . . . Hit the 👍 LIKE button,
. . . . . . . . . . Drop some feedback below in the comment!
❤️ Your support is very much 🙏 appreciated! ❤️
💎 Want us to help you become a better Forex / Crypto trader ?
Now, It's your turn !
Be sure to leave a comment; let us know how you see this opportunity and forecast.
Trade well, ❤️
ForecastCity English Support Team ❤️
$AXS, Looks interesting $AXS
Strongest green candle since October
Strongest daily volume since November
UCTS flashing a 1D Buy (prior signals stats at the bottom)
#AXS

Long-Term Picture of Axie InfinityHey there.
Accurate reactions to this channel leads me to believe that Axie Infinity is moving inside these parallel channels. If so, AXS might have started a new move.
Targets? I do hope AXS/USDT returns to upper channel and if that happens, targets like 400 would be in sight. This would of course take quite some time to happen, but short-term targets are exciting as well. Let's discuss those in another post.
Let's discuss what you think about AXS/USDT in comments.
Cheers.

AXS responding to 45$Got the move down I was looking for, and now it reacted to 45$ a couple times here with some interesting Elliott Wave patterns at the end there. BUT I am waiting for a break of the range here with at retest, throw back here.
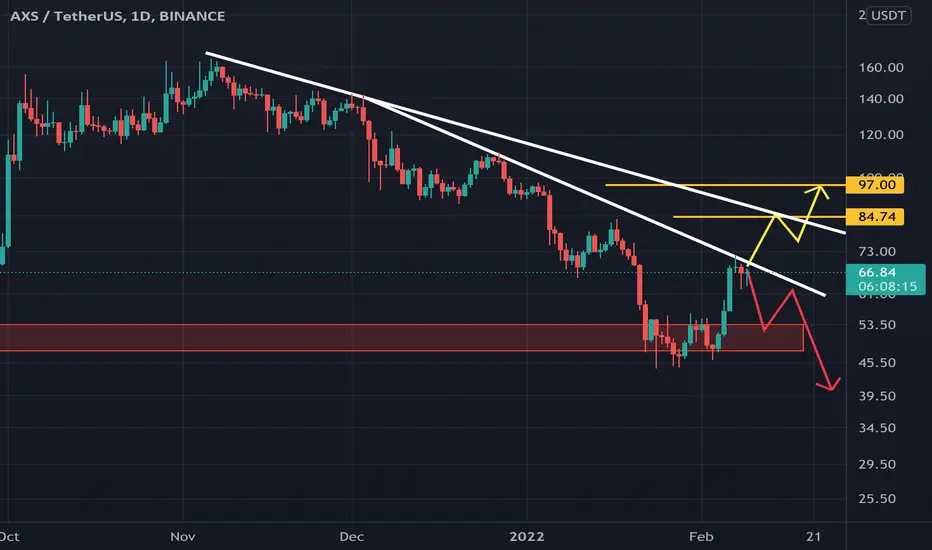
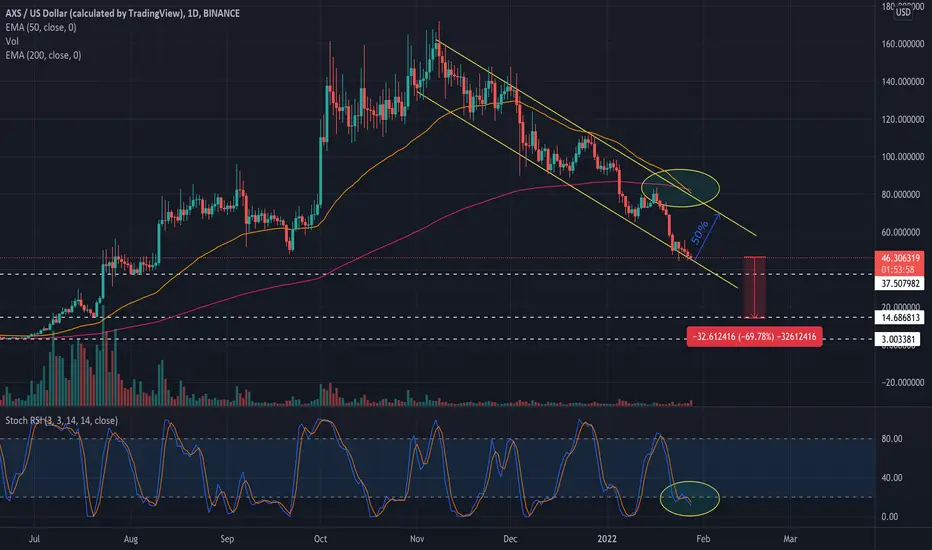
Should you buy Axie Infinity or wait?Hello All. Looking at AXSUSD on the daily timeframe, we see that the price of axie infinity is trading inside a descending wedge/falling channel. This is a bearish pattern and is currently testing the resistance of the channel at $46.
It is important for AXSUSD to find support at this level or it can fall to the next support level which is at $37.
On the daily chart we are also forming a death cross, (50 Ema crossing below 200 Ema) which can push AXSUSD price as low as $20-$14. This is a 70% price drop.
Top of the channel line sits around $70, and if the price reaches this level, this will be a 50% profit from the current price.
This is possible with enough value coming in and since the stochastic rsi is in the oversold territory.
Although, it is less likely that AXSUSD will have a crash to $20-$14, everything is possible if BTCUSD and ETHUSD continue to drop further. (Check out my recent BTCUSD and ETHUSD chart for more information and levels of resistances to keep an eye for).
Thanks for reading, and stay tuned. Enjoy.
AXSUSDT - SETUPAXSUSDT price dropped 70% from its high, moved into a descending parallel channel, and now reached at a strong support zone. This area needs to be honored by bulls. They need to react if they want to reclaim their position back, if they succeed then we can see a good rally towards 60.00