AXS - Axie Infinity is Approaching its Buying ZoneThe Back Ground and Psychological Support Zone
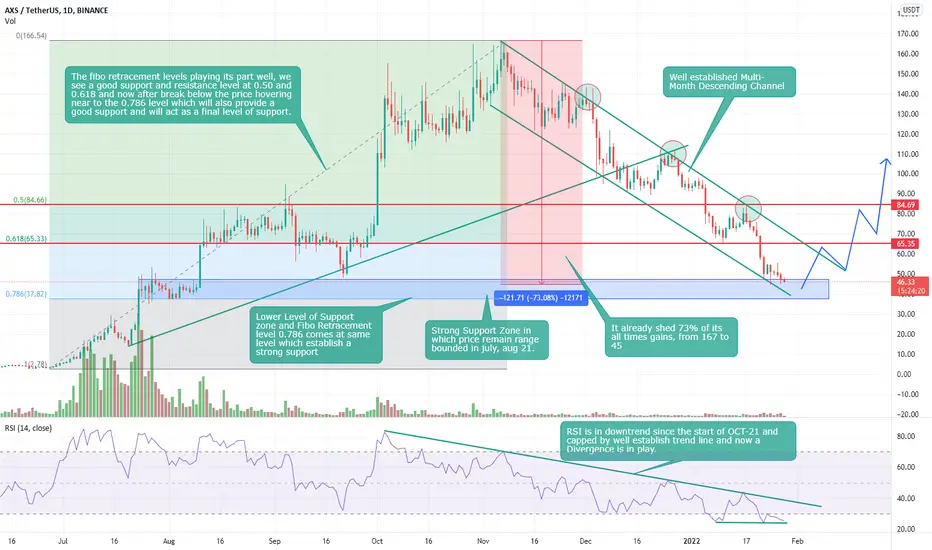
The AXS last bull move gave us hefty returns of 6200%, which started from 2.64$ on Jun 29, 2021, and made an ATH of 167 on Nov 6, 2021. However, this massive gain leads to a correction that later converts to deeper correction and ends in the shape of a crash, and currently, it trades below $50. It shed almost 73% of its gain and trading in a well-established downtrend/descending channel; it got rejected three times from the upper side while trading within this channel. The fibo levels from last bull runs are playing their part. We see 0.50 and 0.786 levels act as barriers but did not last as final lines. Now price is entering into a strong support zone that has its back from the July, Aug 21 trading range when the price remains range-bound after a massive first move. At the same time, RSI has been in the downtrend since the start of Oct 21, capped by a trend line, currently in oversold territory.
Point:
Bullish divergence is in play that will trigger the next bull run.
It entered into a strong support zone.
In the last down move, volume remains below average.
Trading activity/volume increased in the last 4 days.
Fibo retracement 0.786 and support zone lower levels are the same, providing a solid support level that will hold.
It already shed 73% of its all times grains.
RSI is in the oversold zone and showing weak bearish signal
Pay Attention
Observe its price action in the support zone (a rejection from downside with good volume and confirmation on next day), wait for the positive signals from all sides like RSI needs to recover to let the bullish divergence play its part. Moreover, RSI needs to break the trend line, which has been holding in a downtrend since Oct 21. A rejection from downside and RSI trend line break are two key signals you need to get in
Risk / Reward and Holding Period
Buying near the $40 level can be a good idea (or within the support zone). Keep in mind any move below 37 will be short-lived, so if you got an opportunity between 30 to 31 levels, that would be a great level to enter. But chances are rare. The TP1 is 90$, TP2 is its ATH, and the 2022 target is 350$. The minimum holding time for this trade is two quarters.
It is not financial advice; always do your research.
Please, feel free to ask your question; write it in the comments below, and I will answer.
AXS
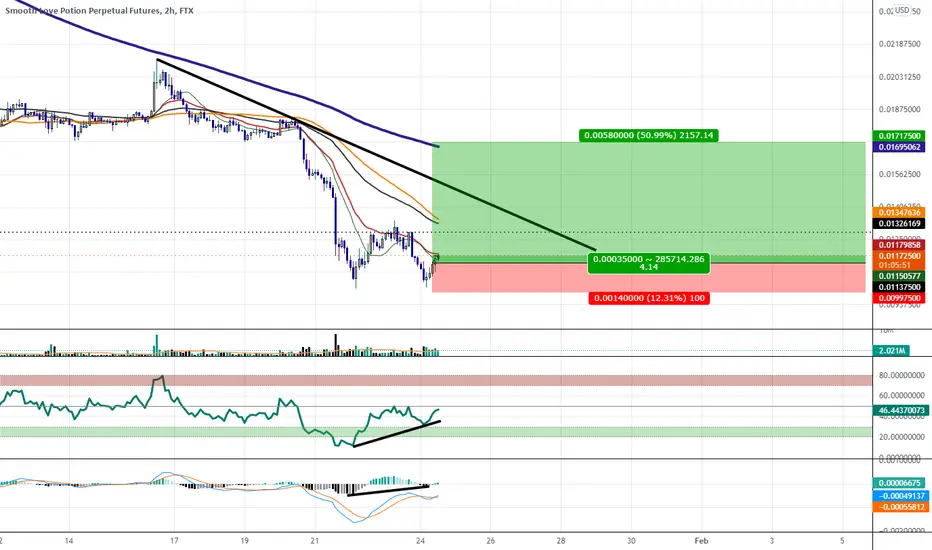
Double Bottom with MACD and RSI Bullish Divergence.I thing this one is gonna go up massively if we are to get a relief rally on BTC.
We have bullish divergence on the 2 hour and are looking to break above the moving averages
it looks promising so long as we hold higher lows.
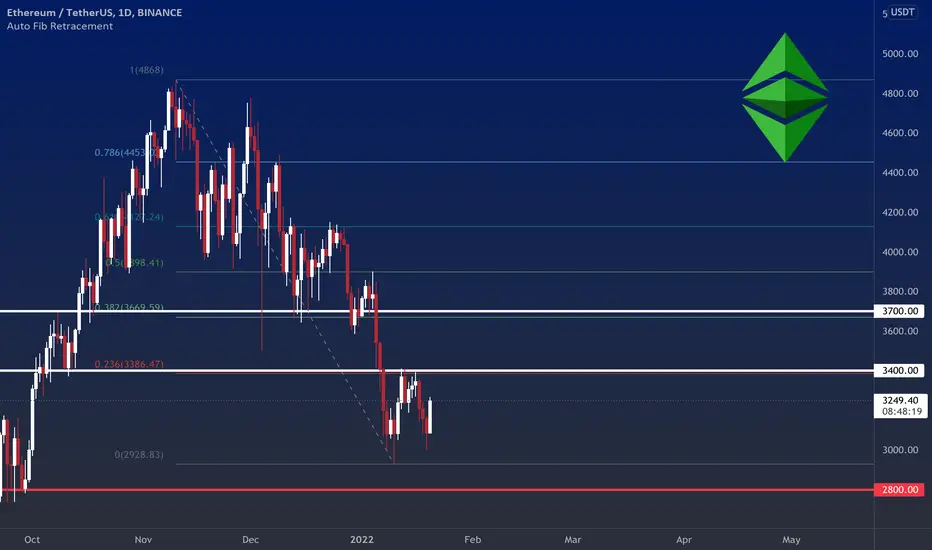
ETHEREUMThe trend is still negative on a daily TF, and we are waiting for the lower levels (the range of $ 2,800). If it can break the resistance of $3,400, it can go up to $3,700 in the short term.
BCMC near to break out or rejection#BCMC/USDT
$BCMC is trading inside falling wedge that price is below upper line, break out from wedge pattern will increase price to resistance zone and target of wedge can be around resistance of $1.37
rejection from upper line will drop price to lower line maybe something above $0

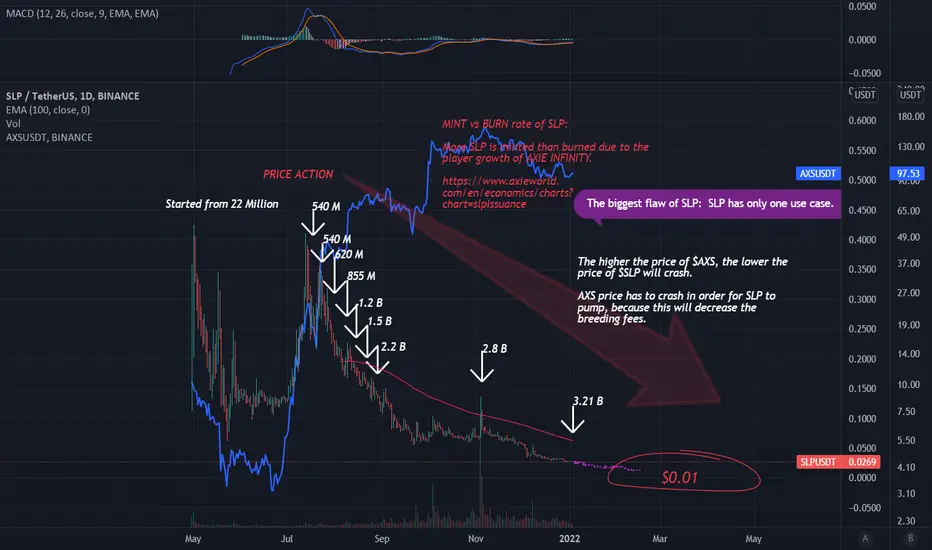
SLP TO 0.01We all know SLP is very inflationary. Check the link on the chart to see the MINT vs BURN chart of SLP.
Massive growth of players = Lower SLP price
Massive growth of players = Higher AXS price.
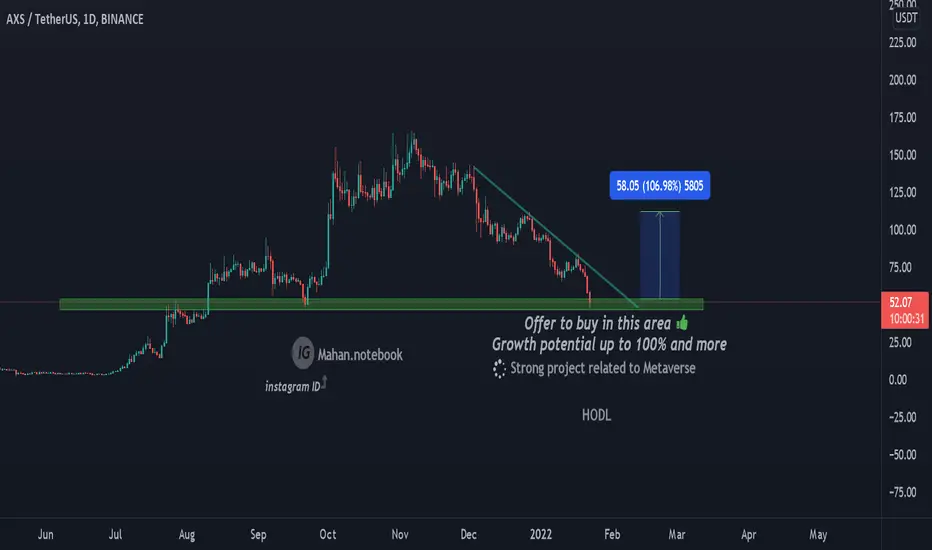
AXSUSDT GOOD PRICE FOR BUY Do not missBINANCE:AXSUSDT
check this analysis and don't miss.
good place for buy and hodl .
Beware of $SLP McDonald's Pattern to 1cent
Classic double top - time to get that McDonald's application ready, players.

AXS - Weekly Outlook ✅Let's see how AXS is behaving.
This is a Weekly chart.
The Fib retracement shows that the price dumped on the support level. The support level might be around the $35-$60 area if the price falls even more.
The market is showing massive STRONG SELL volumes for AXS.
Two resistance levels push down on value, and one support level holds the price high and shows strength. The higher band can work as resistance.
The Middle Bollinger Band can push down the value, and the Lower band pushes the price up.
If the price crosses the local resistance and stays above it for confirmation, we can open our long positions, aim for the next resistance, and use it as a TP point.
The RSI shows that AXS is below the 50 levels, the center.
If you want to know how the RSI indicator works, take a look at this Educational Idea. It'll help you have better readings:
Current Market Price: $64
Let me know your ideas.
Good luck.

AXS - Daily Chart ✅Let's see how AXS is behaving.
This is a 1H chart. (Valid for 24 hours)
The Fib retracement shows that the price has passed a resistance level, and now it's turned into support. Now it's retesting another resistance level.
The market is showing massive BUY volumes for AXS.
Two resistance levels push down on value, and one support level holds the price high and shows strength. The higher band can work as resistance.
The Upper Bollinger Band can push down the value, and the Middle band pushes the price up.
If the price crosses the local resistance and stays above it for confirmation, we can open our long positions, aim for the next resistance, and use it as a TP point.
The RSI shows that AXS is above the 50 levels, the center.
If you want to know how the RSI indicator works, take a look at this Educational Idea. It'll help you have better readings:
Current Market Price: $75.15
Let me know your ideas.
Good luck.

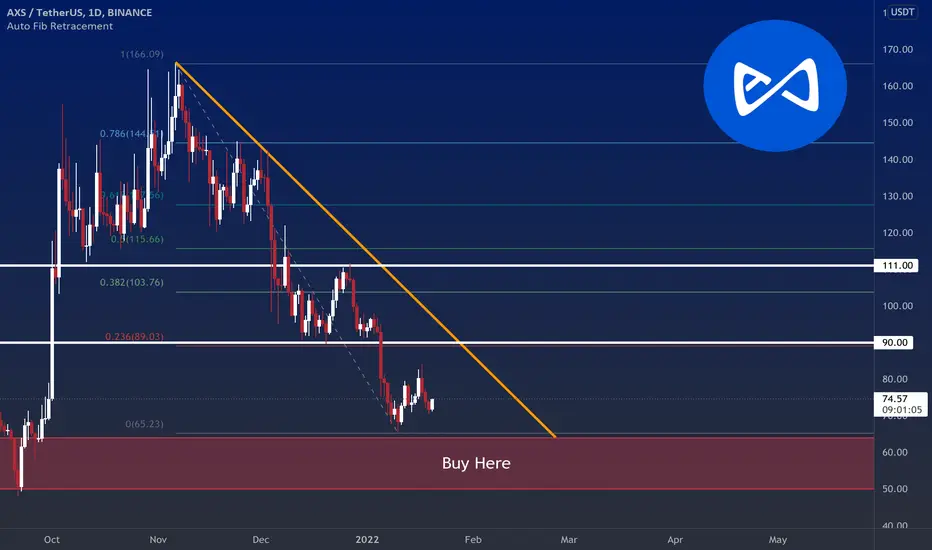
Add some AXS in the $ 50 to $ 64 rangeAXIE INFINITY By breaking its long-term positive trend line has entered further correction and has reached beautiful levels to buy. Add some AXS in the $ 50 to $ 64 range, which are good places to buy for holding. After price flooring, it will start its positive movement compared to other cryptocurrencies.

AXIE INFINITYOn a daily TF, the trend is negative. The $50 - $64 support range is suitable for buying. If the negative trend line and the $90 resistance are broken, the conditions for re-entry will be ready, and the $111 target will be activated.
AXS Long Term ChannelLong term parallel channel of chart is clear enough to show long strategy at the bottom of channel, but the point is that moving upward has not great chances in bearish market so any decision should be taken carefully.

AXS - Daily Chart ✅Let's see how AXS is behaving.
This is a 1H chart. (Valid for 24 hours)
The Fib retracement shows that the price is sitting on the support after corrections.
The market is showing massive SELL volumes for AXS.
Two resistance levels push down on value, and one support level holds the price high and shows strength. The higher band can work as resistance.
The Middle Bollinger Band can push down the value, and the Lower band pushes the price up.
If the price crosses the local resistance and stays above it for confirmation, we can open our long positions, aim for the next resistance, and use it as a TP point.
The RSI shows that AXS is below the 50 levels, the center.
If you want to know how the RSI indicator works, take a look at this Educational Idea. It'll help you have better readings:
Current Market Price: $72.88
Let me know your ideas.
Good luck.

$COTI : What a bullish move! 😍All supports and resistances are marked on the chart. As we can see, the price is in an important range and recommended to keep an eye on it ...
Follow our other analysis & Feel free to ask any questions you have, we are here to help.
⚠️ This Analysis will be updated ...
👤 Arman Shaban : @ArmanShabanTrading
📅 17.Jan.22
⚠️(DYOR)
❤️ If you apperciate my work , Please like and comment , It Keeps me motivated to do better ❤️

AXS Short time frame Posted a shorter time frame analysis else where but, so far the short term bullish played out pretty good. So from here thinking OMLU possible, not exiting all my longs, but from here will be watching for a possible retrace or lower low depending on the context of the move, if down from this area.
Flipped resistance into support
Hit some markers for an impulse up
Some grindage on the Pitchfork
Bounced from the .5-.615, got to target
AXS - Daily Chart ✅Let's see how AXS is behaving.
This is a 1H chart. (Valid for 24 hours)
The Fib retracement shows that the price is pumping and, we might experience rejections soon.
The market is showing SELL volumes for AXS.
Two resistance levels push down on value, and two support levels hold the price high and show strength. The higher band can work as resistance.
The Upper Bollinger Band can push down the value, and the Middle band pushes the price up.
If the price crosses the local resistance and stays above it for confirmation, we can open our long positions, aim for the next resistance, and use it as a TP point.
The RSI shows that AXS is below the 50 levels, the center. It's highly oversold.
If you want to know how the RSI indicator works, take a look at this Educational Idea. It'll help you have better readings:
Current Market Price: $80.78
Let me know your ideas.
Good luck.

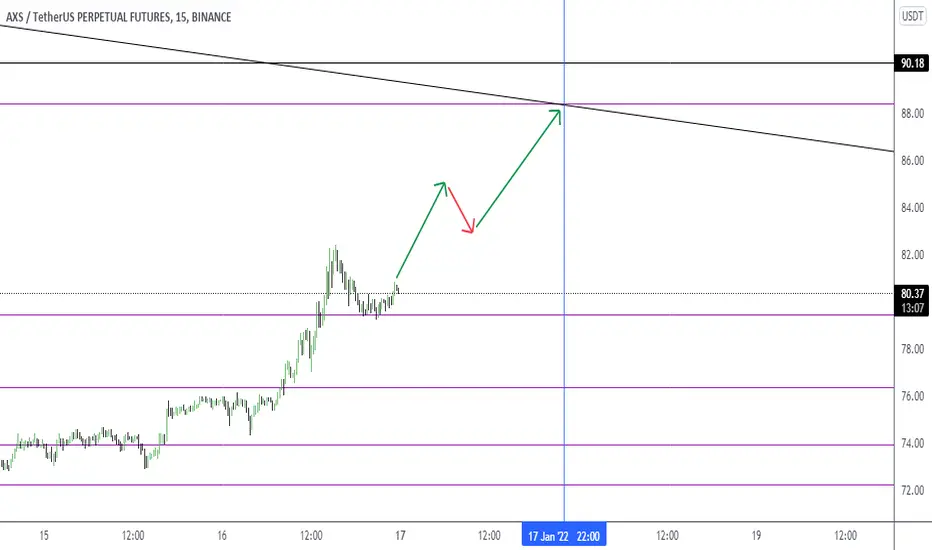
Axsusdt cup and handle Retest done bullish AXSUSDT (4h Chart) Technical analysis
AXSUSDT (4h Chart) Currently trading at $80
Buy level: Above $81 (BUY AFTER BREAKOUT)
Stop loss: Below $71
TP1: $84
TP2: $89
TP3: $94
TP4: $100
Max Leverage 3x
Always keep Stop loss
Not A financial Adviceeeeeeeeeeeeeeeeeeeeeeeeeeeeee be carefull
Follow Our Tradingview Account for More Technical Analysis Updates, | Like, Share and Comment Your thoughts.

AXSUSDT - Cup and Handle PatternAXSUSDT (4h Chart) Technical analysis
AXSUSDT (4h Chart) Currently trading at $78.9
Buy level: Above $79.6 (BUY AFTER BREAKOUT)
Stop loss: Below $71
TP1: $84
TP2: $89
TP3: $94
TP4: $100
Max Leverage 3x
Always keep Stop loss
Follow Our Tradingview Account for More Technical Analysis Updates, | Like, Share and Comment Your thoughts.

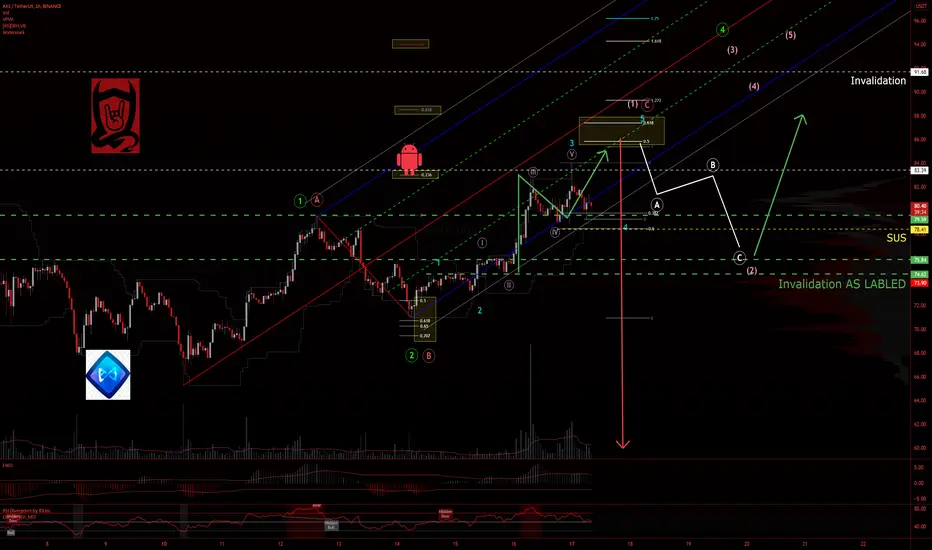
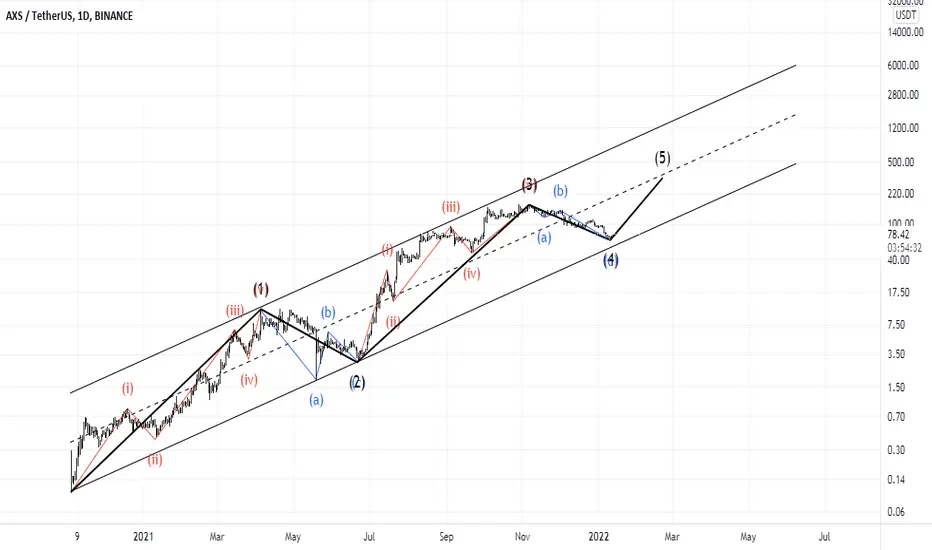
AXS retracing excess? One Elliott Wave count im keeping an eye on. TLDR: Want to see these previous resistance lines be breached and flipped into support before getting too excited for a bounce up. But have been short from the top so may be a bit biased. The Elliott Wave pattern just doesnt look complete. But I am fickle and can be swayed easily by the PA. And AXS can always do AXS things... like in the good ole days..
AXSUSD within its Buy Zone flashing the same signal as JuneAxie Infinity has been on a long-term Fibonacci Channel Up ever since its first trading day in November 2020. As you see, it has two clear pressure zones, a Buy Band (green) and a Sell Band (red). Those have never failed to give clear buy/ sell signals.
What has been an even stronger buy signal though than AXSUSD trading within its Buy Zone alone, is that when it also breaks below the 1D MA200 (orange trend-line), it tends to bottom out and start a strong rally to the top of the Channel Up. That's what took place in late June 2021. With the Ichimoku Cloud also flashing a buy signal, AXS is possible to soon start a strong rally first towards $220.00 and then $500.00.
--------------------------------------------------------------------------------------------------------
** Please support this idea with your likes and comments, it is the best way to keep it relevant and support me. **
--------------------------------------------------------------------------------------------------------

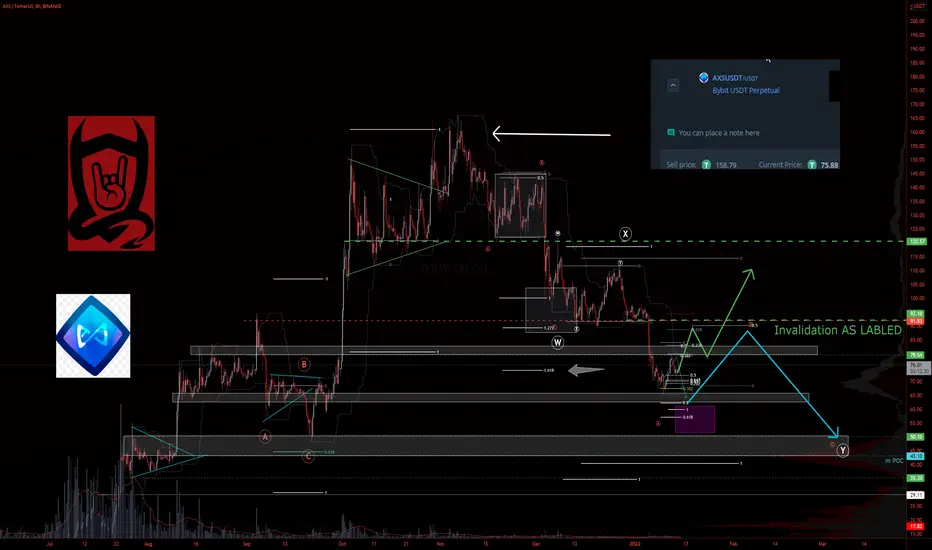
AXS/USDTHello''' According to previous analysis, we have reached the Elliott 4 wave and according to our expectations and analysis, it will be a good area to buy. If the downtrend continues, most of the uptrend channel floor is a good area to buy.This is not a financial recommendation
AXS/PERP 12H TA decending channelAXS/PERP has been in this decending channelfor a while. we just arrived at a important accumulation zone.
a good moment to buy some AXS here imo.
