BITCOIN [ BTC ] - BULLISH Breakout Pattern Forming... Bitcoin is still trending up. It bottomed out in the summer. It has been trending up with HIGHER LOWS since that time. The most previous LOW was in late September. The current LOW is now in December. Every time we've gotten to these new LOWS, Bitcoin creates a FALLING WEDGE pattern with a breakout before the next leg up.
When Bitcoin broke out of it's FALLING WEDGE in late July, it had a RE-TEST in August before it took off. During the late September FALLING WEDGE breakout, there was no RE-TEST. However, with this current FALLING WEDGE breakout that we just had, we are getting a RE-TEST, similar to what we saw in September. As long as we hold above this RE-TEST area, this should be the beginning of the next big leg up in Bitcoin. This looks like it will carry on into Q1 and maybe even Q2 of 2022.
AXS

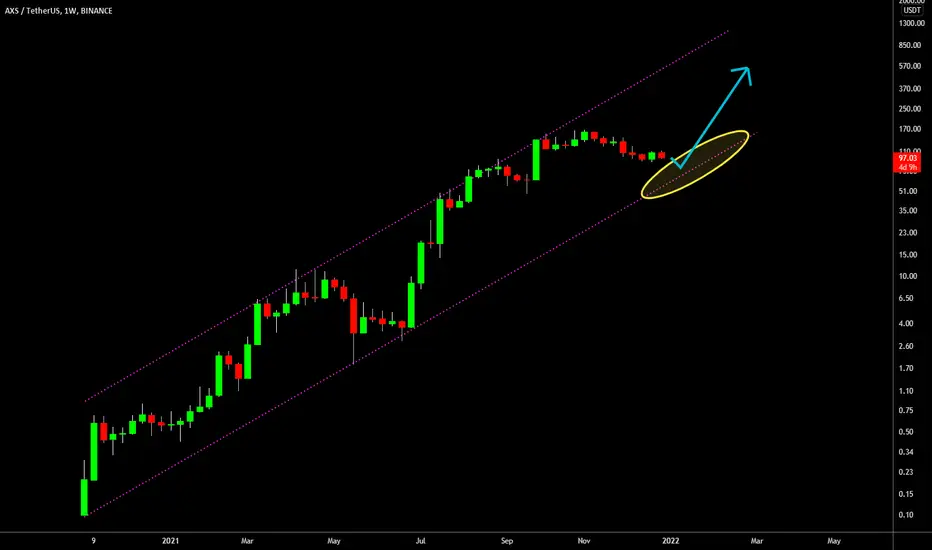
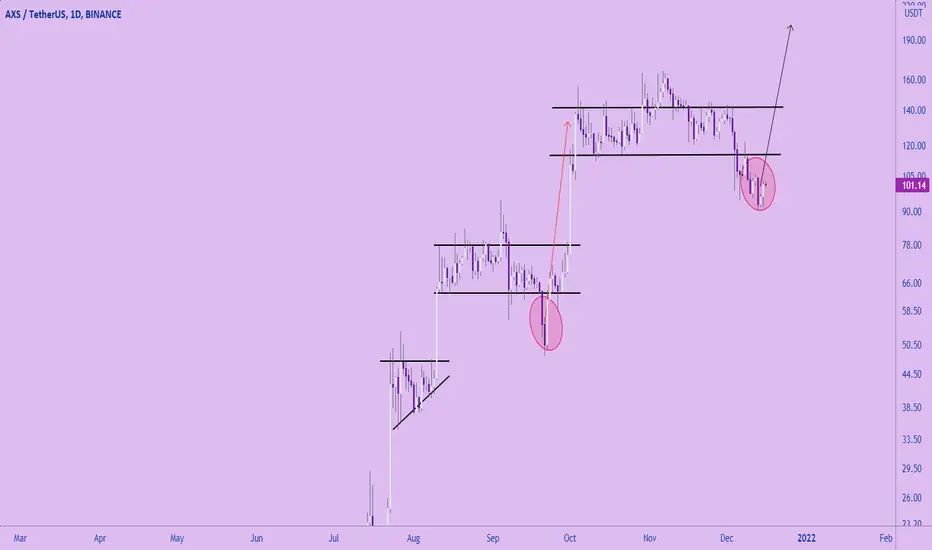
🔥 AXS Macro Bullish ChannelSince it's inception on Binance, AXS has been trading in a strong up-trending bullish triangle.
However, AXS is losing value almost weekly since late October. It doesn't seem that the bears are done selling yet, so I'd wait until the price reaches the yellow area on the chart for a potential long-entry.
Target would, ideally, be the top of the channel. However, since AXS is one of the top-performers of the bull-run it might be the case that we're not going to see another ATH again this bull-run.
Happy trading!
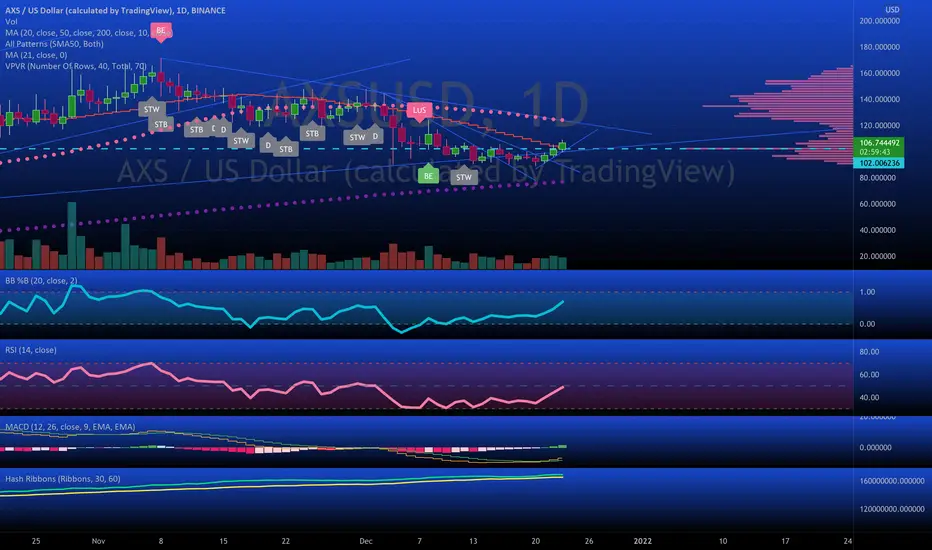
AXSUSDT Daily TA : 12.28.21 : $AXSAll supports and resistances are marked on the chart. As we can see, the price is in an important range and recommended to keep an eye on it ... #Requested_Analysis
Follow our other analysis & Feel free to ask any questions you have, we are here to help.
⚠️ This Analysis will be updated ...
👤 Arman Shaban : @ArmanShabanTrading
📅 28.DEC.2021
⚠️(DYOR)
❤️ If you apperciate my work , Please like and comment , It Keeps me motivated to do better ❤️

AXS/USDT - Potential 78% SetupHello Traders!
AXS continues within the uptrend.
The asset made a correction to the level of 0.618 by Fibonacci and found support near the price level of $92.50
To reduce the risk in case of a pullback, it is better to split the entry into two parts:
$100,00 - $104,50
$82,50 - $88,00
Stop-loss shall be placed under the price of $69.00
The targets would be levels of $150,00 and $165,00
Good luck and watch out for the market
P.S. This is an educational analysis that shall not be considered financial advice

AXS to infinityAnd beyond.
Solid fundamentals + tokenomics + technicals - AXS is one of the best swing trades in town rn.
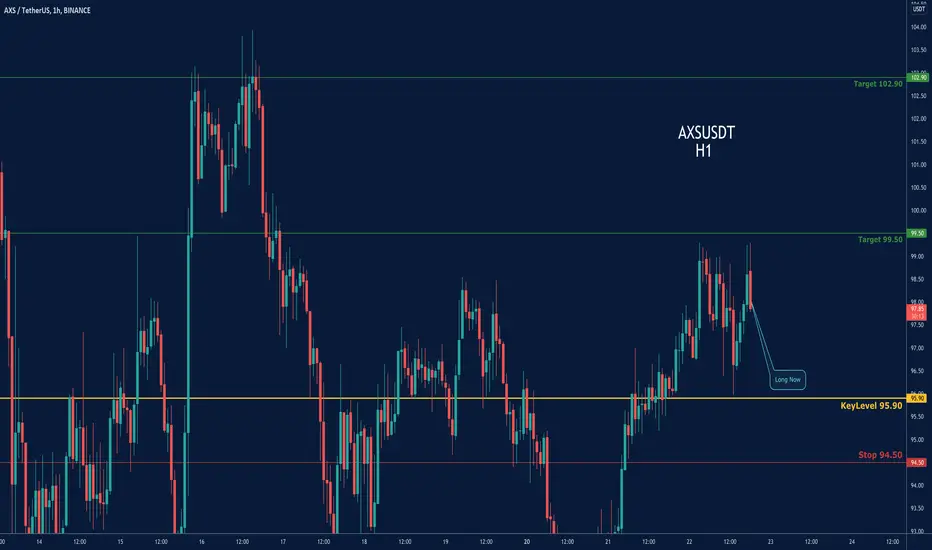
AXSUSDT-LONGThere is a long position in AXSUSDT Axie Infinity
AXSUSDT Axie Infinity
🔵Long Now or set on Key Level 95.90
🟢Target 1 99.50
🟢Target 2 102.90
❌Stop loss 94.50
#K_Level
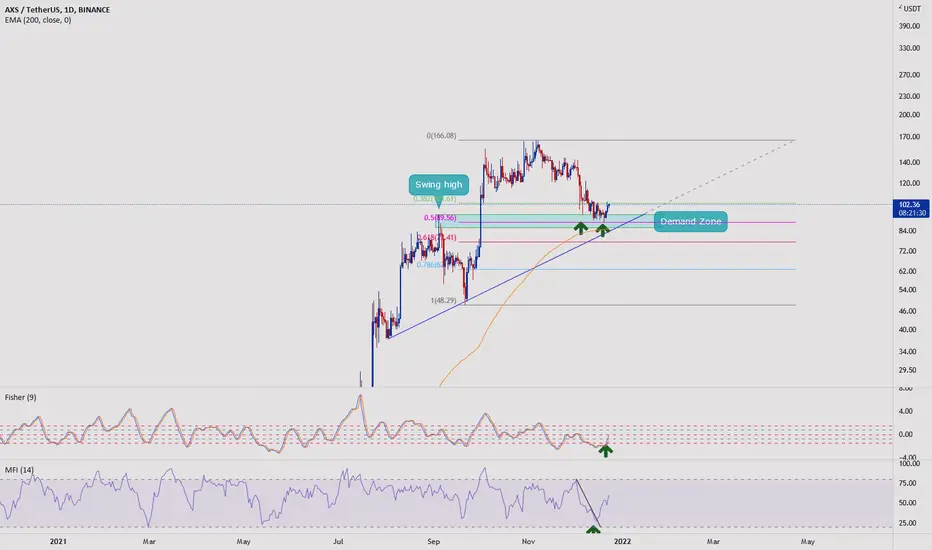
AXS Bullish RUN!!!ASX/USDT Started its bullish run to the upside!
Downtrend momentum is weak.
Its on strong demand zone and it has good supprt of EMA200.
Its on 0.5 Fibbo Retracement lvl.
MFI shows that money is coming in.
Entry: 100-105
Targets:
1) 120
2) 138
3) 150
4) 166
5) 180
6) 205
Another bull run ?AXS is potentially nice for a new bull run.
I'm investing in a new MetaVerse project called Meta Cars Land, check it if you're interested: metacarsland.com

AXS, SHORT POSITION...Market is down!!!
Attention: Bitcoin is in sensitive situation. Manage your risk...
-Thanks-

Bitcoin [BTC] - BULLISH Signals. Breakout coming... We have a lot of confluence on Bitcoin currently. Staying above the Yearly VWAP nicely + Divergence on the RSI + Falling Wedge pattern. The FED meeting and Quadruple Witching on Thursday and Friday were the two last days that a threat of another drop was possible.
Bitcoin survived both of these events and held the support very nicely here. This was a very bullish sign. Now we just await the inevitable boom! Hopefully before the end of year. Hopefully this week. However, we can't time the market. It would be wise to accumulate more on alts while prices are cheap here.

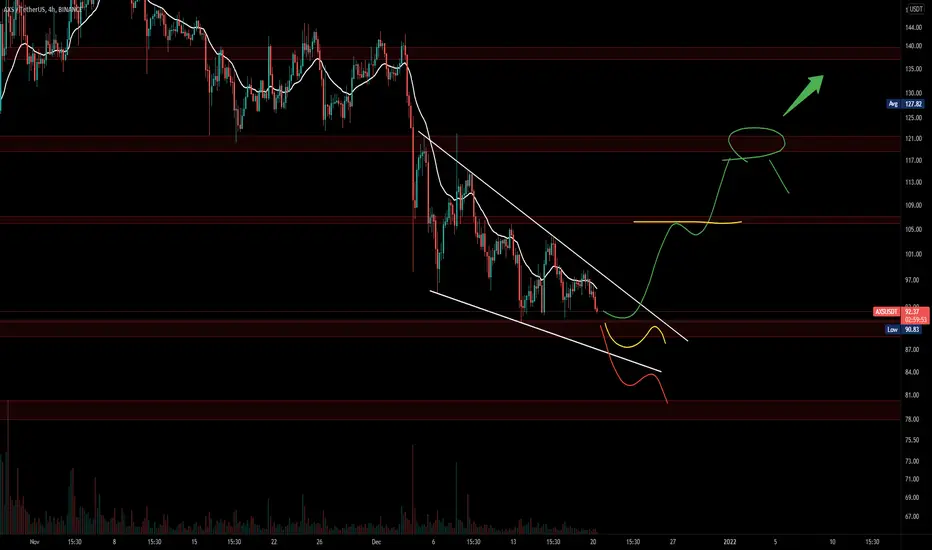
AXSUSDt 4H Hi everyone
Possible paths of AXIE Infinity price movement and support and resistance levels
Good luck
AXS at supportAXS is lying on some nice support and looks to be ready to turn things back around. We'll see if support holds and this thing can challenge the downtrend and then try for some new ATH.
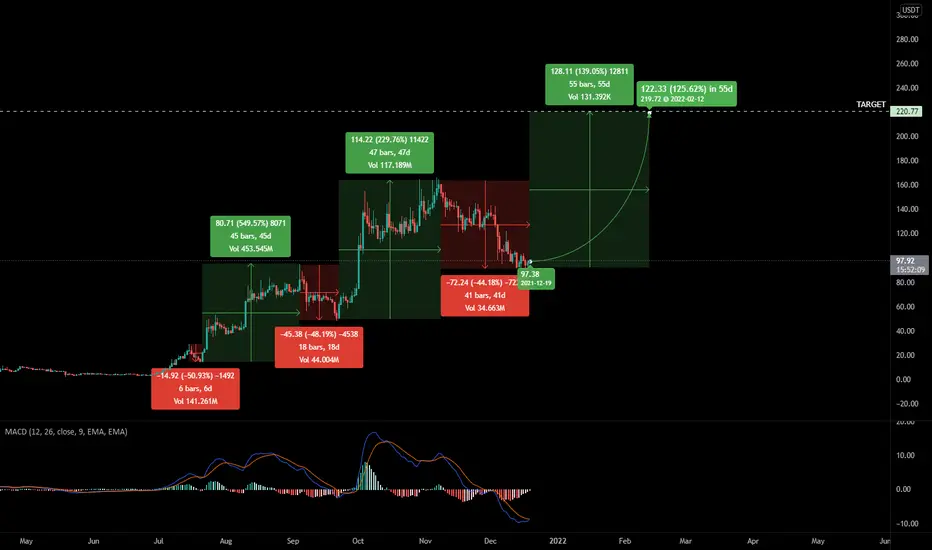
AXS Price Target - $220Hey,
This is my price prediction for AXS once this bear market is done.
I am expecting it to reach $220, currently as of today, it's at $98.
Let's see how it plays off.
AXSAXS is a gaming token. These are the support and resistances which we will face to get our target, these key levels are also Fibonacci Retracement Levels

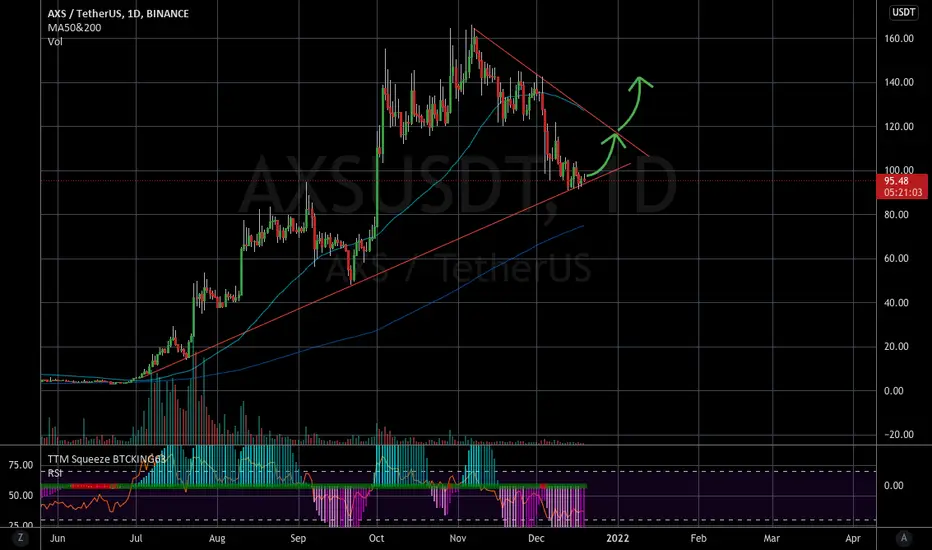
AXS bullishWell reset - rather pretty oversold technicals.
Raging fundamentals.
Huge user base & growing.
112% staking APR
Axie looks like a catch around these levels.

AXS - Do not miss itIf AXS could maintain its trend line and support during the bitcoin fall, it will be Bullish and the first target is $118 (then $140)
Due to the last few candles in 2D timeframe and The RSI positive divergence, That bullish scenario has a good chance
Anyway, so far AXS has climbed a lot and Bitcoin isn't stable and may drop to 42K. It's better to consider these points (before buying)
Dear Friends, It would be nice to show your support by liking and maybe posting your comment
Good Time

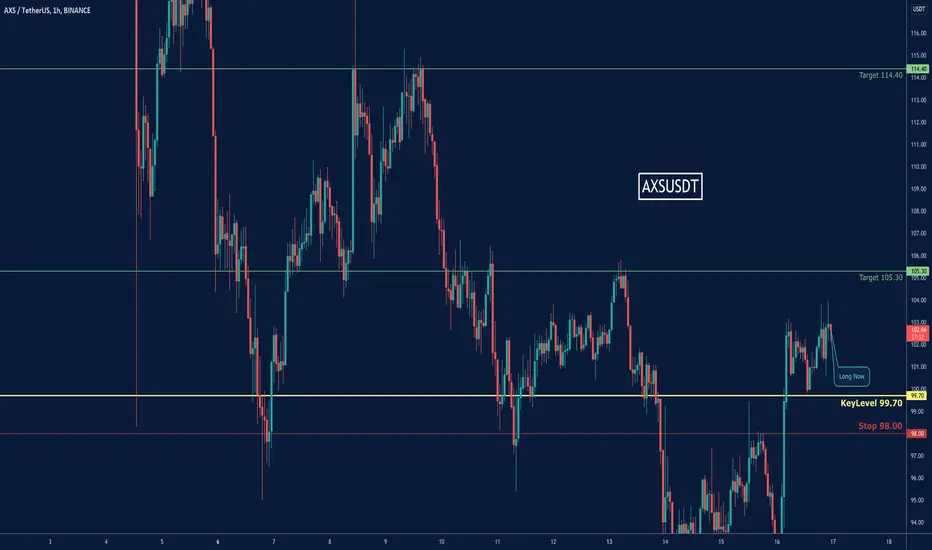
AXSUSDT-LONGThere is a long position in AXSUSDT Axie Infinity
AXSUSDT Axie Infinity
🔵Long Now or set on Key Level 99.70
🟢Target 1 105.30
🟢Target 2 114.40
❌Stop loss 98.00
#K_Level
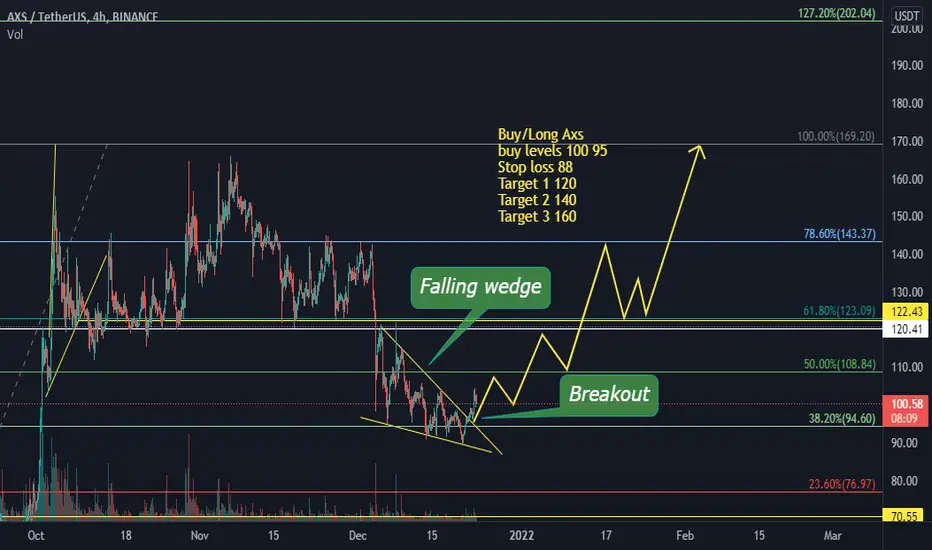
AXS Falling Wedge / Bull Breakout / H4Falling wedges haver 75% chance of bull BO.
AXS had higher low double bottom near the WG extreme.
Then you see that this H4 falling wedge got broken upside.
In this situations I wait to see if trend extreme get tested again and get long on AXSUSDT.
Potential Target is marked up, $120-$122.5
**This is not an investment advice. Your capital might be at risk.**
Give me your idea on comments...
Good Luck...

AXS The price is never too highAXS has come a long way and now it needs to "cool down" a little, after which it will go up again or has all the hype already passed? Time will tell!

There may be a pullback. Judging by the previous signals, it worked fine. At the same time, our trend and support lines and how far the price can be drawn are indicated. It is not investment advice. These are my notes to myself.

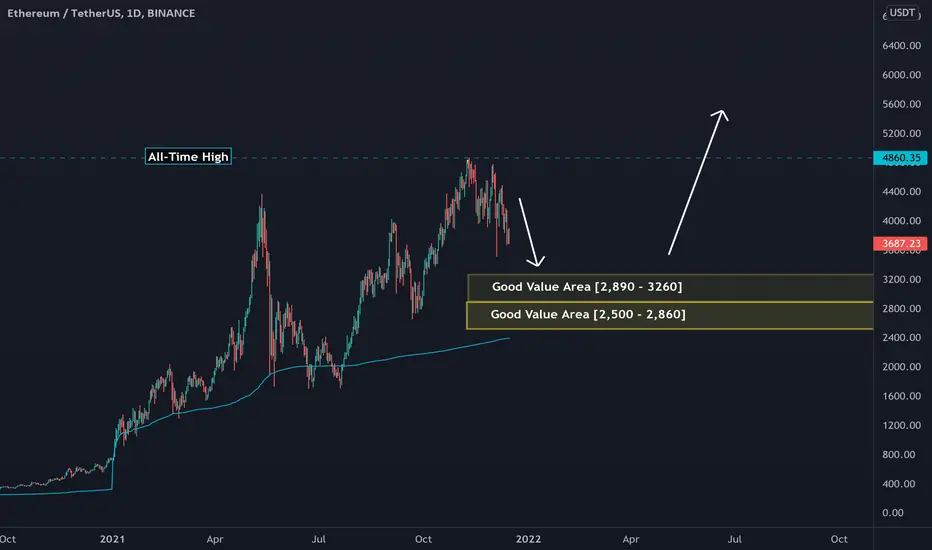
ETHEREUM [ ETH ] - Value Areas (FOMC + possible Whale dump)I'm removing my BULL shades and BULLISH bias for a moment to consider that possibility that ETH may fall further. After the FOMC announcements today, if it's bad news, I can see Whales taking advantage of it by doing one final dump on Bitcoin and Ethereum. If this were to happen, I see these value areas on Ethereum. If there is no reaction, however, then it should be business as usually and we go sideways or up here on Ethereum.