AXS needs restAXS does not seem to have enough power to break the resistance.
What is clear is that Axie Infinity has a good future
So there will be 2 scenarios that I vote for to buy at a lower price!
Also There are now other assets that have more bullish power or have been in the accumulation zone until now.
AXSUSD

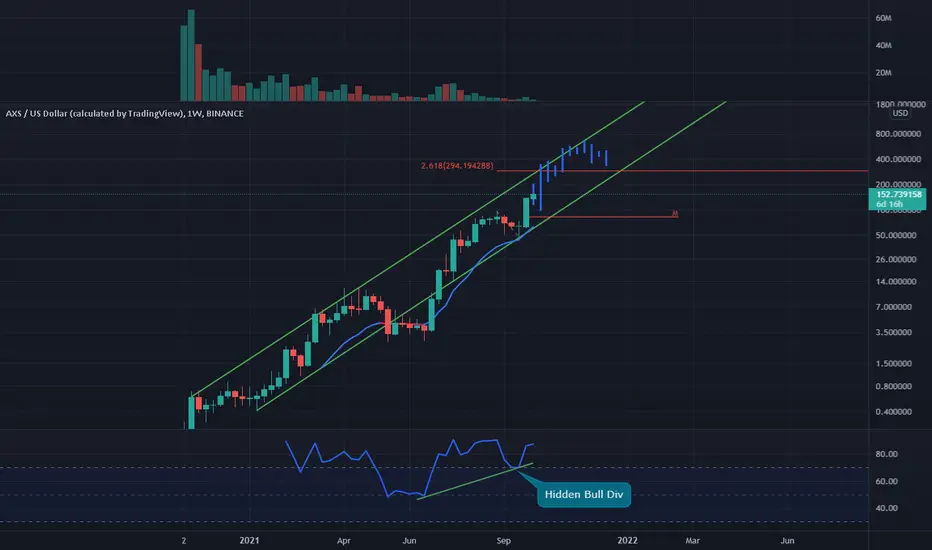
AXSUSD H16: +200% gains BULLS THE BEST level TO BUY/HOLD(SL/TP)Why get subbed to me on Tradingview?
-TOP author on TradingView
-2000+ ideas published
-15+ years experience in markets
-Professional chart break downs
-Supply/Demand Zones
-TD9 counts / combo review
-Key S/R levels
-No junk on my charts
-Frequent updates
-Covering FX/crypto/US stocks
-before/after analysis
-24/7 uptime so constant updates
🎁Please hit the like button and
🎁Leave a comment to support our team!
AXSUSD H16: +200% gains BULLS THE BEST level TO BUY/HOLD(SL/TP)(NEW)
IMPORTANT NOTE: speculative setup. do your own
due dill. use STOP LOSS. don't overleverage.
READ ENTIRE IDEA BEFORE EXECUTION!
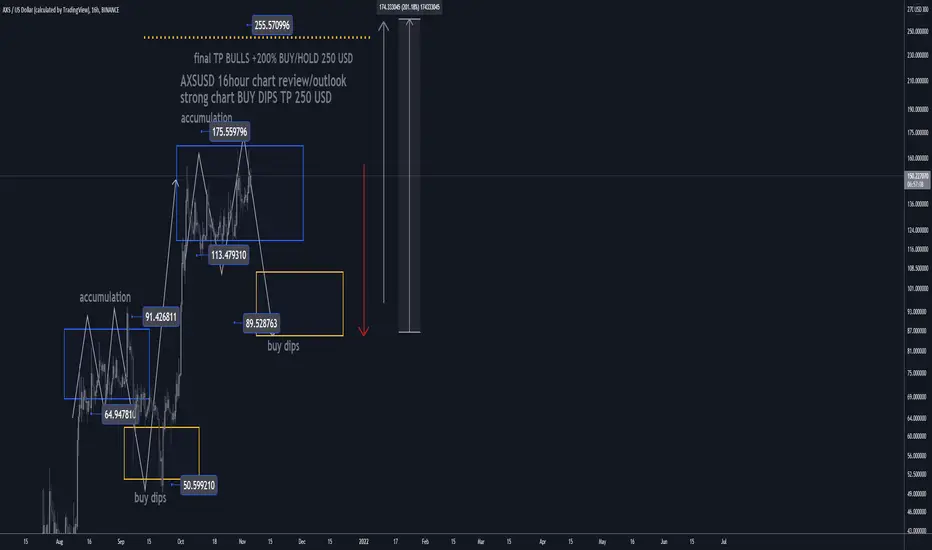
🔸 Summary and potential trade setup
::: AXSUSD H16/candle chart review
::: corrective cycle in progress no
::: spec accumulation / BUY DIPS setup
::: same structure MAY repeat soon
::: setup still valid as of RIGHT NOW
::: chart is LOG SCALE
::: get ready to BUY LOW later
::: currently/soon CORRECTION MODE
::: BUY LOW after 30% correction
::: entry - late Nov 2021
::: for now PULLBACK/CORRECTION MODE
::: on the right same a/b/c/d/e fractal
::: August/September fractal from the past
::: resulted in 300% gains off the low
::: re-test of range lows is likely
::: point d is BEAR TRAP (fake breakdown)
::: SPECULATIVE SETUP
::: do your own due dill
::: and use proper risk management
::: TP bulls is +200% gains
::: details: see chart
::: FINAL TP is +200% gains
::: recommended strategy: BUY/HOLD after correction
::: TP BULLS +200% gains 250 USD
::: SWING TRADE: BUY/HOLD IT
::: bull run not over yet
::: good luck traders!
::: BUY/HOLD and get paid. period.
🔸 Supply/Demand Zones
::: N/A
::: N/A
🔸 Other noteworthy technicals/fundies
::: TD9 /Combo update: N/A
::: Sentiment mid-term: BULLS/200% gains
::: Sentiment short-term: CORRECTION/MODE
RISK DISCLAIMER:
Trading Crypto, Futures , Forex, CFDs and Stocks involves a risk of loss.
Please consider carefully if such trading is appropriate for you.
Past performance is not indicative of future results.
Always limit your leverage and use tight stop loss.
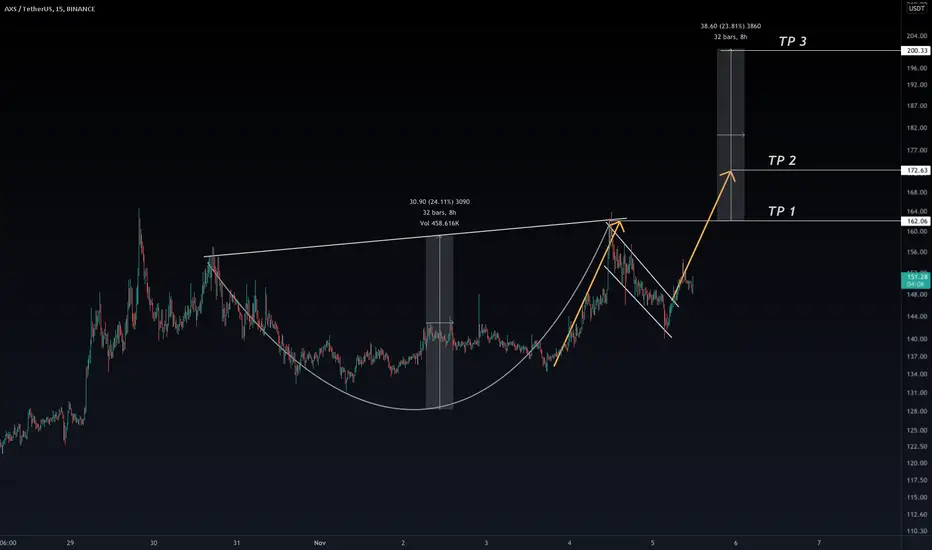
AXS, Daily Chart, BTC, Bitcoin, Alts$AXS Cup and handle on a shorter timeframe could see the Pokemon inspired pet universe coin reach ATH. Once we see a break above $162, the next two targets are well within reach! #AXS
AXS preparing for a pumpAs you know, Samsung recently allocated a budget to invest in Blockchain-based games, and AXS was one of them; This reduces the risk of long-term investment in Axie Infinity
This project also has a large community.

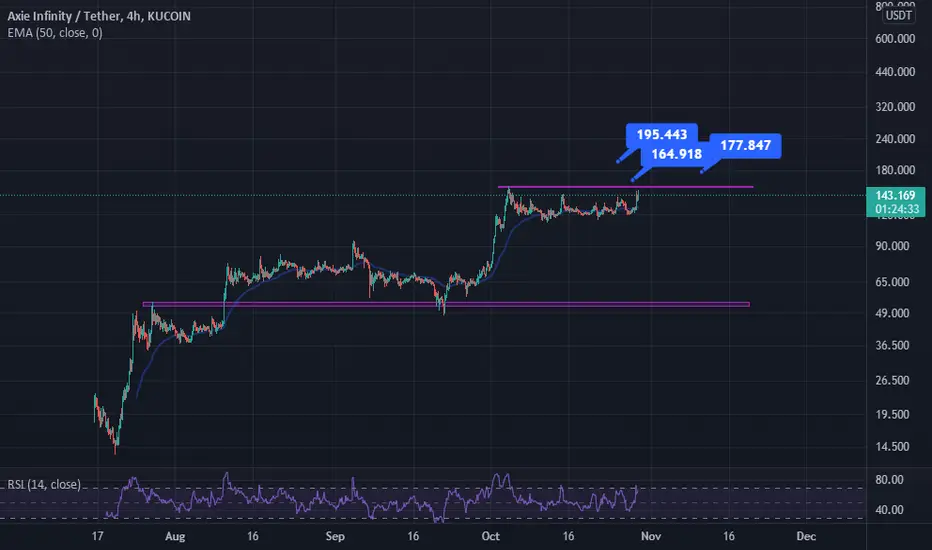
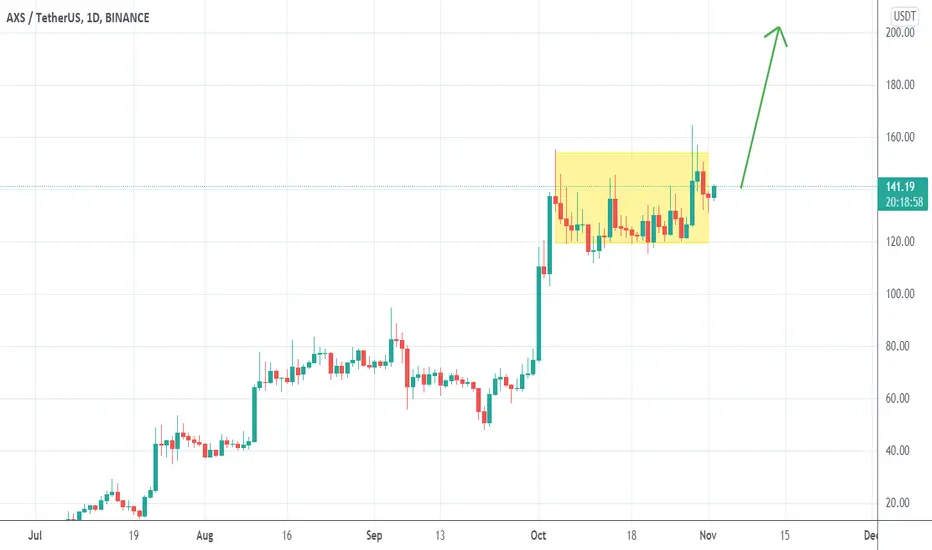
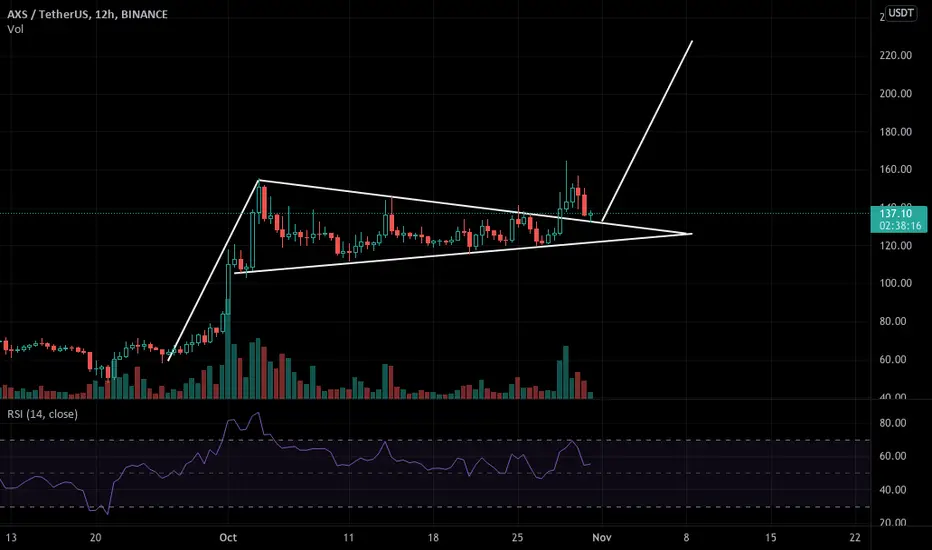
AxsUsd- Rise to 200?October was an accumulation/consolidation month for AxsUsd, with the pice ranging between 120 and 145, more or less
Now the coin looks ready for a new leg up and 200 level is my target
Under 120 would negate this scenario
Polygon/Matic- Next Leg Up!Coinbasepro: MATICUSD
4 hr chart
Matic is poised for continuation after breaking symmetrical triangle on the 4hr chart.
- Mac D indicates buying pressure is increasing.
- The Rsi has broke the downtrend, currently in a bullish reversal.
Profit Targets:
TP 1- $2.09
TP 2- $2.25
TP 3- $2.40
stop loss- $1.60

AXS IS READY FOR THE BIG JUMP According to
the base rules, the price penetrated the pivot level and then reacted to the 0.5 base level. The main target is 210.

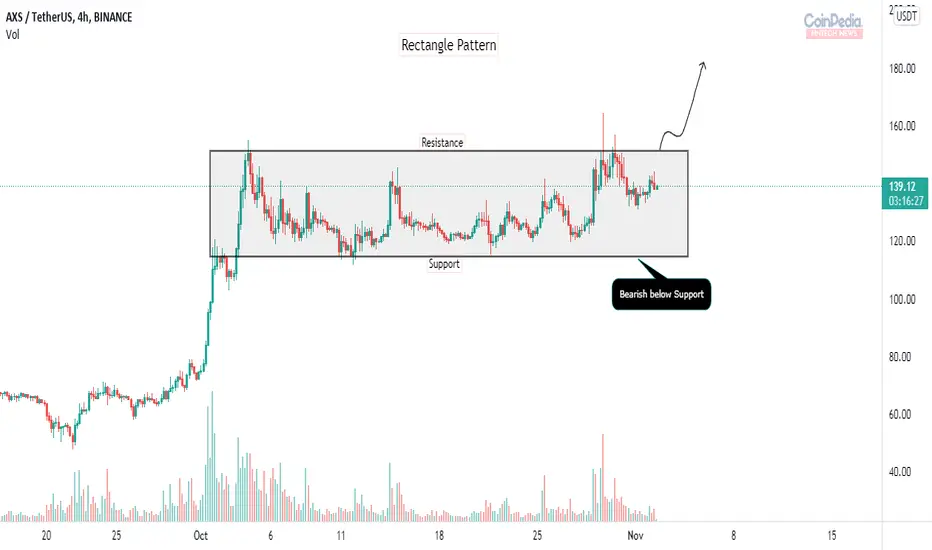
AXS is squeezed in Rectangle Pattern* AXS in 4H time frame is moving in Rectangle pattern
* The price is facing Resistance around $152 and it has support near $114
* Rectangle pattern occurs when the price bonds between two parallel trendlines opposite to each other. Rectangle is a trend continuation pattern.
* To continue the bull run AXS needs to break the above resistance of $152.
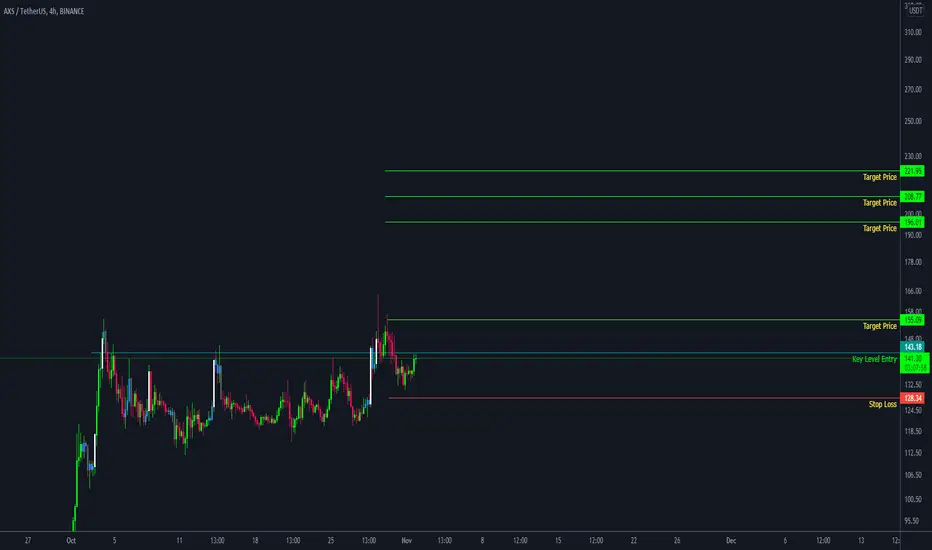
#axs $axs key level play#axs $axs key level play. If resistance breaks, we can flip this level towards $200
AXS/USDT 4HOUR UPDATEWelcome to this quick
AXS/USDT analysis.
I have tried my best to bring the best possible outcome me in this chart.
Reason of trade :- AXS/USDT analysis is triangle ready and retest complate green zone fast by the dip.
And AXS/USDT is fundamentals is strong is metaverse !
Entry:- cmp And green zone
Traget:- 30% to 45%
Stoploss:- $123
Remember:-This is not a piece of financial advice. All investment made by me is under my own risk and I am held responsible for my own profit and losses. So, do your own research before investing in this trade.
Happy trading.
Sorry for my english it is not my native languages.
Do hit the like button if you like it and share your charts in the comments section.
Thank you...
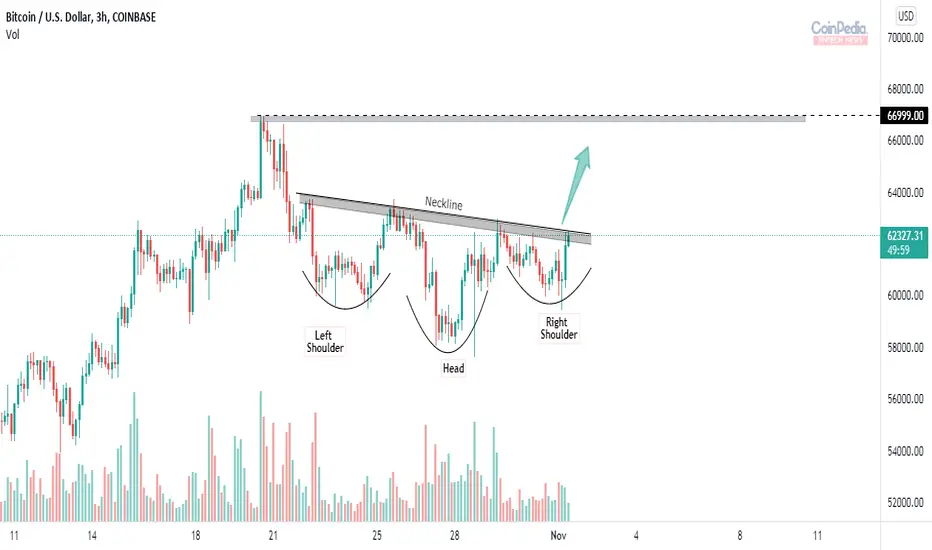
Trend reversal pattern in Bitcoin* Bitcoin in 3H time frame appears with Inverted Head and Shoulder pattern with it's neckline as resistance to the price.
* Inverted Head and Shoulder reverses the bearish trend into Bullish trend.
* If Bitcoin breaks the neckline of the pattern we can expect a rally till ATH.
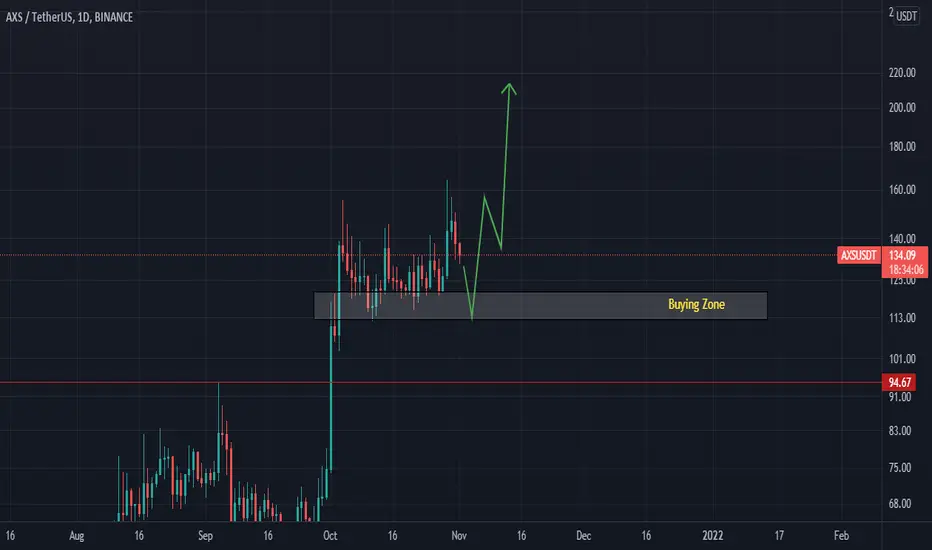
AXS USDT Long IdeaAXS is in consolidation mode
Looking for a dip in AXSUSDT
Buying zone should hold any dip
Will be a decent buying opportunity for year end rally
#AXS Axie Infinity 1D - Brewing ActionAXS on a daily chart.
A few things to note:
1) Rising wedge pattern in play.
2) Bearish divergence on 1D chart
3) Bollinger Bands tightening but similar structure forming since last tightening as circled in the chart.
Something interesting is surely brewing here.
What are your thoughts? Comment below and hit the like please. Thank you!
Disclosure: This is just my opinion and not any type of financial advice. I enjoy charting and discussing technical analysis . Don't trade based on my advice. Do your own research! #cryptopickk #bitcoin #altcoins

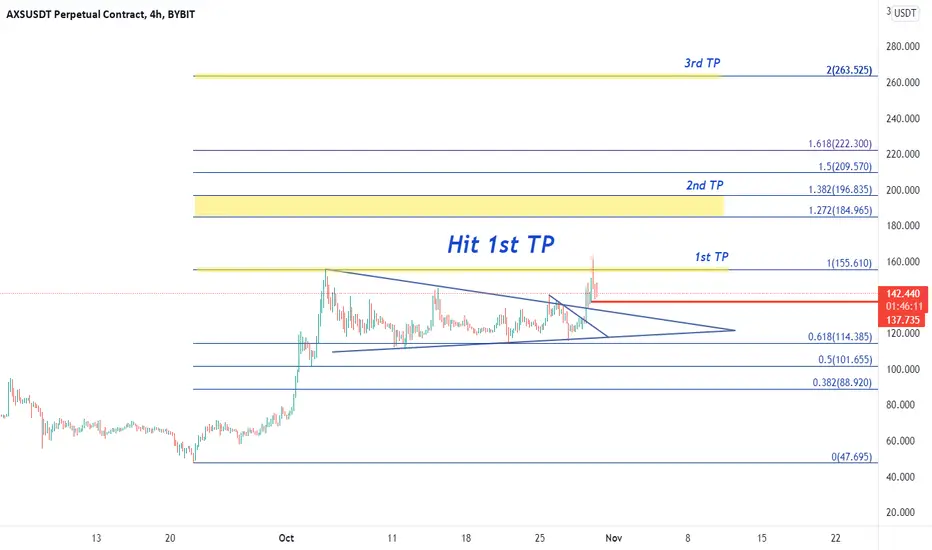
✅AXSUSDT - As predicted. Amazing Surge hit our 1st TP!BYBIT:AXSUSDT
-
For you that took profit with this strategy, Congrats!
-
As usual, do not forget to take profit at 1st TP we set, you can hold the rest until TP2 or TP3.
Just take it anytime you satisfy.
-
Also, I set a new SL $137.735 for you to protect your unrealized profit.
Have a good day!.
-
If you like this analysis, smash the like button and leave a comment below to share your thoughts
or let me know what crypto you want to see!
Trading is a reflection of yourself. Learn more daily and be ready for every opportunity.
Have a nice trading!
It'll be a Happy Halloween AXSUSD Update
- Spooky Szn for bears
- Trick or Treat?
If this play's out it'll be a happy halloween... Not intended to be financial advice! Trade Safely and don't chase tricks, but let's get these treats... Cheers!
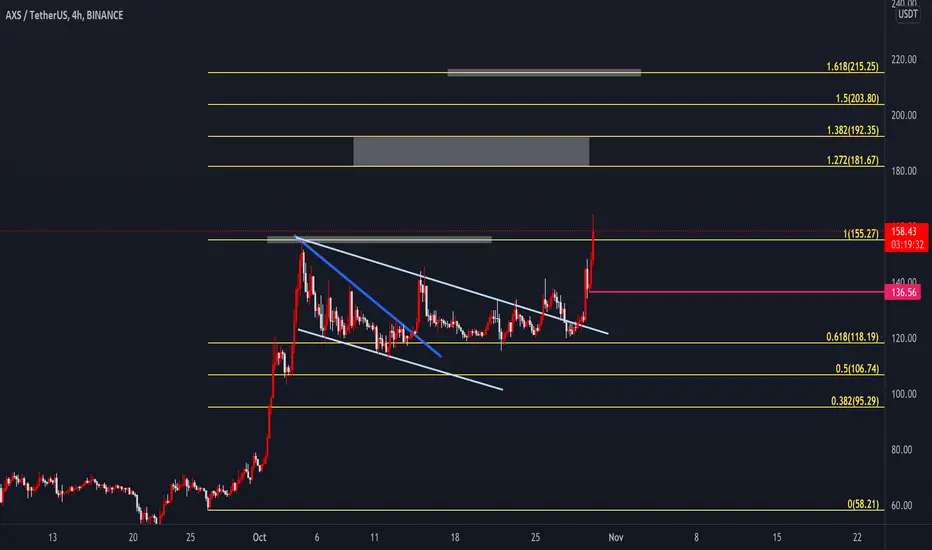
⭕AXSUSDT : Finally ,you wake up and ...
Click the pic to read last post and detail.
We are waiting for a week and AXS is waking up !!!
✅TP1:115.27
Modify SL to 136.56
TP2:181.67
TP3:192.35
TP4:215.25
TP5:252.33
If you like this analysis, give it a like or share your thought or let me know what crypto TA you want to know.
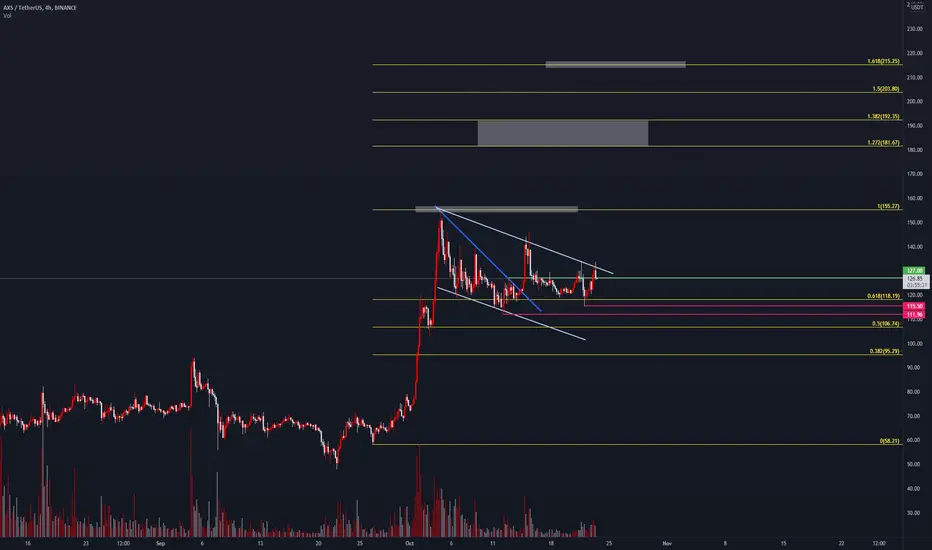
AXSUSDT : It broke out the wedge but..
Click the pic to read last post and detail .
It broke out wedge but went down again and we can modify the pattern to bullish flag.
If price can break out the flag and stand firm,we can modify the SL from 111.96 to 111.50 and TP is the same .
TP1:115.27
TP2:181.67
TP3:192.35
TP4:215.25
TP5:252.33
If you like this analysis, give it a like or share your thought or let me know what crypto TA you want to know.
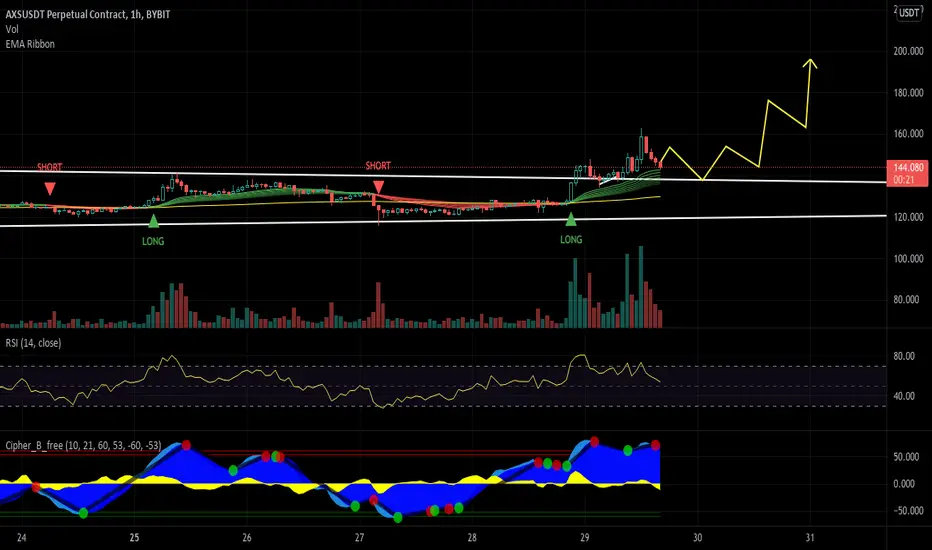
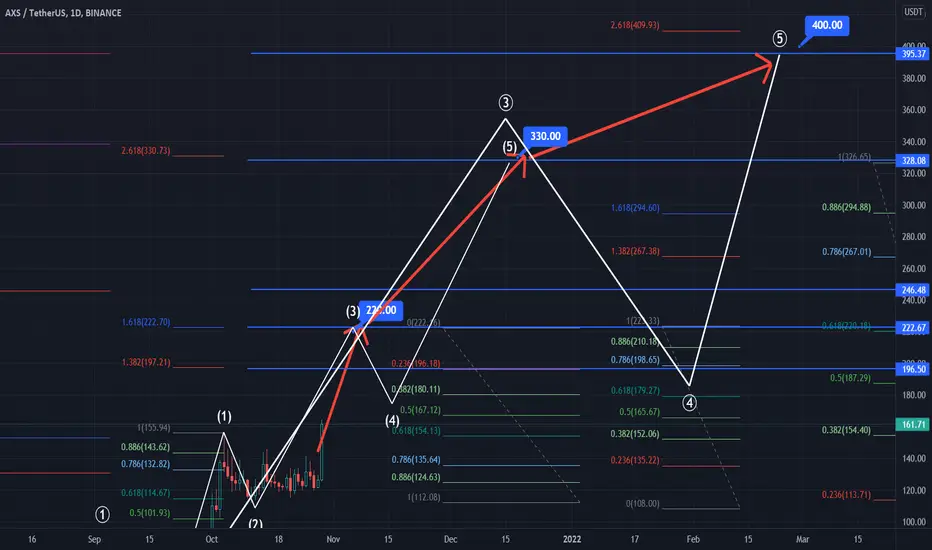
AXS will soon reach $220+, then what?Its wave shape is relatively clear and strong, so let's verify it in time.
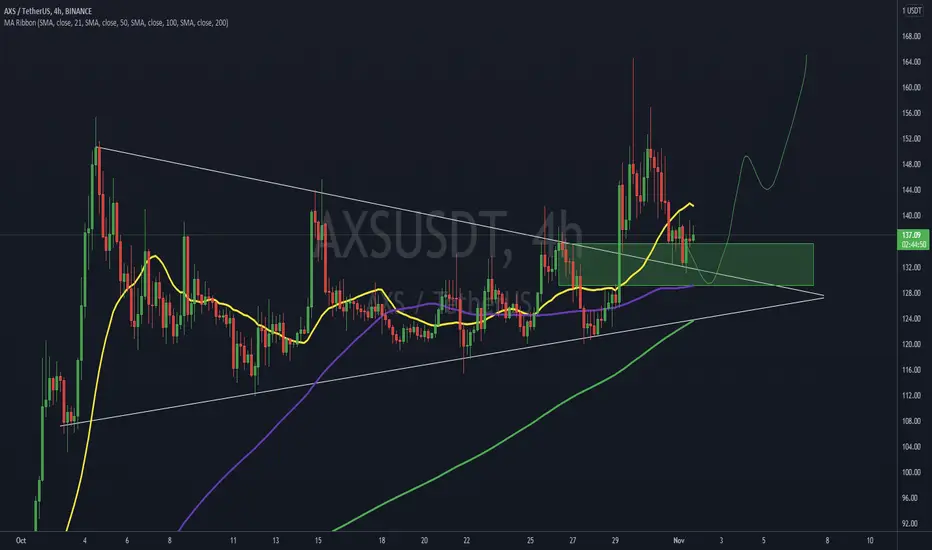
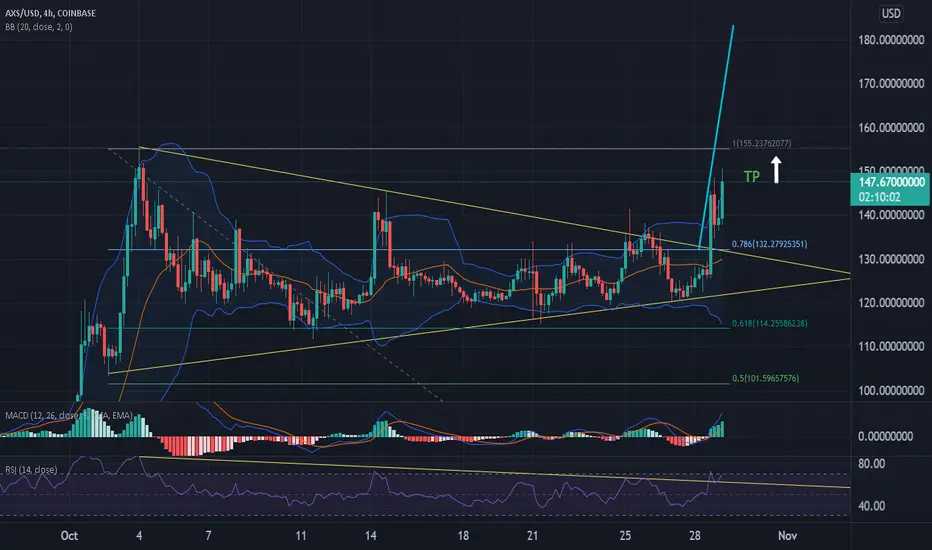
AXS- New Trendline breakout COINBASEPRO: AXSUSD
4 HR Chart
- Axie is looking very good.
- The price has been in accumulation since early October.
- We have had a sharp recovery after retesting the bottom of the symmetrical triangle.
- The price is now breaking the trend line at $133, a long position is now available with the conformation of the breakout. (4hr candle closure) .
Profit Targets:
Short term TP 1- $155
Mid term TP 2- $180
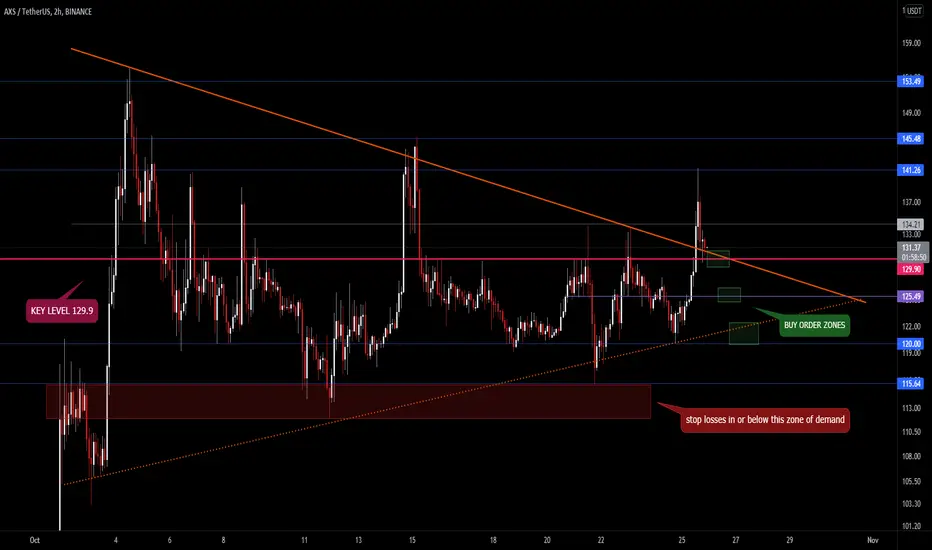
🐦AXS symmetric triangle (continuation)AXS/USDT (2h) formed a symmetric triangle (continuation pattern). The price broke out of the formation and is testing the key level (129.9) and the orange trendline as support. If we see a bounce from here than it's super bullish. If not, the price will most likely dive deeper back down into the formation to find a support level.
TP1: 134.21
TP2: 141.26
TP3: 145.48
TP4: 153.49
TP5: OPEN++
-- Note: Keep in mind that AXS is a native currency of Axie Infinity(p2e game), which makes it's price very vulnerable to any gameplay changes made by the dev team --