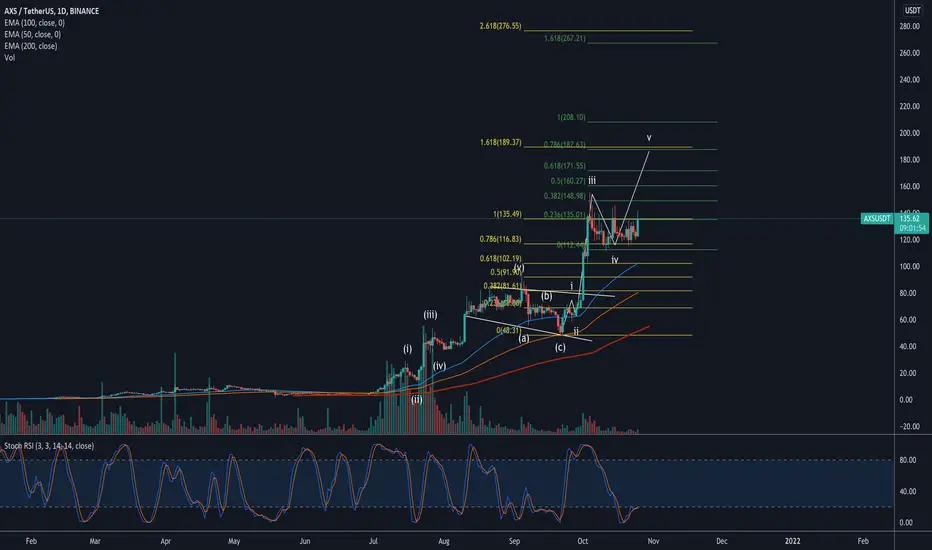
AXSUSD

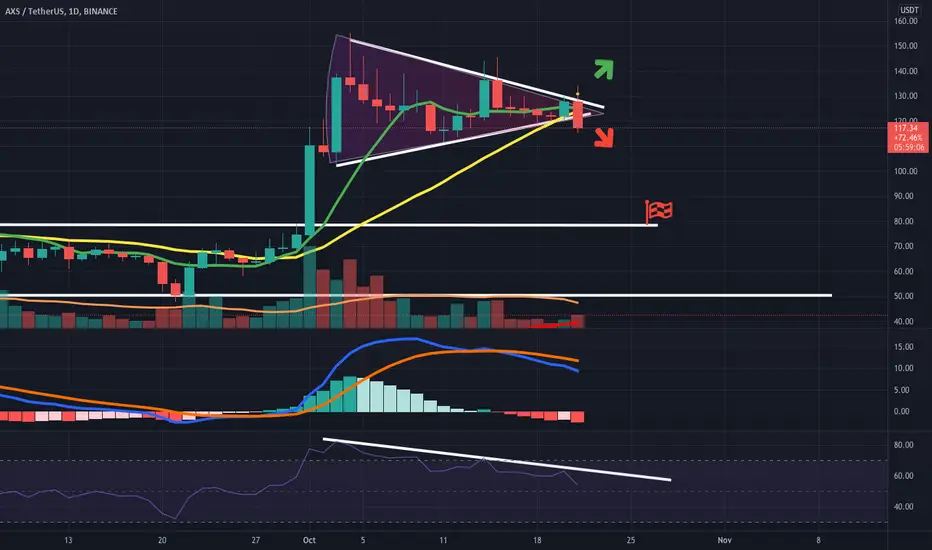
AXS - going to break through this trendline❓🤔AXS has been trading in the $120-$140 range for quite some time. Additionally, it is worth noting that a narrowing of the trading range is taking place. It means that a strong momentum is coming and it is likely to be upward. A good buying opportunity would be a squeeze and a breakout.
Write in the comments all your questions and instruments analysis of which you want to see.
Friends, push the like button, write a comment, and share with your mates - that would be the best THANK YOU.
P.S. I personally will open entry if the price will show it according to my strategy.
Always make your analysis before a trade.

AXSUSDT Axie Infinity Next Big Move Coming !?!AXSUSDT is again making good upward moves. Just like the previous waves can it make new all time highs?!. we can attempt to take a ride of it with stop losses levels mentioned for risk management
Bull Flag GOES BOOM Still need at least 4hr or 8hr close above this level to confirm in my opinion - target of the bull flag is roughly $230
- Not financial advice
- If you enjoyed this analysis let us know in the comments
- Follow us for more in depth analysis on all cryptos! Cheers, and trade safely
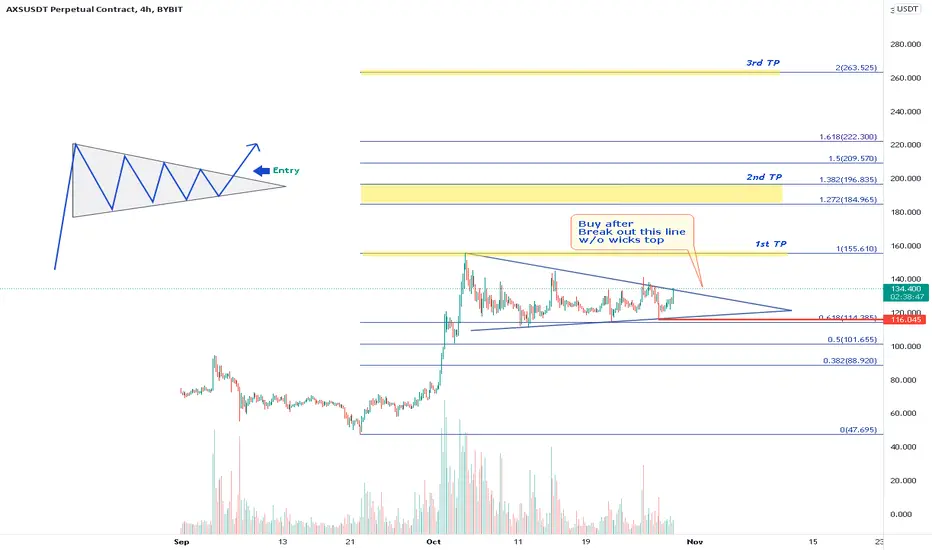
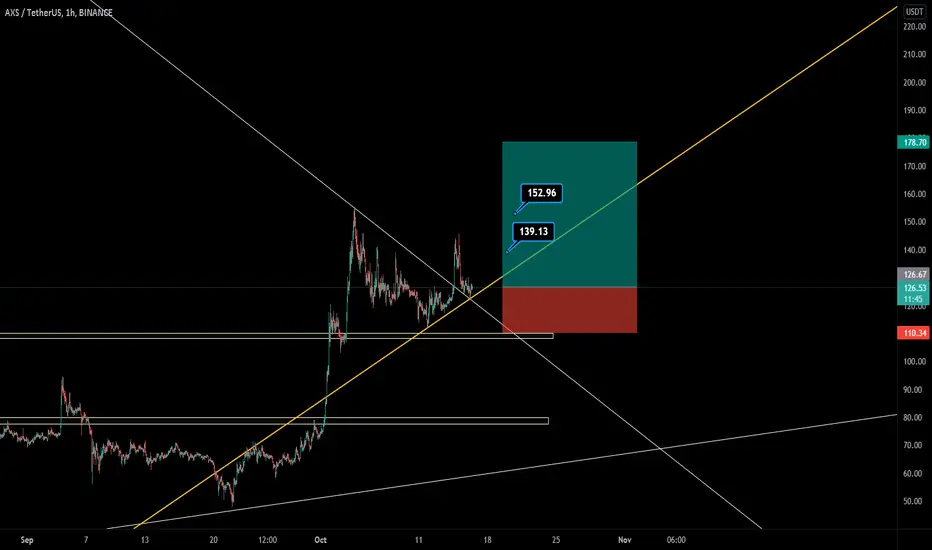
AXSUSDT - Buying time?BYBIT:AXSUSDT
4H trend chart
-
AXS is converging in a triangle.
If price can take out the upper downtrend line, trading strategy as below.
-
Profit Targets:
a) 155.610----Fib(1)
b) 184.965~196.835----Fib(1.272~1.382)
c) 263.525----Fib(2)
Stop losses:
a) 116.0458-----Red horizontal ray
-
If you like this analysis, smash the "like button" and leave a comment below to share your thoughts
or let me know what crypto you want to see!
Trading is a reflection of yourself. Learn more daily and be ready for every opportunity.
Have a nice trading!
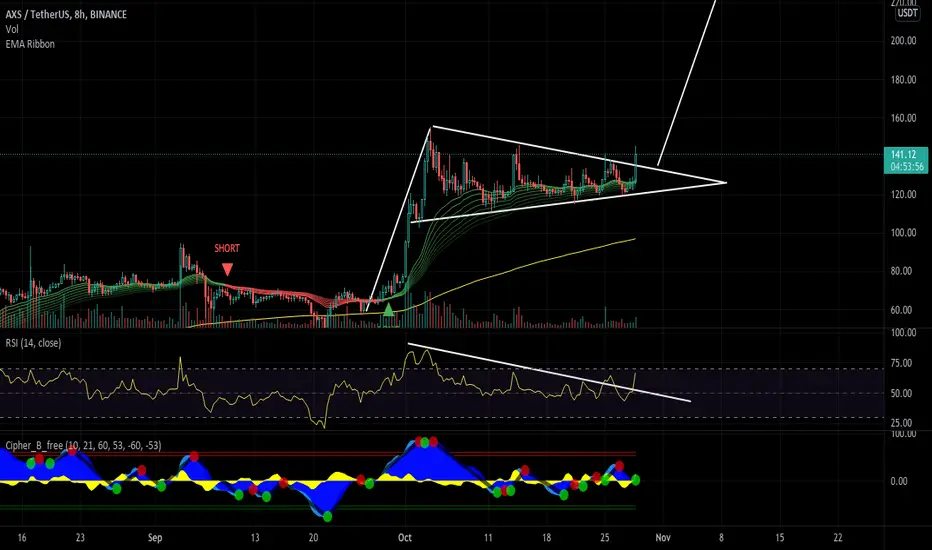
axs UP Formation of a flag pattern in daily timeframes
In case of failure, I expect growth up to the specified limits
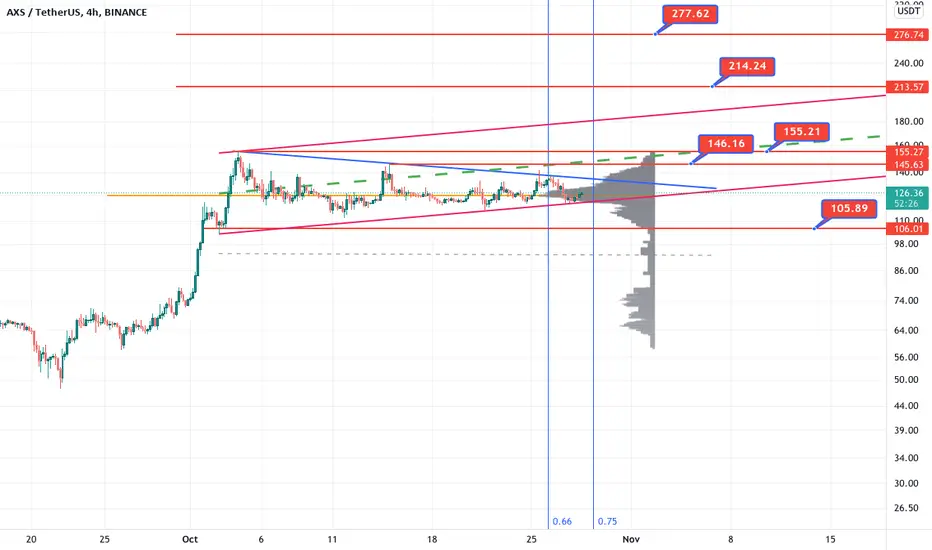
#AXIEINFINITY #AXS 4H TECHNICAL ANALYSIS
Due to the long-term uptrend channel and the formation of the triangle pattern, as well as approaching one of the levels of the uptrend channel, due to the help of Fibonacci, there is an expectation of price growth to one of the following TARGETS.
TARGET1: 165
TARGET2: 188
TARGET3: 210
STOPLOSS: 110$
ENTRY : 128-122
TIME: 1-3W

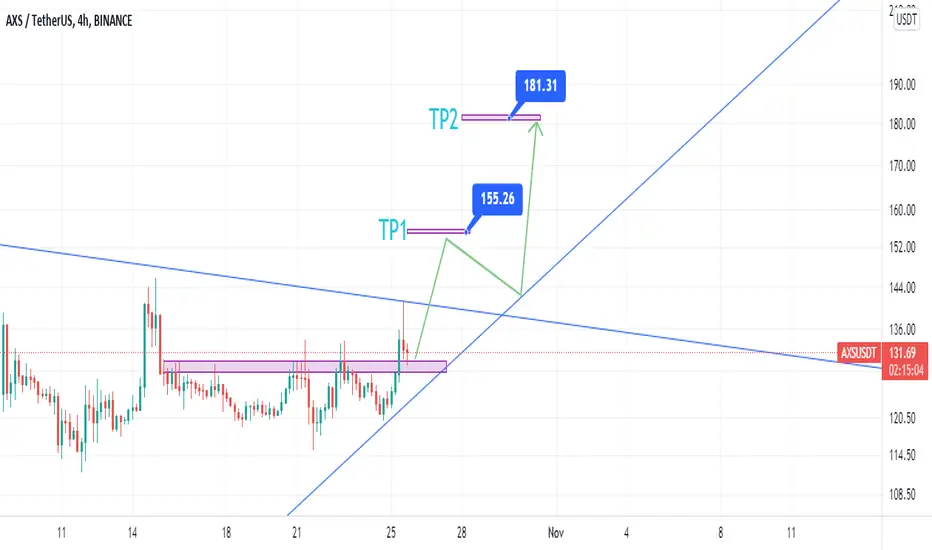
AXSUSDT Bullish Signal Middle termgood price to buy. I think it can have a new trend soon. 180$ is a huge resistance
Axie Infinity could be headed to $75AXS coin, for the popular game Axie Infinity, could be headed to $75. It had a chance to continue its upside, but looks like it chose to breakdown. Combined with bearish RSI divergence, Bearish MACD.
This is not financial advice, do your own research.
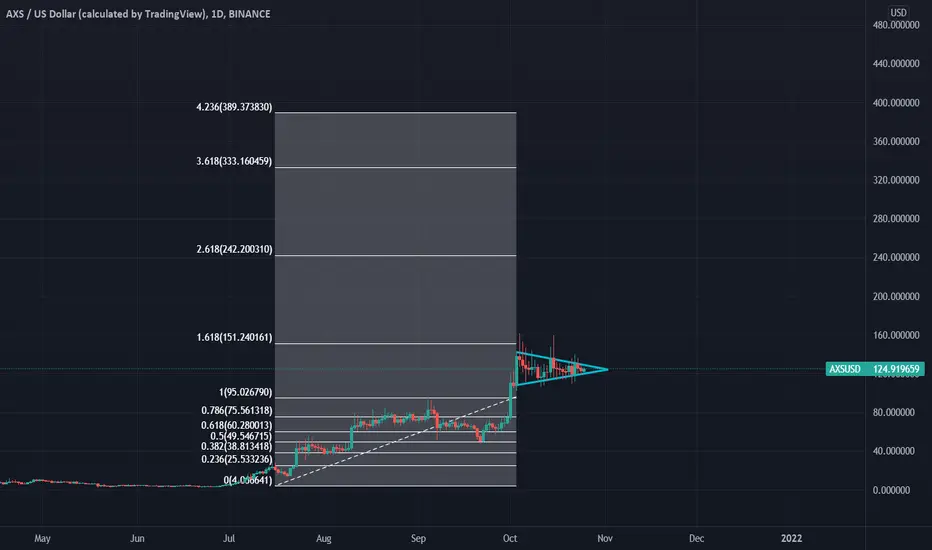
AXS/BUSD Symmetrical Triangle Breakout Target PricesTP Targets of AXS/BUSD following a breakout from the symmetrical triangle pattern, which is predicted to ultimately hit the 1.618 fib level. Supported by the STOCH RSI and daily MACD crossover coming soon.

$AXS to the moonAxie Infinity Shards is just about the easiest trade you can make right now.
The market still hasn't caught up to the fact that it's the second highest revenue producing protocol - alone this should place it in the top 10 market cap.
With fundamental bullish catalysts like the Ronin DEX and Land gameplay coming out in Q4 it's certain to reach new highs. Additionally, AXS staking continues to lock up an increasing amount of supply with ~30% currently staked, and yet APR remains in the triple digits.
From a technical perspective it looks amazing as well, a clear pennant has formed. Fib extensions are for possible targets but I intend on holding my stack much higher than any of the prices shown.
I want to write more but I think I'll just do a thread instead. Best of luck.


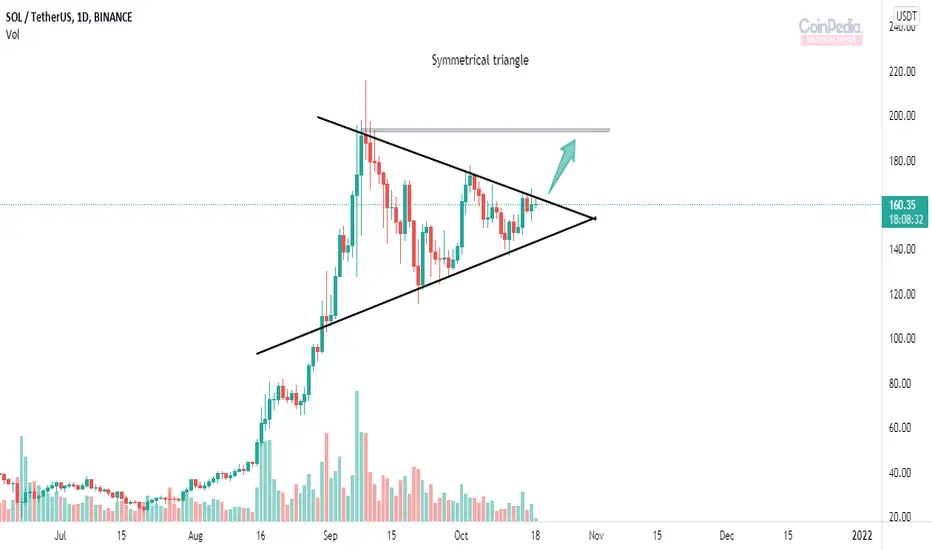
Solana technical analysis* Solana in 1D time frame forms a Symmetrical triangle
* Symmetrical triangle appears when the price consolidates between two trend-lines slightly sloping towards each other.
* Here the below Ascending trendline works as support for the price and the above Descending trendline as resistance
* If SOL breaks the above trendline we can see continuation of the trend.
AXS has the potential to reach 210$Hi every one
AXS /USDT
AXS has formed a Bullish Pennant! The Price can Increase as much as the Pennant Pole! The Break out has not happened yet so we must wait for confirmation! if it happens, Price can reach 210$ and Create a New ATH soon!
Summery:
-AXS is in a Bullish Pennant.
-Can Increase as much as the Pole
-210$ is a Target.
💎Traders, if you liked this idea or have your opinion on it, write in the comments, We will be glad.
Things can change...
The markets are always changing and even with all these signals, the market changes tend to be strong and fast!!
Thank you for seeing idea .
Have a nice day and Good luck

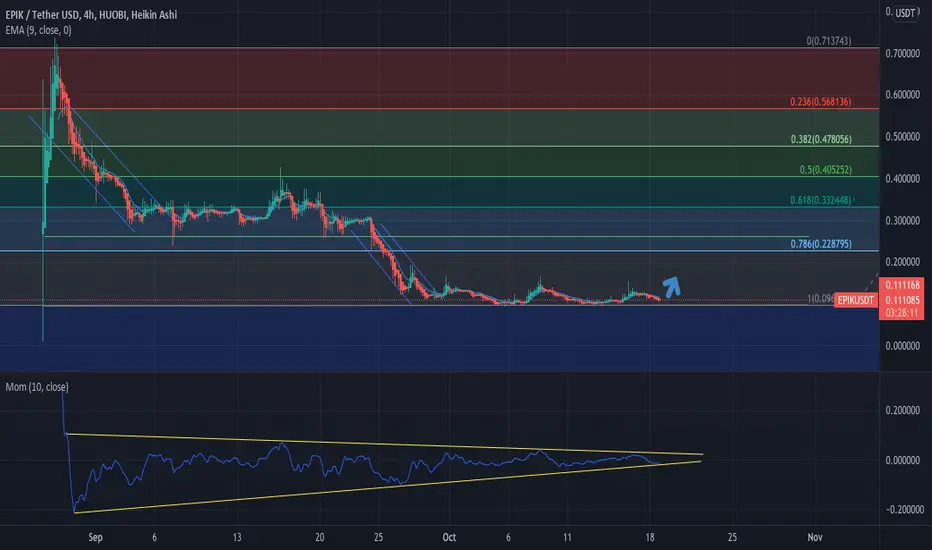
EPIK seems to have found support... Easy moneyAfter the initial blow off from the ICO, it seems we have found our first line of strong support at around $.10. Being that this is a relatively new project, with such a minuscule market cap, it is surprising to see such a clear line of support from this soon from the 4H.
If you are interested at all in this project, and have hopes of it one day becoming a competitive eco-system in the NFT space, then I think right now would be a good time to enter. I bought in at this level and plan to hold long, as personally, I easily seeing this project's cap going 10x once the app is launched and there begins to be an in-flow of users.
www.epik.gg
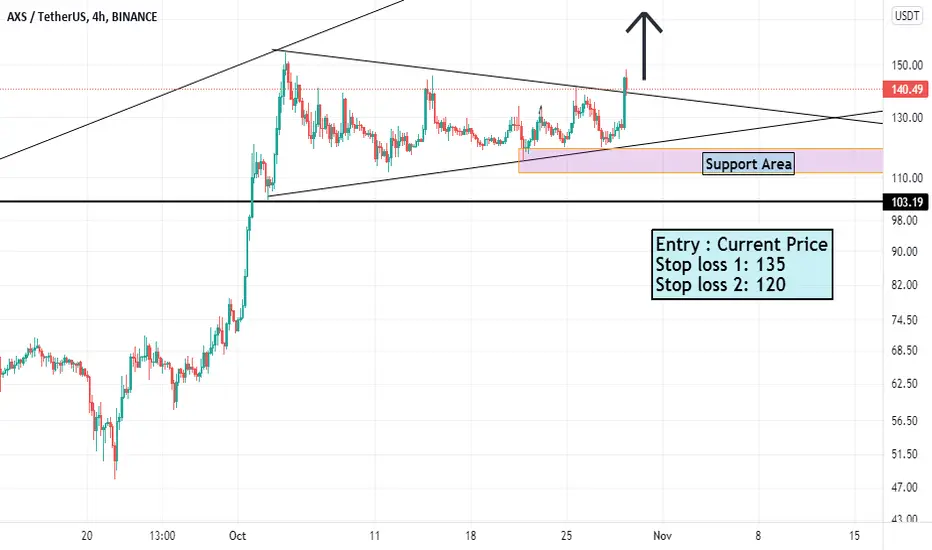
AXS/USD Short.
Signals:
Position: Short
Entry price: Limit order at 119,537
Target price 1: 101,570
Target Price 2: 72,837
% decrease: P1: 15% P2: 39%
Indicators:
DMI: The ADX line is showing strong signals of a trend and the D+ line is staring to slope
downwards as well as the D- line is showing signs of a downtrend as about to start.
RSI: The RSI line was above 70, a t81,80 and has started towards 58,34and signs of being overbought.
MACD: In this indicator has the MACD line crossed the signal line and negative momentum has started.
Fear and Greed: This indicator indicates that the market has extremely greedy investors and that the market is due for a correction.
Analysis:
The analysis indicated on bearish signals from both the three indicators, where DMI shows negative momentum, RSI is showing signs of the cryptotoken being overbought and the MACD line is showing signs of bearish momentum. A recommendation is to enter the trade when the price brakes below the support and retests it successfully as a resistance.
Fear and Greed Index is showing extremely greedy investor climate resulting the market waiting for a correction. Together with this index and the other three indicators is the analysis able to show signs of a short position.
No Financial Advice.

AXS WILL GROWHi. This currency is a good opportunity to buy. Make purchases with capital management. Has the ability to grow to specific goals. Pollback has access to the support area and then ascends to the specified area.
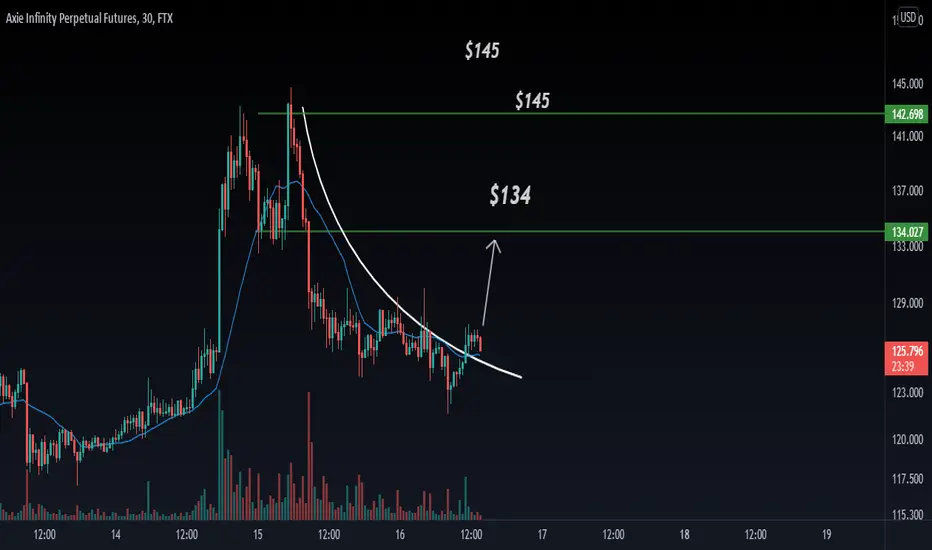
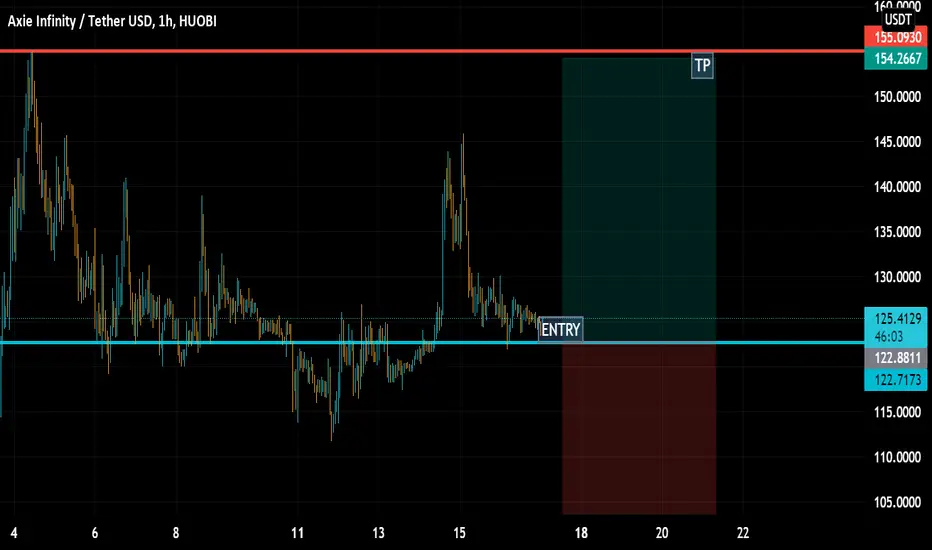
AXS, AXSPERPETUAL, Futures, Bitcoin, BTC,SCALP TRADE - 30 min TIMEFRAME
Scalp opportunity with $AXIE on breakout from resistance. Leveraged trade: 5x 10x 20x
Entry: $125
TP1 $134
TP2 $145
SL $120
ONLY TRADE WHAT YOU CAN AFFORD TO LOSE
NOT FINANCIAL ADICE