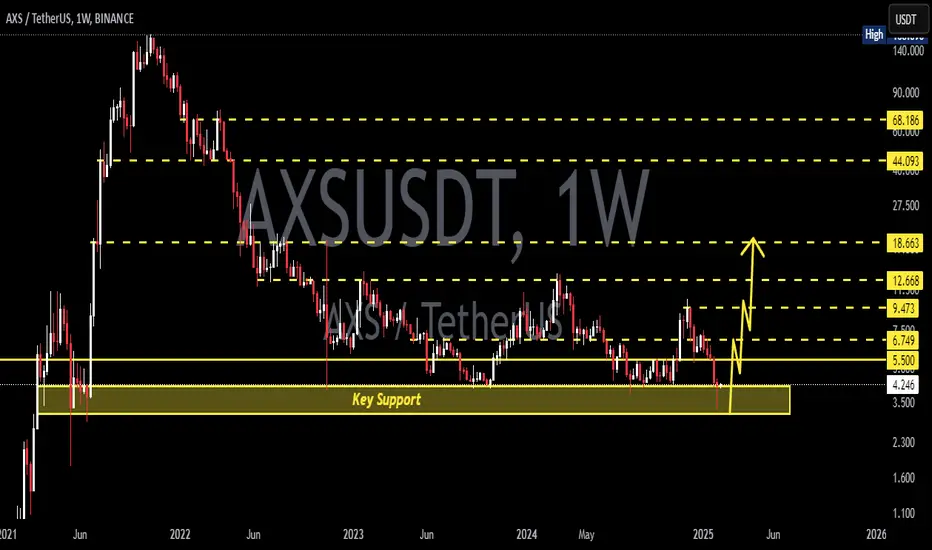
AXSUSDT 1WAXS ~ 1W Analysis
#AXS If you still have a Conviction on this coin, maybe this support you can consider to start buying again from here.
Axsusdsignals
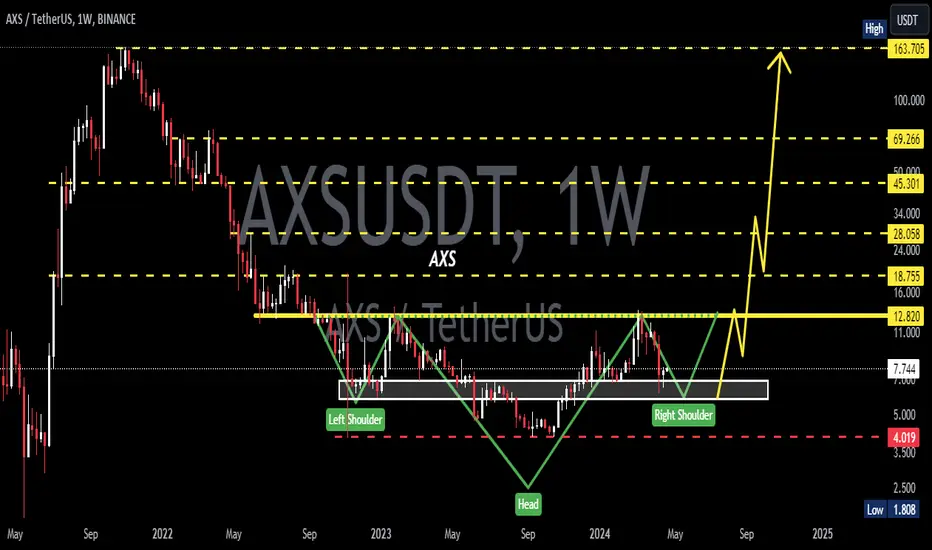
AXSUSDTAXS ~ 1W
#AXS Continuing to maintain this support block,. If you still have Conviction on this coin. This support block would be a very good buying place for now. at least for a 20%++ increase in the short term.

AXSUSD 1WAXS ~ 1W 📈
#AXS Pattern H&S Formed here. this is the Bull Pattern. We will be buying in stages here with small trades, with a minimum target of 15%+
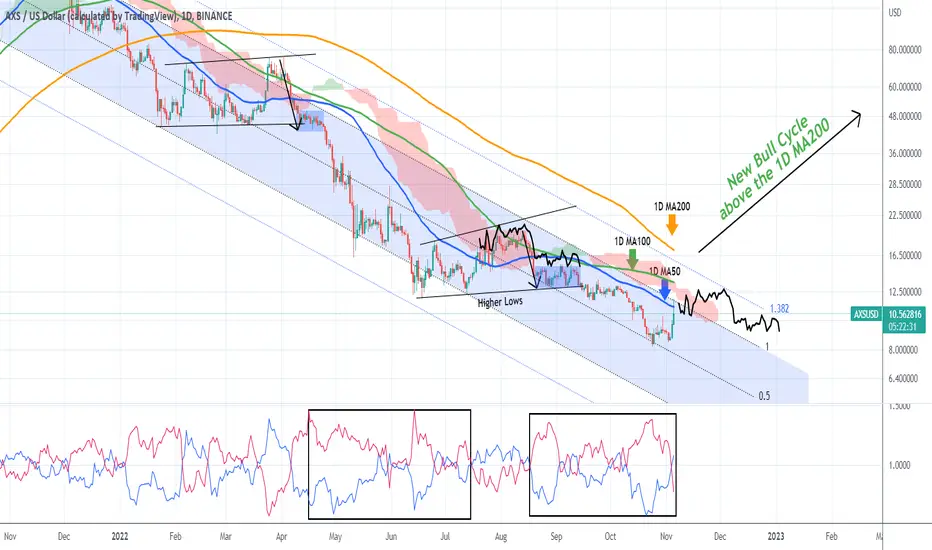
AXSUSD Above the 1D MA50 but must break this for new Bull CycleAxie Infinity (AXSUSD) broke today above the 1D MA50 (blue trend-line) for the first time since August 18 and continues to trade within the pattern we suggested on our last idea (August 31):
As you see, since the price failed to break above the 1D MA50 at the time, it followed the Jan - April fractal as projected and dropped to our 8.50 target and even slightly lower. With the Vortex Indicator (VI) printing a pattern similar to the July 18 1D MA50 break-out, we may be starting a new Megaphone consolidation again. The 1.382 Fibonacci extension is not that far so we can be more positive this time. However we won't be engaging in any long-term buying until the 1D MA200 (orange trend-line) breaks, which has been the Resistance since January 05 2022.
-------------------------------------------------------------------------------
** Please LIKE 👍, SUBSCRIBE ✅, SHARE 🙌 and COMMENT ✍ if you enjoy this idea! Also share your ideas and charts in the comments section below! This is best way to keep it relevant, support me, keep the content here free and allow the idea to reach as many people as possible. **
-------------------------------------------------------------------------------
You may also TELL ME 🙋♀️🙋♂️ in the comments section which symbol you want me to analyze next and on which time-frame. The one with the most posts will be published tomorrow! 👏🎁
-------------------------------------------------------------------------------
👇 👇 👇 👇 👇 👇
💸💸💸💸💸💸
👇 👇 👇 👇 👇 👇
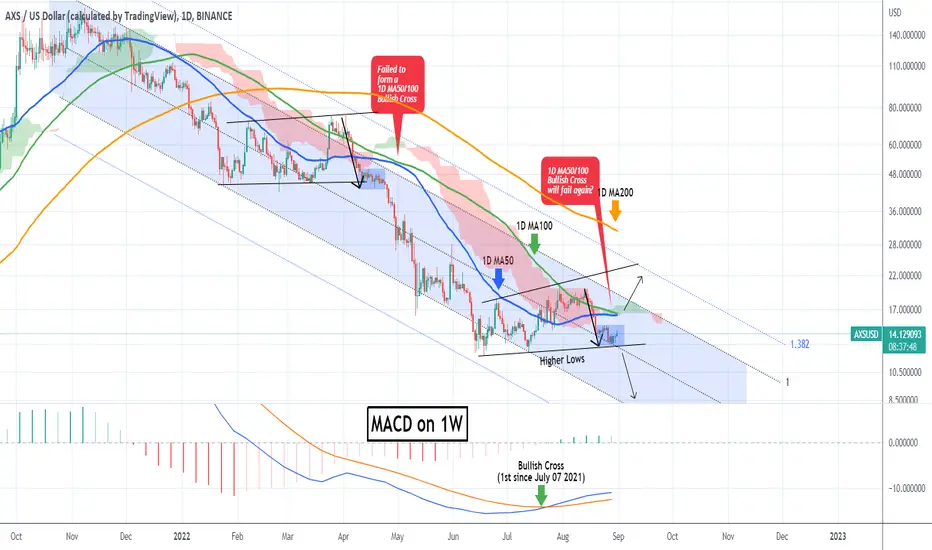
AXSUSD No buy until this level breaks.Axie Infinity (AXSUSD) has been consolidating below the 1D MA50 (blue trend-line) since August 19 2022. This is so far a similar trading sequence to the fractal of April 02 - April 24, where the price dropped aggressively initially before having the consolidation that kick-started the sell-off of April - May.
The current Support as in April, is the Higher Lows trend-line. A failure of the 1D MA50 to cross above the 1D MA100 (green trend-line) would strengthen the bearish bias as it failed also back in April. Also the Ichimoku Cloud has already turned red. As a result, a break below the Higher Lows would be a sell signal towards the bottom of the Channel Down.
However, this time there is a strong indication that long-term bullish accumulation has started. That is the MACD on the 1W time-frame, which is on a Bullish Cross, the first since July 07 2021. This is typically formed before long-term rallies. Therefore, a break above the 1D MA100 can target the Higher Highs trend-line and the 1D MA200 (orange trend-line) in extension.
--------------------------------------------------------------------------------------------------------
** Please support this idea with your likes and comments, it is the best way to keep it relevant and support me. **
--------------------------------------------------------------------------------------------------------
AXSUSD within its Buy Zone flashing the same signal as JuneAxie Infinity has been on a long-term Fibonacci Channel Up ever since its first trading day in November 2020. As you see, it has two clear pressure zones, a Buy Band (green) and a Sell Band (red). Those have never failed to give clear buy/ sell signals.
What has been an even stronger buy signal though than AXSUSD trading within its Buy Zone alone, is that when it also breaks below the 1D MA200 (orange trend-line), it tends to bottom out and start a strong rally to the top of the Channel Up. That's what took place in late June 2021. With the Ichimoku Cloud also flashing a buy signal, AXS is possible to soon start a strong rally first towards $220.00 and then $500.00.
--------------------------------------------------------------------------------------------------------
** Please support this idea with your likes and comments, it is the best way to keep it relevant and support me. **
--------------------------------------------------------------------------------------------------------
