SLP/USDT strong potential in parallel of AXS bullish momentumSLP/USDT strong potential in parallel of AXS bullish momentum - NFT Sector
Smooth Love Potion (SLP) tokens are earned by playing the Axie Infinity game. This digital asset serves a replacement for experience points.
SLP are ERC-20 tokens, and they can be used to breed new digital pets that are known as Axies
SLP is also unique because of how it has become one of the few in-game tokens to be listed by Binance in its Innovation Zone. The exchange has reserved this trading category for assets “that are likely to have higher volatility and pose a higher risk than other tokens
Context:
Regarding the lake of historical data it for now not possible to present picture with a strong conviction - However the few technical elements and wave proportion can already leaning towards an interesting upside potential in parallel of the success on AXIE
here the view on Axie =>
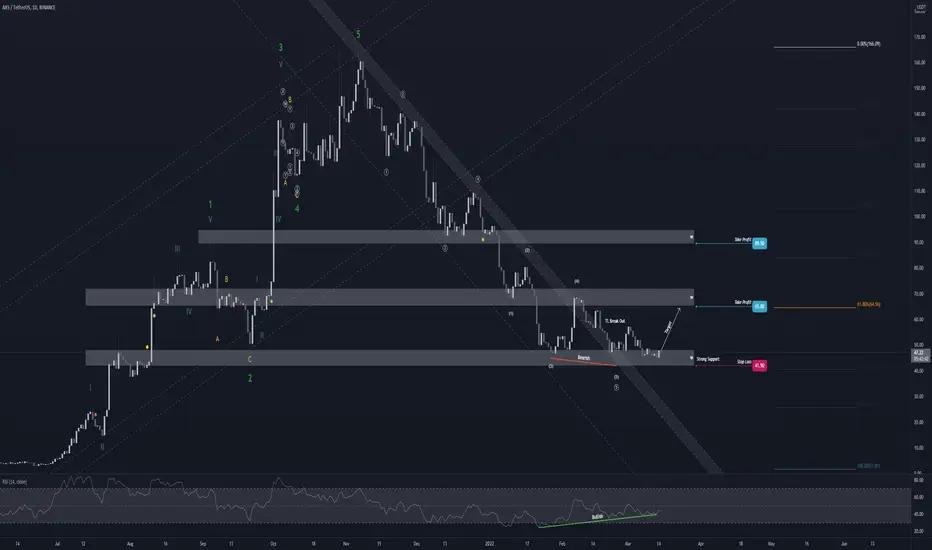
Tactical view - 1 to 3 weeks
The fact that 3 key elements (EMA upside breakout, RSI 50% upside breakout and first Harmonic on 3H basis upside breakout) are already bullish pre-signal allow us to be confortable with a larger rise at least to test 0,0910 in order to complete the harmonic auto-similar move (action/reaction). The next target above 0,0910 are more to be consider for a strategic horizon once 0,0910 has been surpassed at least in a daily close.
As long as 0,0125 remains a key tactical support valid the market is expecting to accumulate bullish momentum in dip (area possible 0,0215/0,0150) to reach 0,0910
Enjoy
AXSUSDT

$AXS, 30% over the last 48hs$AXS
If BAYC is the blue chip of the NFT, then AXS is the blue chip of the crypto-games?
30% over the last 48hs & showing a new UCTS 2D Buy signal (has to close)
Volume making HHs. If manages to hodl/flip this area, then aiming for ~90$
#AXS

AXS 48% setupAXS found bottom, we can see some like Adam and Eve pattern with growing RSI. I'll try to open position near 0.618 fib and MA100 on daily timeframe.
Axie Infinity (AXSUSDT) mid tf Range Updated till 24-3-22Axie Infinity (AXSUSDT) midteir timeframe range. this is a fundamentally beast of an alt for its virtual use-case and active development. but i am here to talk about some Technical sides here. its got pretty decent price action cause of volume of course. it got swing setups, intraday setups, there are some scalp setups too but risk is kinda little bit higher than leveraged profit. there are not much of space between its zones its been occupied for the scalps and microtrades.
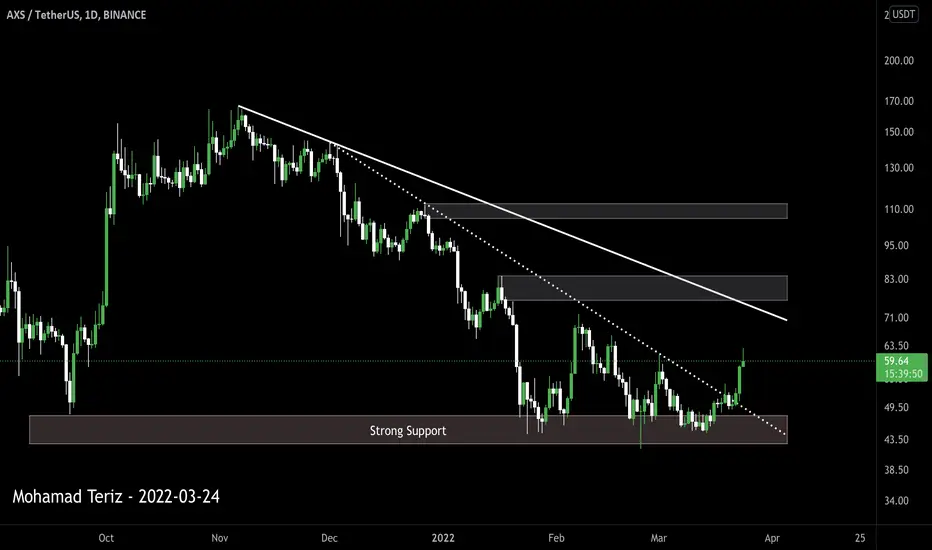
AXSUSDT 1D TA : Break TredLineBy supporting the price in an important support range, it was able to break the downtrend line. If we re-support and break the next trend line in the chart, we have a chance to climb to the specified goals. Otherwise we will have a reaction on the trend line.
Its not Buy or Sell SIGNAL
DYOR
BY : Mohamad Teriz - @AtonicShark
AXIE INFINITY! THE $50 SUPPORT LEVEL WORKED OUT.Since November 2021, we have seen most cryptos and altcoins, even Bitcoin concede downtrend movements..
Price has continued to move to the downside here on AXS, but the support level at $50 has been holding strong so far.. We've seen price bounce multiple times from this key level.
Would we see a bullish rally?
Well, we might want to wait for uptrend structures to confirm a bullish rally. But we must understand that "buying the dip" is important at this time.
The all-time high is priced around $163, so picking up AXSUSDT here at $50-$60 is really reallyyyyyy cheap, basically at a discounted price.. I'm long on AXS. I'll be waiting for a new ATH.

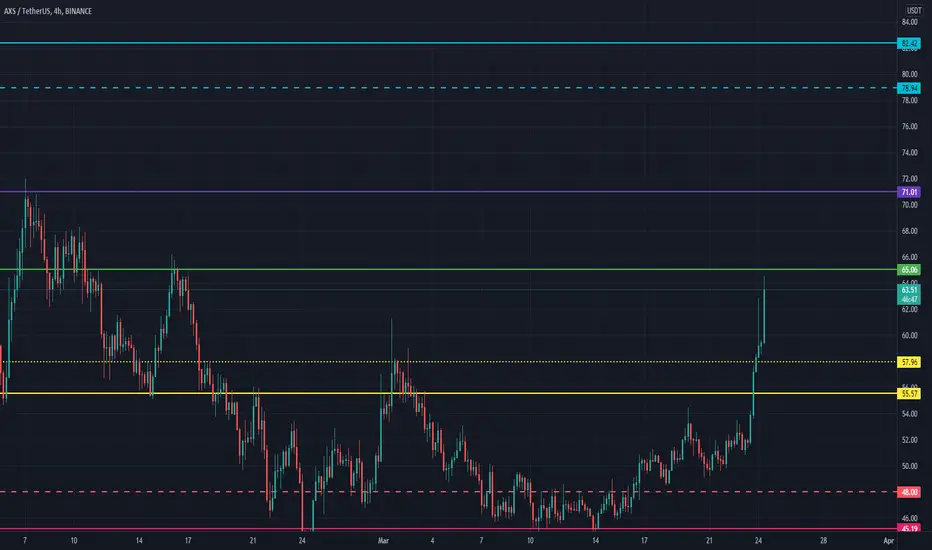
Axie Infinity longAxie Infinity bounced off the support area. Asset broke trough off the descending trendline. Bullish movement to resistance level at 61.35 is possible.

AXS - Video Top-Down Analysis!Hello TradingView Family / Fellow Traders. This is Richard, as known as theSignalyst.
Here is a detailed update top-down analysis for AXS.
Which scenario do you think is more likely to happen? and Why?
Always follow your trading plan regarding entry, risk management, and trade management.
Good Luck!
All Strategies Are Good; If Managed Properly!
~Rich

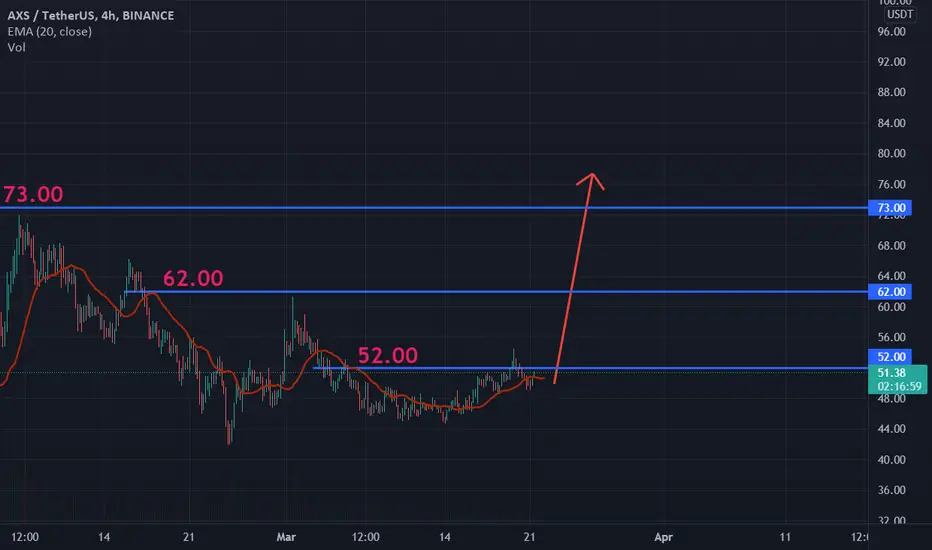
AXSUSDT 4H: Possible LONGAXSUSDT 4H: Possible LONG
On the 4H chart, after breaking through the level of 52.00, a short-term movement and price growth towards the targets 62 and 73 is possible.
AXS only for risk takersWaiting for reversal here... there might be some bounce 30-70%. This one is risky because if green support break down... we can see lower prices...smaller position here.
NOT FINANCIAL ADVICE
POSTING ONLY FOR EDUCATIONAL PURPOSE
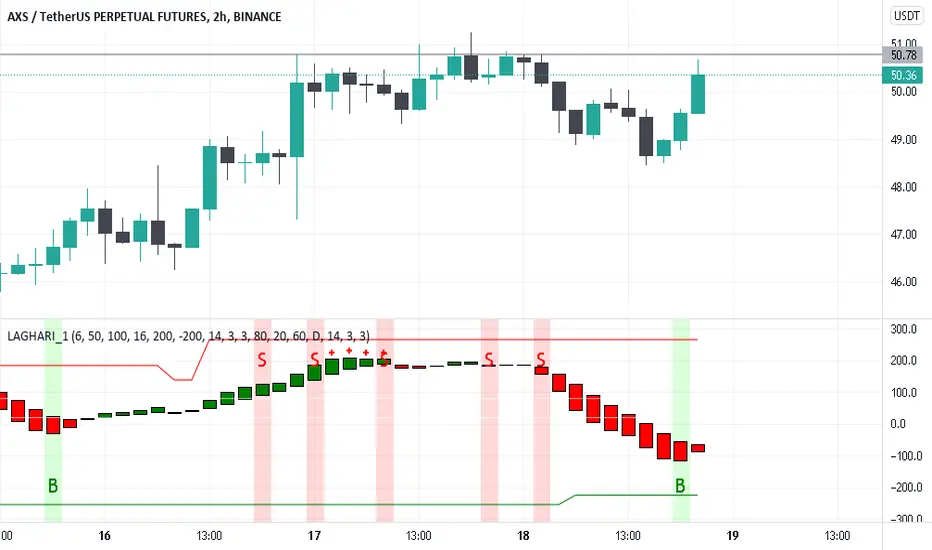
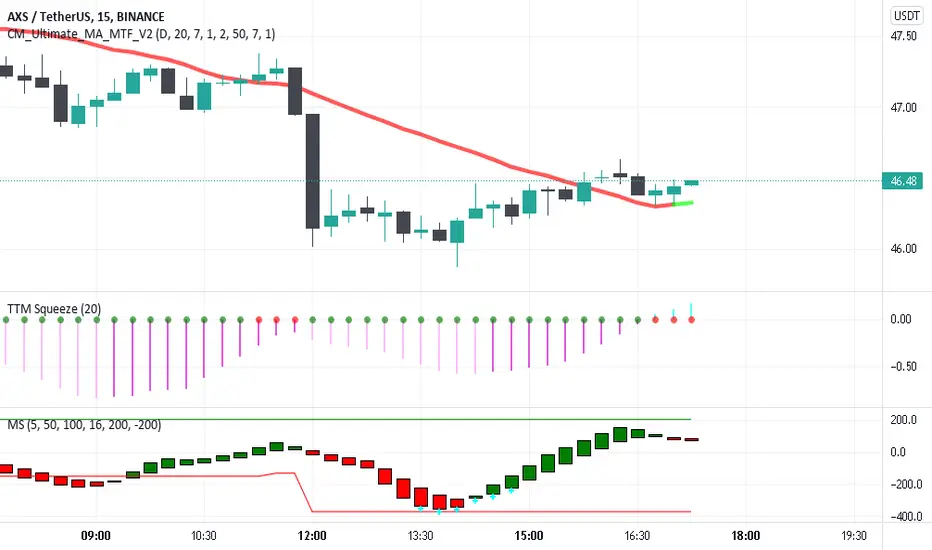
AXS breakout longPrice has been holding long term daily support floor. Had a downtrend line that was broken to the upside 2 days ago and has been holding it and daily 20 ema line as support. Price had broke out on the 4h chart and has been forming flag. 2h and 1h charts are seeing bullish divergence on stoch as price is respecting a new short term uptrend line. Price had a 38% retracement from lows. Have bullish bias on total market for near term, this is a hedge to my short positions
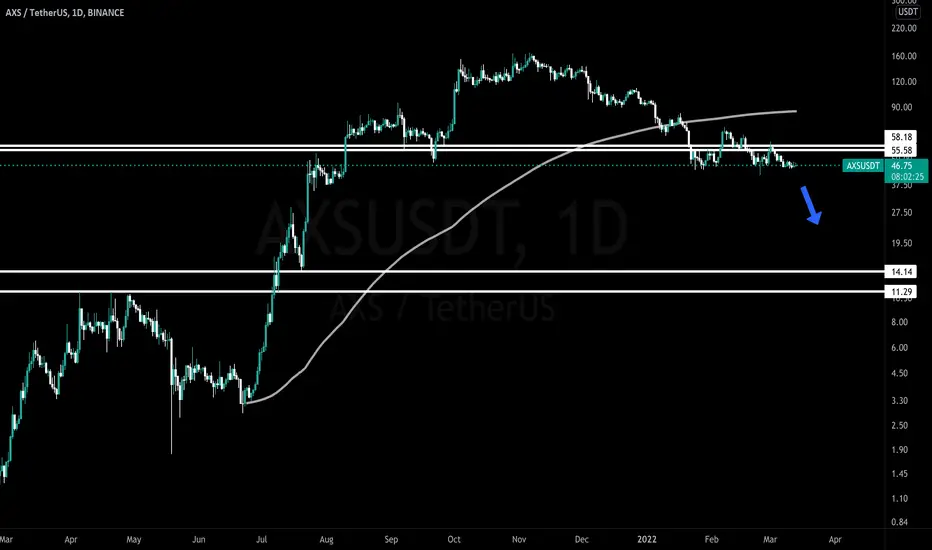
axs and qm pattern formationHello friends
Due to the condition of the axes and the formation of the qm pattern, there is a possibility of falling to the specified area
This is a personal opinion and is not a buy or sell offer

HBAR make bullish pattern BINANCE:HBARUSDT
Keep eyes on it 👀🕵️👁️
Don't forget Financial management and step
by step purchasing 💹💰💵💲
Please fallow me 🙏🥺
Please leave comments 🗨️💬
Like and share with your friends 👍💑
I hope you enjoy ☺️🌈🎉🎊🎁


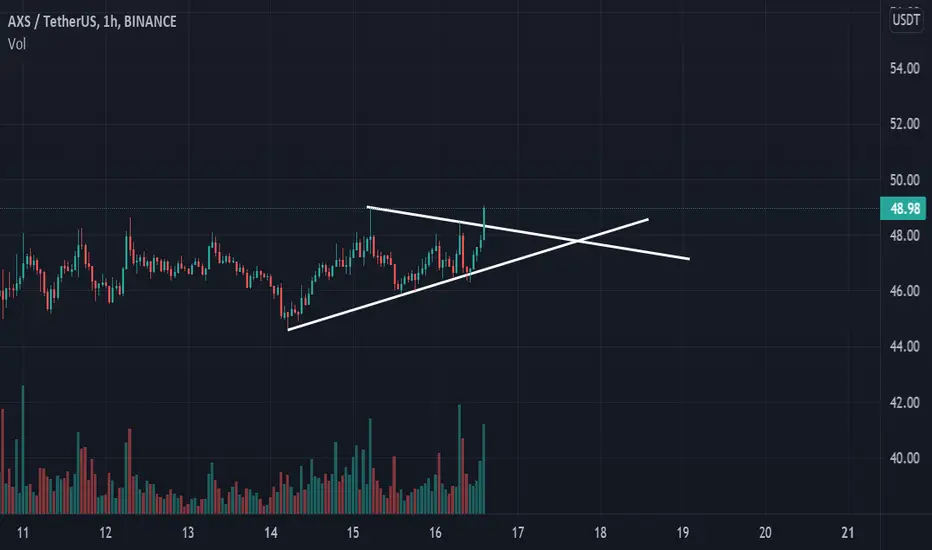
AXS/USDT 1HrGOT BREAKOUT AT 1HR CANDLE FOrmed SYMMETRIC TRIANGLE .Lets if the candle close 1hr with good volume we can long this Trades.(ITS NOT FINANCIAL ADVISE ONLY FOR EDUCATIONAL PURPOSE)
Trading strategy for AXSUSDT .Trading strategy for AXSUSDT .
This strategy utilizes fear and greed index at alternative.me
Why Measure Fear and Greed?
The crypto market behavior is very emotional. People tend to get greedy when the market is rising which results in FOMO (Fear of missing out). Also, people often sell their coins in irrational reaction of seeing red numbers. With our Fear and Greed Index, we try to save you from your own emotional overreactions. There are two simple assumptions:
Extreme fear can be a sign that investors are too worried. That could be a buying opportunity.
When Investors are getting too greedy, that means the market is due for a correction.
Therefore, we analyze the current sentiment of the Bitcoin market and crunch the numbers into a simple meter from 0 to 100. Zero means "Extreme Fear", while 100 means "Extreme Greed". See below for further information on our data sources.
UNDERSTANDING THE METRICS AT TRADING VIEW
Maximum Drawdown
The maximum drawdown metric refers to the "worst-case scenario" for a trading period. It measures the greatest distance, or loss, from a previous equity peak.5
What is a Good Profit Factor?
Any ratio greater than one means we can earn more than we lose. So, technically:
A factor higher than 1 denotes a winning system.
A factor lower than 1 denotes a losing system.
Percent Profitable
The percent profitable metric is also known as the probability of winning. This metric is calculated by dividing the number of winning trades by the total number of trades for a specified period.
See profit report below.

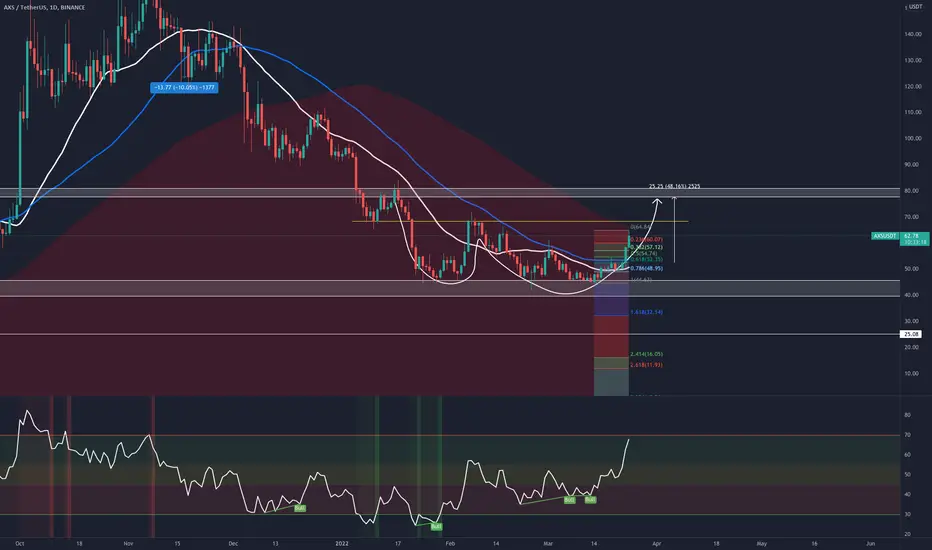
AXSUSDT | Long/BuyMy Argument:
1. zig-zag correction is over
2. Hit the support
3. try to make an impulsive wave
4. RSI Divergence
5. Fib 76.40%
SL 47.14
TP1 65.00
TP2 89.5
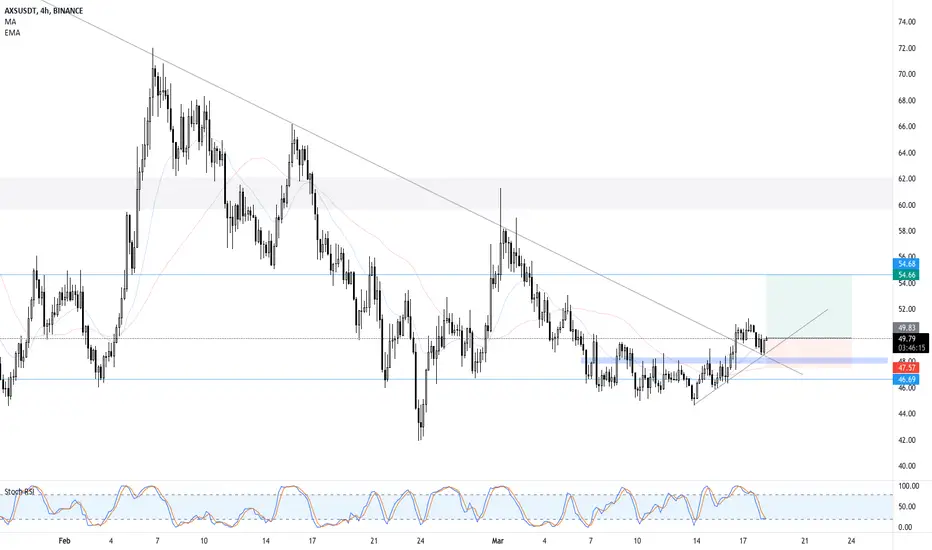
AXS, trendline BREAKOUT with potential target!Axie Infinity (AXS), the top Game-Fi crypto token, is in a downward trend.
A trend line has formed on the chart and the price is starting to squeeze under it. This, of course, shows the strength of the bulls.
Also, a descending wedge has formed on the chart, which is a bullish pattern.
A possible target for this movement is the key level of $49.50, where a good chance to close your long position.
Friends, press the "like" button, write comments and share with your friends - it will be the best THANK YOU.
P.S. Personally, I open an entry if the price shows it according to my strategy.
Always do your analysis before making a trade.

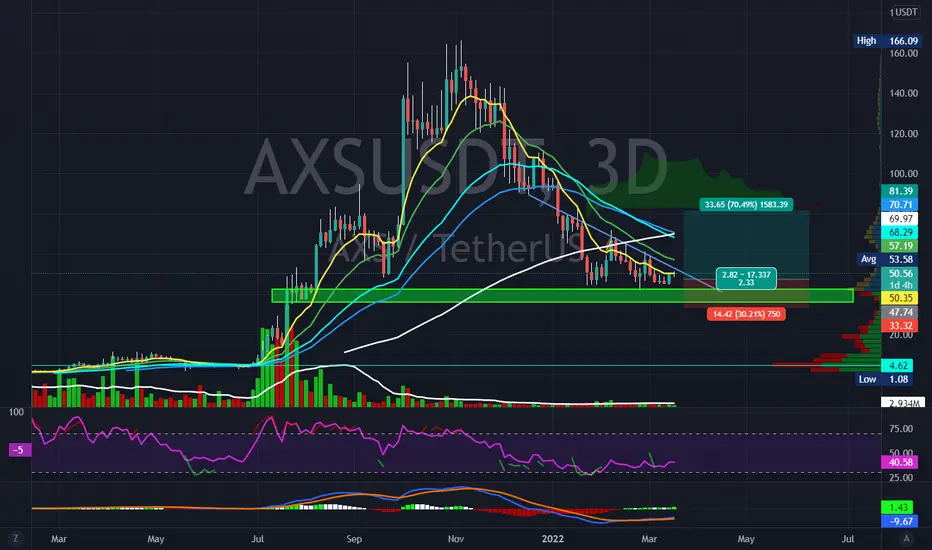
AXS TA [LONG TERM]AXS one of the best assets now in the market fired a sell signal in weekly chart as investor this is the moment to start cashing out.
This asset born in the bull market.. I am expecting a significant correction if 125 level breaks.
Targets:
70 usd or lower if EMA 55 breaks in weekly.

new analyze about AXSI decide to analyze AXS again...
I expect, after seeing the range of .40, we'll see a 5-wave uptrend to the $60 range.
