Axie Infinity (AXS) Buy ZoneAxie Infinity (AXS) Buy Zone
--------------------
BIAS
Mid-Term : Bullish
Risk : Medium
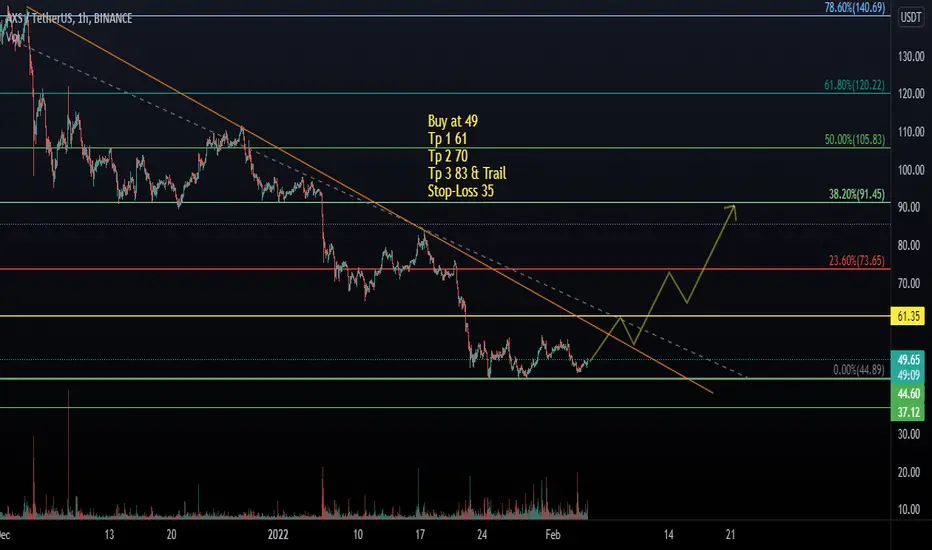
Axie Infinity broke above and retested our trendline, showing the market is short-term gaining bullish momentum and strength. If the retest gets successful, we would be heading to at least target 3 in short-term.
--------------------
$AXS/USDT LONG SETUP
Leverage : x3 - x5
Entry Price : 63 - 67
TP 1 : 69.25
TP 2 : 73
TP 3 : 77.75
TP 4 : 82
TP 5 : 87
TP 6 : 91.5
TP 7 : 97.5
TP 8 : 107
Stop Loss : 56.25
*Maximum 3% of Portfolio.
*Unload 12.5% at each TP. Whenever TP 2 hits, Move stop loss to entry.
--------------------
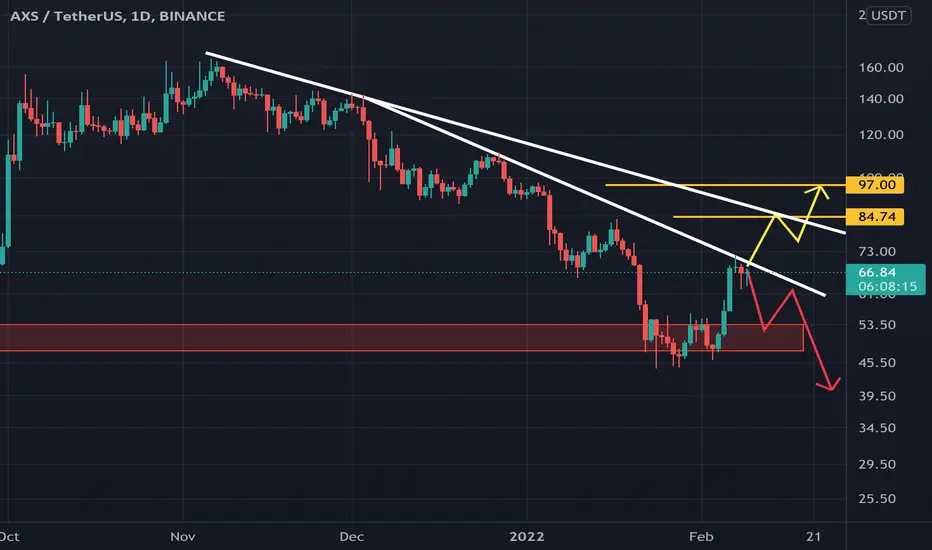
AXSUSDT

AXSUSDT 1D ; Bullish If Breaking AXSUSDT If the trend line specified in the chart is broken, the price is likely to increase up to the specified points, otherwise it is to fall to support and lower.
@AtonicShark
⚠️ This Analysis will be updated
⚠️ DYOR
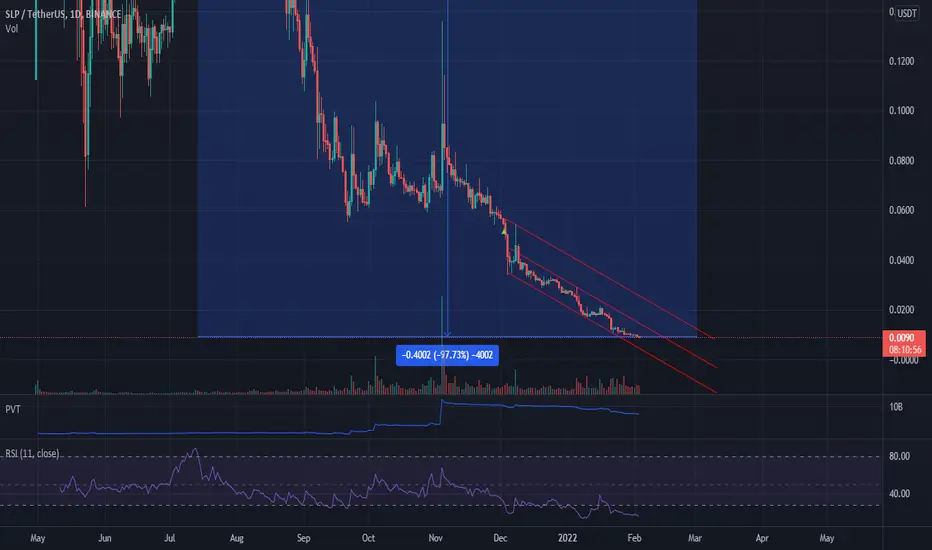
SLP trading ideaIt's been probably 1.5 year + since I made trading analysis on $slp $eth trading pair. Now I am back.
SLP is impossible to chart. Why? Because Its highly inflationary and currency is meant to be a reward for $AXS game players. Because of it's super inflationary nature #slp shouldn't be held LONG term
...unless something changes on its fundamental level.
This is trading channel. Could fall to 0.005$ or rise to 0.012 or even above 0.02$ per $slp. Who knows. This shitcoin that shouldn't even be traded on such exchanges as #binance, #bitstamp or any other reputable exchange in fact. It's not fair to noobs (or anyone in that matter). 98% loss within half a year???
AXIE INFINITY UPCoin: Axie Infinity
Type of signal : Spot
Entry Price : 60$-70$
Price now : 68.5$
Goals:
Tp1 72.4$
Tp2 81.19$
Tp3 89.17$
Tp4 96.75$
Tp5 105$
Tp6 121$
Long-Term
125$-135$-150$-170$-200$-250$
SL Hold

axsusdti good opportonity to long from here
axs with good news
and near trendline
hope you enjoy trading with us
don't forget like and comment below

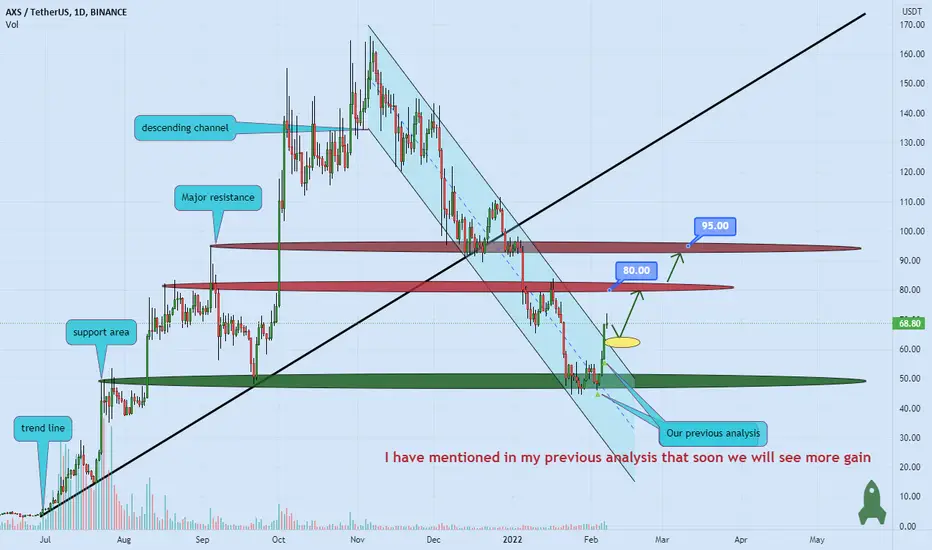
AXIE INFINITY gain 🚀As I mentioned in my previous analysis ✔️
the price has started to gain from the support area middle of the channel and breaks the channel resistance to the upside 💣🐳💣
and now
we expect more gain for the price and our targets are located on the chart 🚀
on the other hand
this coin has fundamental sign for gain 📖
and
the yellow zone on the chart is based on the Fibonacci levels ✔️
This is not financial advice, always do your own research.
Please, feel free to ask your question, write it in the comments below, and I will answer.
🐋
AXS.A good consolidation at the support level (45-53$) it gave a breakout of the trendline this could be possible trend reversal.

$AXS, Looks interesting $AXS
Strongest green candle since October
Strongest daily volume since November
UCTS flashing a 1D Buy (prior signals stats at the bottom)
#AXS

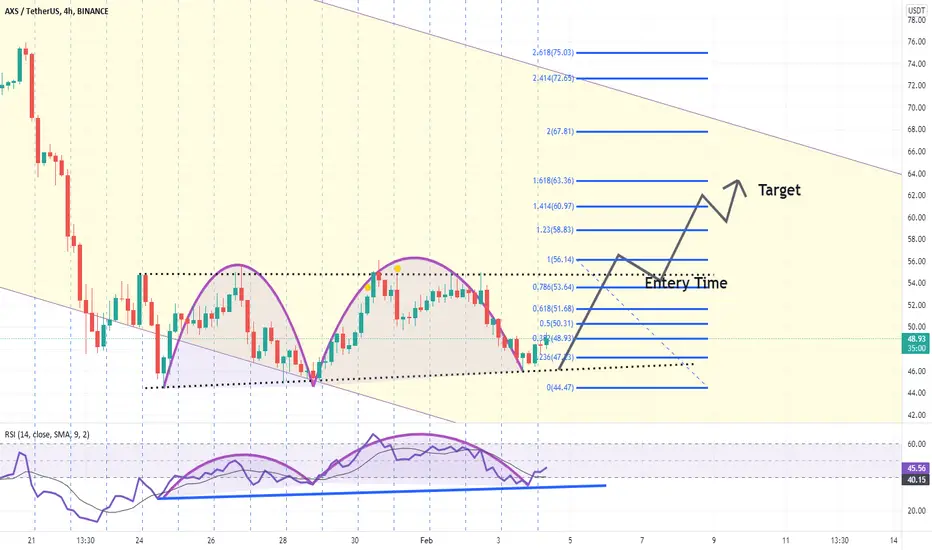
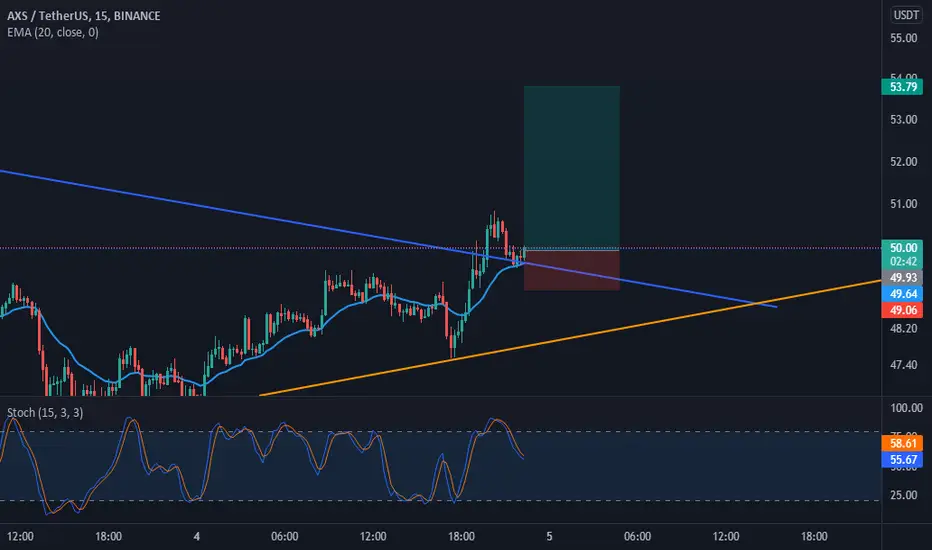
AXSUSDT 4HOUR CHART Triple Bottom Chart Partner AXSUSDT Coin formed a triple bottom Setup in 4hours Chart
1= a triple bottom Setup broke out from $55 trend line resistance. so this setup active when break 55 level
2= The difference between the third bottom and the breakout point was about $10
3= which translated to a take-profit point of around $61 & $65 n the upside.
4= The stop-loss point could have been placed at around $45.50 to limit downside risk as well.
Hope you like the Chart Setup
Do hit the like button if you like it and share your charts in the comments section.
~ Attention : this isn't financial advice we are just trying to help people on their own vision.
~ Happy Trading ~~
Thank you !
Namaste .
Long-Term Picture of Axie InfinityHey there.
Accurate reactions to this channel leads me to believe that Axie Infinity is moving inside these parallel channels. If so, AXS might have started a new move.
Targets? I do hope AXS/USDT returns to upper channel and if that happens, targets like 400 would be in sight. This would of course take quite some time to happen, but short-term targets are exciting as well. Let's discuss those in another post.
Let's discuss what you think about AXS/USDT in comments.
Cheers.

AXIE INFINITY long position 🚀Based on the chart, price stick in descending channel ✔️
and
has started to gain from channel support and support area ✔️
so
we expect more gain for the price at least to channel resistance and if the price breaks the channel resistance we can see more gain 🚀
and
our first target is $95 🚀
if
the price breaks the $95 and round number of $100 and stays above these levels, we can expect more gain 🚀
and
our next target is $150 🚀🚀
This is not financial advice, always do your own research.
Please, feel free to ask your question, write it in the comments below, and I will answer.
🐋

AXSUSDTa breakout at good support
when good news come from this coin
risk to reward more than 4/1
hope you enjoy trading with us
don't forget to like and comment below
Do not Buy the Dip on AXS yet !!No Investment Advice.
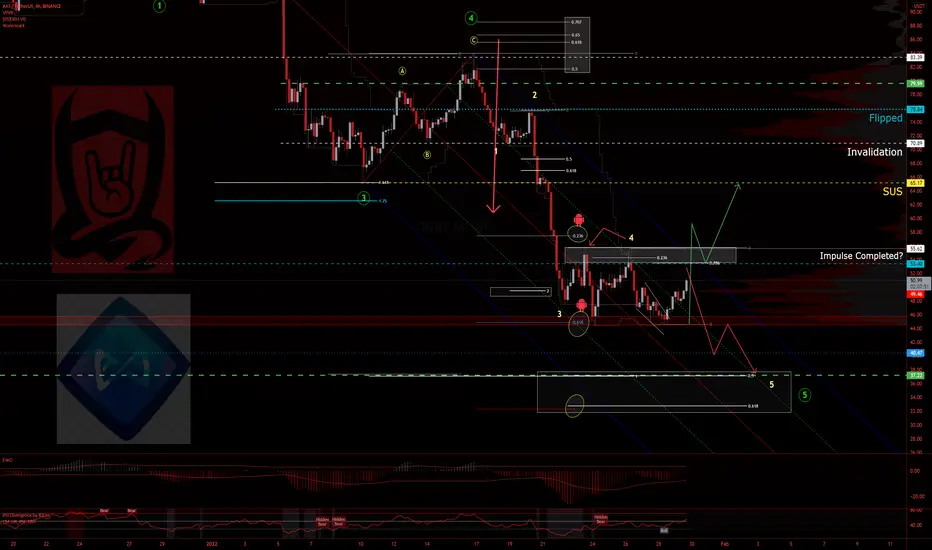
AXS looked amazing when it was making its minor degree impulse. Wave 3 was massive in relation to wave 1. Wave 3 finished very close to fibb level shown in purple. And a usual wave 4 Triangle structure. Wave 5 spot on fibb level. Usually wave 5 is .618 of wave 1+3 but in this case it finished 1 level lower suggesting upcoming weakness in the trend.
Now it has been selling off with the market. But the most worrying thing is that it has managed to make a lower low invalidating possibility of wave 3.
If you are holding bags i wish you good luck with that. If i were you i will do a solid fundamental analysis. And if i come to a conclusion that this project has future i will DCA. My next entry will be 20.50 and next level 5. Based on fibb level as shown below-

Axie infinityI don't want to sound negative, but what's the idea behind axie? How sustainable is it. Well from the charts price is going down. ( Obviously this correction or should I say change in major trend is soo... Cold. Brace yourself for next level around $36 area. Or could there be a turn around zone? Not anytime soon I guess 🙂

AXIE INFINITY time to gain 🚀Based on the chart, price stick in descending channel ✔️
but now
become close to channel support and support area ✔️
so
we expect gain for the price at least to channel resistance and if the price breaks the channel resistance we can see more gain and our first target is $95 🚀
if
the price breaks the $95 and round number of $100 and stays above these levels we can expect more gain and our next target is $150 🚀🚀
This is not financial advice, always do your own research.
Please, feel free to ask your question, write it in the comments below, and I will answer.
🐋

AXS responding to 45$Got the move down I was looking for, and now it reacted to 45$ a couple times here with some interesting Elliott Wave patterns at the end there. BUT I am waiting for a break of the range here with at retest, throw back here.
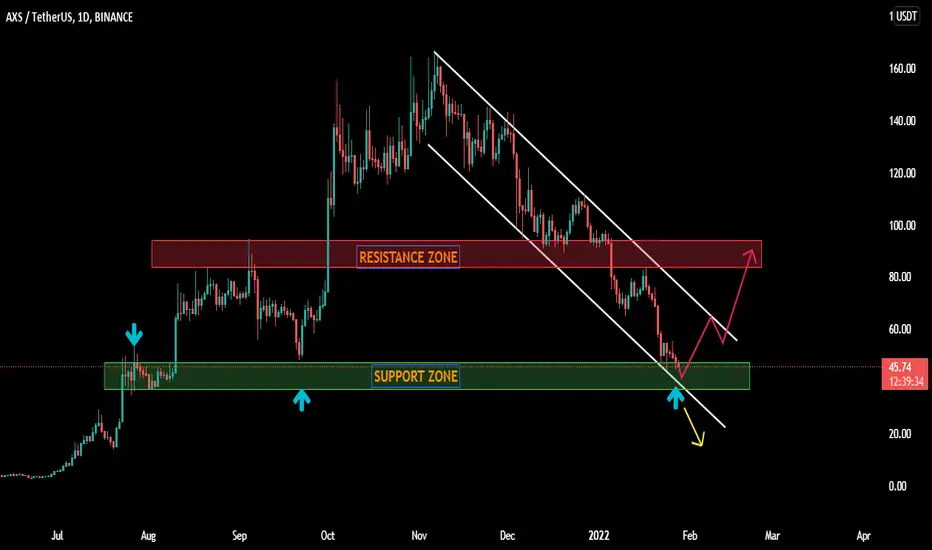
AXS MIDTERM LONG SENARIOHi Everyone . Today I'm Checking the Axie infinity Chart and im so supprised beccause now supporting in the Green Zone , So if you check the Previous move you see if the Trendline Break We Are going to the moon and expect to see 80$ for mid term , but if lost the Support we are going down , btw you should do it with your own risk and money management , ITS NOT FINANCIAL ADVICE !

AXSUSDT - SETUPAXSUSDT price dropped 70% from its high, moved into a descending parallel channel, and now reached at a strong support zone. This area needs to be honored by bulls. They need to react if they want to reclaim their position back, if they succeed then we can see a good rally towards 60.00
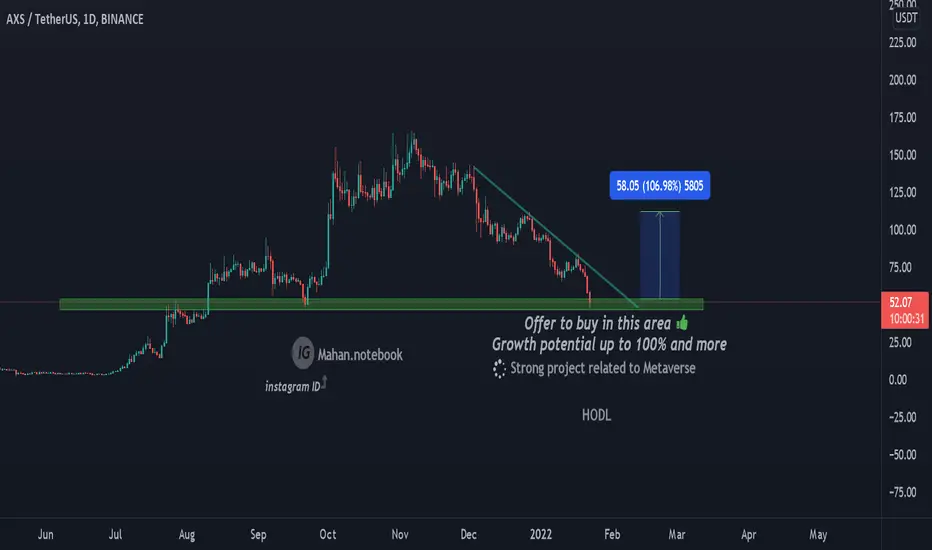
AXSUSDT GOOD PRICE FOR BUY Do not missBINANCE:AXSUSDT
check this analysis and don't miss.
good place for buy and hodl .
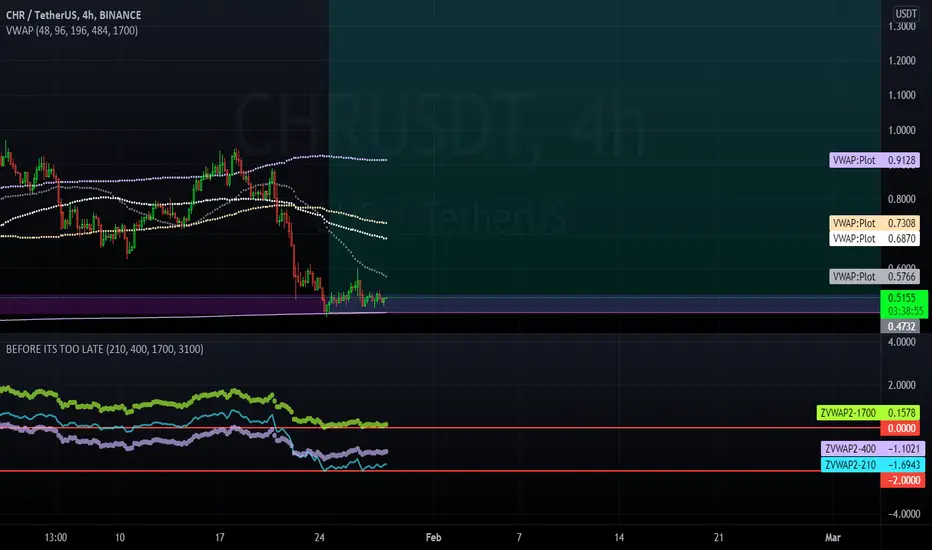
Beware of $SLP McDonald's Pattern to 1cent
Classic double top - time to get that McDonald's application ready, players.
