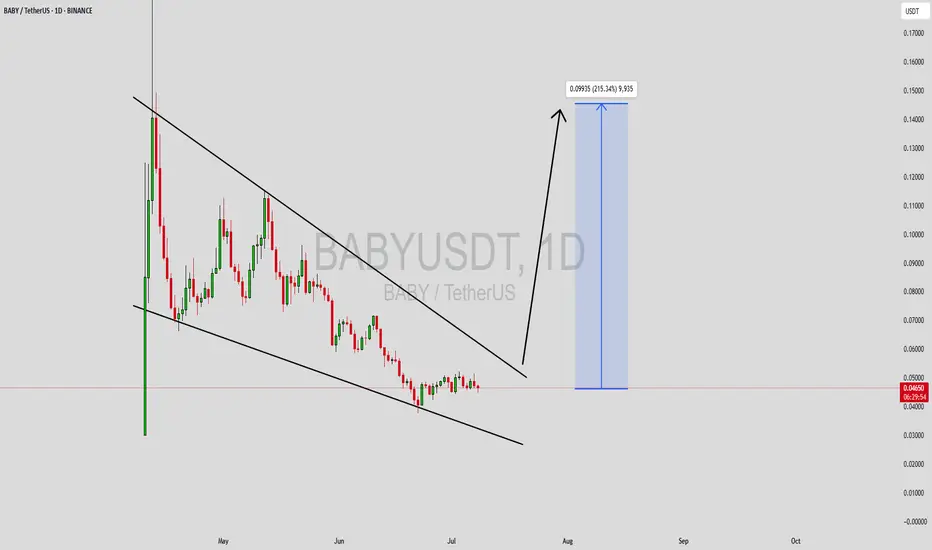
BABYUSDT Forming Falling WedgeBABYUSDT is showing an exciting setup for traders and investors alike, as it forms a clear falling wedge pattern on the chart. This classic bullish reversal pattern often signals that downward momentum is exhausting and a powerful breakout could be on the horizon. Based on this setup, BABYUSDT holds the potential to deliver substantial gains in the range of 190% to 200%+, making it one of the most attractive altcoin plays to watch right now.
One of the key factors strengthening this breakout thesis is the consistent and healthy volume profile supporting this pattern. A falling wedge breakout accompanied by strong volume is a reliable sign that buyers are stepping in aggressively, fueling the momentum required to push prices higher. As more investors take notice of this breakout opportunity, the probability of a sustained rally becomes increasingly likely.
Additionally, the BABYUSDT project continues to gain traction among retail and institutional investors, with growing community interest and active social buzz. This surge in investor sentiment can create a positive feedback loop, driving more accumulation and helping the coin achieve its projected upside targets. The combination of technical precision, supportive volume, and investor enthusiasm makes BABYUSDT a compelling candidate for any crypto watchlist.
✅ Show your support by hitting the like button and
✅ Leaving a comment below! (What is You opinion about this Coin)
Your feedback and engagement keep me inspired to share more insightful market analysis with you!
BABYUSDT
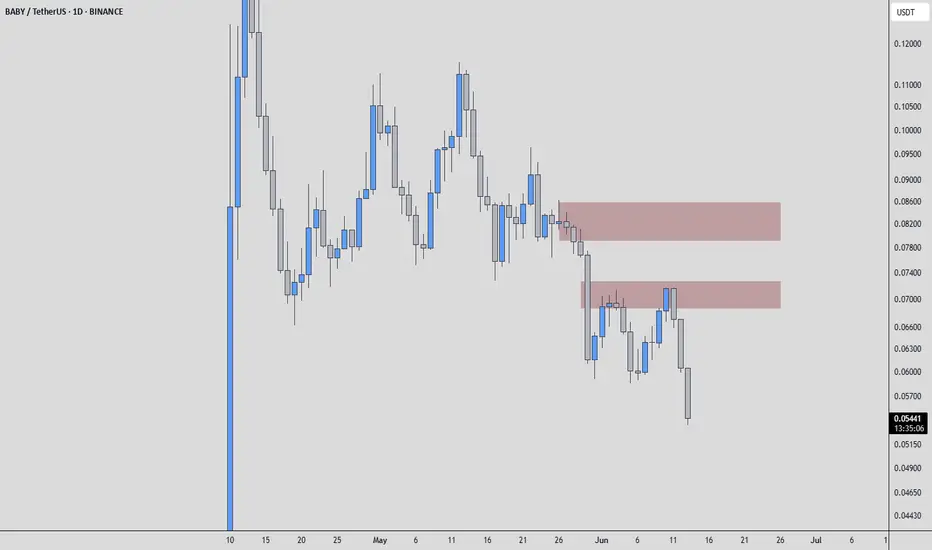
BABYUSDT: Weakness Confirmed, Short Opportunities AheadMy current read on BABYUSDT is clear: the price is showing significant weakness. This isn't a market where buyers are showing up with conviction; quite the opposite.
Because of this undeniable weakness, both red boxes I've marked on the chart are areas I'm keenly watching for short opportunities. These zones represent resistance where sellers are likely to step in aggressively.
My approach here is systematic. I'll be meticulously looking for confirmation of this bearish bias:
Volume Footprint: I'll be scrutinizing the volume footprint for signs of distribution or absorption by sellers. A lack of genuine buying absorption as price approaches or attempts to break these red boxes would be a critical signal.
CDV (Cumulative Delta Volume): I'll be looking for CDV to confirm this weakness, ideally turning and staying negative. A bearish divergence, where price attempts to rise but CDV falls, would further validate the short thesis.
Low Timeframe (LTF) Confirmations: On the lower timeframes, I'll be awaiting decisive breakdowns. This means seeing price fail to hold levels, retest them as resistance, and continue lower with conviction. Failed breakouts above the red boxes, quickly reversing back inside, are also key signals.
Remember, I exclusively focus on assets that demonstrate a sudden and significant increase in volume. While BABYUSDT's current context highlights weakness, understanding the underlying volume dynamics within that weakness is crucial for identifying profitable short setups.
Most traders often miss these subtle yet critical nuances, focusing only on the obvious. But you know that the true edge lies in dissecting these hidden market dynamics.
Keep a very close eye on these red boxes. If the bearish confirmations materialize, these could present clear, high-probability short entries. Don't be surprised if BABYUSDT's price action confounds the general market sentiment; my analysis suggests significant downside potential here.
📌I keep my charts clean and simple because I believe clarity leads to better decisions.
📌My approach is built on years of experience and a solid track record. I don’t claim to know it all but I’m confident in my ability to spot high-probability setups.
📌If you would like to learn how to use the heatmap, cumulative volume delta and volume footprint techniques that I use below to determine very accurate demand regions, you can send me a private message. I help anyone who wants it completely free of charge.
🔑I have a long list of my proven technique below:
🎯 ZENUSDT.P: Patience & Profitability | %230 Reaction from the Sniper Entry
🐶 DOGEUSDT.P: Next Move
🎨 RENDERUSDT.P: Opportunity of the Month
💎 ETHUSDT.P: Where to Retrace
🟢 BNBUSDT.P: Potential Surge
📊 BTC Dominance: Reaction Zone
🌊 WAVESUSDT.P: Demand Zone Potential
🟣 UNIUSDT.P: Long-Term Trade
🔵 XRPUSDT.P: Entry Zones
🔗 LINKUSDT.P: Follow The River
📈 BTCUSDT.P: Two Key Demand Zones
🟩 POLUSDT: Bullish Momentum
🌟 PENDLEUSDT.P: Where Opportunity Meets Precision
🔥 BTCUSDT.P: Liquidation of Highly Leveraged Longs
🌊 SOLUSDT.P: SOL's Dip - Your Opportunity
🐸 1000PEPEUSDT.P: Prime Bounce Zone Unlocked
🚀 ETHUSDT.P: Set to Explode - Don't Miss This Game Changer
🤖 IQUSDT: Smart Plan
⚡️ PONDUSDT: A Trade Not Taken Is Better Than a Losing One
💼 STMXUSDT: 2 Buying Areas
🐢 TURBOUSDT: Buy Zones and Buyer Presence
🌍 ICPUSDT.P: Massive Upside Potential | Check the Trade Update For Seeing Results
🟠 IDEXUSDT: Spot Buy Area | %26 Profit if You Trade with MSB
📌 USUALUSDT: Buyers Are Active + %70 Profit in Total
🌟 FORTHUSDT: Sniper Entry +%26 Reaction
🐳 QKCUSDT: Sniper Entry +%57 Reaction
📊 BTC.D: Retest of Key Area Highly Likely
📊 XNOUSDT %80 Reaction with a Simple Blue Box!
📊 BELUSDT Amazing %120 Reaction!
📊 Simple Red Box, Extraordinary Results
📊 TIAUSDT | Still No Buyers—Maintaining a Bearish Outlook
📊 OGNUSDT | One of Today’s Highest Volume Gainers – +32.44%
📊 TRXUSDT - I Do My Thing Again
📊 FLOKIUSDT - +%100 From Blue Box!
📊 SFP/USDT - Perfect Entry %80 Profit!
📊 AAVEUSDT - WE DID IT AGAIN!
I stopped adding to the list because it's kinda tiring to add 5-10 charts in every move but you can check my profile and see that it goes on..
BABY Looks Bullish (4H)Note: Given the corrective nature of the market, only consider entering this symbol within the green zone. Move to break-even at the first target.
According to the Baby structure, this symbol appears to be aiming to remain bullish.
From the point where we placed the (A) on the chart, expansion waves have started on this symbol.
As long as the green zone is maintained, the price can move toward the targets.
A daily candle closing below the invalidation level will invalidate this analysis.
For risk management, please don't forget stop loss and capital management
Comment if you have any questions
Thank You
