Deep Dive Into Bollinger Bands 🗓This article explores the Bollinger Bands indicator—a powerful volatility tool used by traders worldwide. You'll learn how it works, how to calculate it, and how to use it to detect potential breakouts, trend reversals, and overbought or oversold conditions in the market.
📚 Introduction to Bollinger Bands
In the fast-paced world of trading, understanding market volatility is key to making informed decisions. Bollinger Bands, developed by John Bollinger in the 1980s, offer a visual and statistical method to measure this volatility. Unlike simple moving averages, which only tell you the trend, Bollinger Bands expand and contract based on recent price action, helping traders spot overbought, oversold, or consolidation phases.
These bands dynamically adjust to market conditions, making them one of the most popular indicators for trend-following, mean-reversion, and breakout strategies. Whether you’re trading crypto, stocks, or forex, Bollinger Bands can help you identify high-probability setups by combining trend direction with volatility.
📚 How Bollinger Bands Are Calculated
Bollinger Bands consist of three lines:
Middle Band – This is a simple moving average (SMA) of the price, typically over 20 periods.
Upper Band – The middle band plus two standard deviations.
Lower Band – The middle band minus two standard deviations.
Middle Band = SMA(n)
Upper Band = SMA(n) + (k × σₙ)
Lower Band = SMA(n) - (k × σₙ)
Where σₙ is the standard deviation of the price for n periods and k is the multiplier, typically set to 2, which captures ~95% of price action under normal distribution. The middle band shows the average price over the last 20 candles. The upper and lower bands adjust based on how volatile the price has been — expanding in high volatility and contracting in low volatility.
🤖 For those traders who want to implement Bollinger Bands into algorithmic strategy we provide formula it's calculation in Pine Script:
basis = ta.sma(src, length) // Middle Band (SMA)
dev = mult * ta.stdev(src, length) // Standard Deviation × Multiplier
upper = basis + dev // Upper Band
lower = basis - dev // Lower Band
📚 How to Use MACD in Trading Strategies
⚡️Bollinger Band Squeeze (Volatility Contraction and Expansion)
The idea is pretty simple, а squeeze indicates low volatility and often precedes a breakout. The squeeze is the situation when the Upper Band and Lower Band contract, and BB width is at a local minimum. In this case you shall be prepared for the high volatility after the period of low volatility. This strategy doesn’t predict direction — it prepares you for volatility.
Long setup:
Price is in long-term uptrend, you can use 200 EMA as a major trend approximation - price shall be above it.
Bollinger Bands is narrow in comparison to the previous period. Price usually is in sideways.
Open long trade when candle shows a breakout and closes above the Upper Band.
Set a trailing stop-loss at the Middle Band.
Short setup:
Price is in long-term downtrend, you can use 200 EMA as a major trend approximation - price shall be below it.
Bollinger Bands is narrow in comparison to the previous period. Price usually is in sideways.
Open short trade when candle shows a breakdown and closes below the Lower Band.
Set a trailing stop-loss at the Middle Band
📈Long Trading Strategy Example
1. Price candle shall be closed above 200-period EMA. In our example we have BITMART:BTCUSDT.P 4h time frame.
2. Bollinger Bands shall be narrow in comparison with the previous periods.
3. Open long trade when candle closes above the Upper Band.
4. Close trade when price touched the Middle Band.
📉Short trading strategy example
1. Price candle shall be closed below 200-period EMA. In our example we have BITMART:BTCUSDT.P 4h time frame.
2. Bollinger Bands shall be narrow in comparison with the previous periods.
3. Open short trade when candle closes below the Lower Band.
4. Close trade when price touched the Middle Band.
⚡️Mean Reversion (Rebound from the Bands)
This is the most common approach to use Bollinger Bands. The idea is also very simple, we just want to open long if price touches Lower Band and short if price reaches Upper Band. Price tends to revert to the mean (Middle Band), especially in range-bound markets. It's very important to trade in the direction of the major trend to reduce the probability of the large move against you.
Long setup:
Price is in long-term uptrend, you can use 200 EMA as a major trend approximation - price shall be above it.
Open long trade when price touches the Lower Band.
Set the initial stop-loss at the fixed percentage below entry price. Choose this percentage number with your personal risk/money management, you shall be comfortable to lose this amount of money in case of stop-loss hit.
If price reached Middle Band set stop-loss at breakeven.
Close trade when price reached the Upper Band.
Short setup:
Price is in long-term downtrend, you can use 200 EMA as a major trend approximation - price shall be below it.
Open short trade when price touches the Upper Band.
Set the initial stop-loss at the fixed percentage above entry price. Choose this percentage number with your personal risk/money management, you shall be comfortable to lose this amount of money in case of stop-loss hit.
If price reached Middle Band set stop-loss at breakeven.
Close trade when price reached the Lower Band.
🧪 Important: the most common approach to close trades is the Middle Band touch, this is classic mean reversion. We experimented multiple times with different approached and revealed that usually it's better to take profit at the Upper/Lower band for long/short trades and use Middle Band only for setting stop-loss at breakeven. This approach provides better risk to reward ratio.
📈Long Trading Strategy Example
1. Price candle shall be closed above 200-period EMA. In our example we have BITMART:BTCUSDT.P 4h time frame.
2. Open long trade the Lower Band.
3. Put Initial stop-loss 2% below the entry price.
4. When price reached Middle band place stop-loss at the breakeven.
5. Close long trade at the Upper Band.
📉Short trading strategy example
1. Price candle shall be closed below 200-period EMA. In our example we have BITMART:BTCUSDT.P 4h time frame.
2. Open short trade the Upper Band.
3. Put Initial stop-loss 2% above the entry price.
4. When price reached Middle band place stop-loss at the breakeven.
5. Close short trade at the Lower Band.
🧪 Important tip: notice that initial stop-loss is needed only to avoid disaster in case of price moves strongly against you. This percentage shall give enough space to avoid its reaching too often. Mean reversion strategy provides fast trades with the small average gain, so you shall maintain the high win rate (perfectly above 70%). You have to choose stop-loss based on particular asset volatility.
⚡️Combined Approach: Mean Reversion + Trend Following
Skyrexio made multiple researches about Bollinger Bands strategies and we found that we can receive better gains in combination of different approaches. Mean reversion gives you great entry with discount but you don't need to exit that early. Use the trading stop and allow to gain profit while market is moving in your direction.
This approach you can find in our advanced strategy Bollinger Bands Enhanced Strategy which we shared in 2024. Click on the link to read about it and understand how you can combine best features of this popular indicator.
📚 Conclusion
Bollinger Bands are more than just a volatility indicator — they provide a flexible framework for understanding price dynamics and market conditions. By visualizing the relationship between price and standard deviation around a moving average, traders can gain valuable insights into whether an asset is consolidating, trending, or preparing for a breakout.
The real strength of Bollinger Bands lies in their versatility. They can adapt to different trading styles — whether you’re a short-term scalper, a swing trader, or a long-term position holder. From identifying squeeze setups to riding strong trends or capturing mean reversion moves, BBs offer a strategic edge when used correctly.
However, Bollinger Bands should never be used in isolation. Like any technical tool, they work best when combined with momentum indicators like RSI or MACD, volume analysis, and price action signals. Context is key: a signal that works well in a ranging market may fail during high momentum trends.
Ultimately, Bollinger Bands help traders make more informed, disciplined decisions by clarifying where price stands relative to recent history. When paired with sound risk management and broader market awareness, they become a powerful ally in navigating market uncertainty.
Bands

#BAND/USDT#BAND
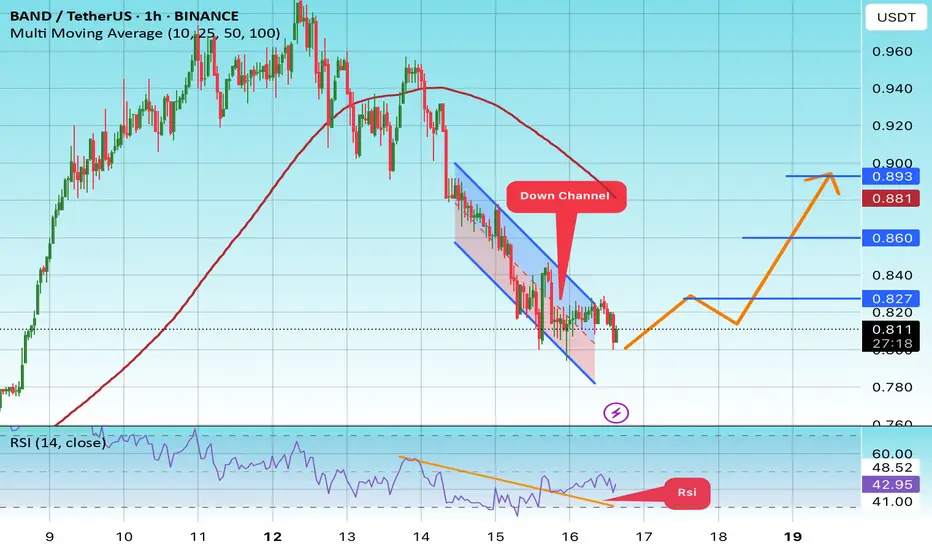
The price is moving within a descending channel on the 1-hour frame and is expected to break and continue upward.
We have a trend to stabilize above the 100 moving average once again.
We have a downtrend on the RSI indicator that supports the upward move with a breakout.
We have a support area at the lower limit of the channel at 0.04400, which acts as strong support from which the price can rebound.
Entry price: 0.810
First target: 0.827
Second target: 0.860
Third target: 0.893
#BAND/USDT#BAND
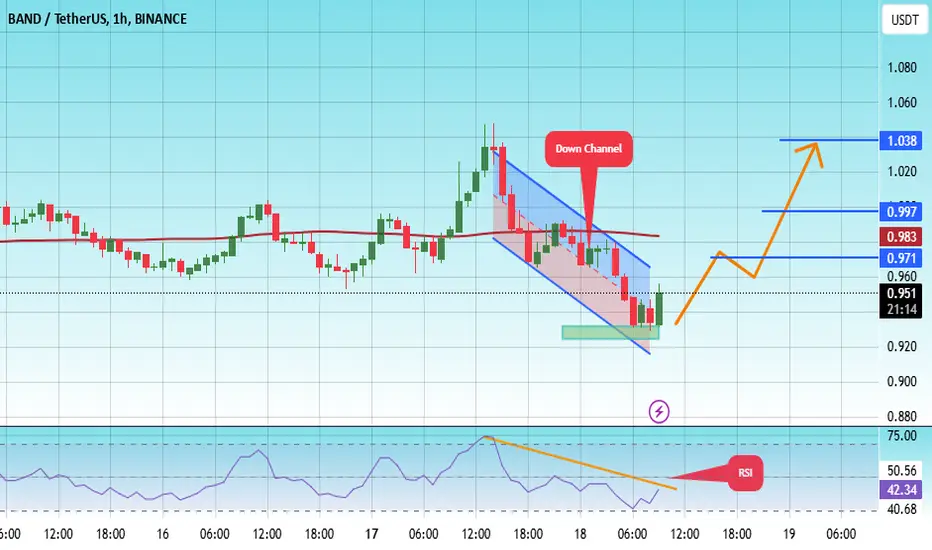
The price is moving in a descending channel on the 1-hour frame and is adhering to it well and is heading to break it strongly upwards and retest it
We have a bounce from the lower limit of the descending channel, this support is at a price of 0.926
We have a downtrend on the RSI indicator that is about to break and retest, which supports the rise
We have a trend to stabilize above the moving average 100
Entry price 0.940
First target 0.970
Second target 0.997
Third target 1.038
JUNO: Signs of a Trend Reversal? Key Indicators Align!It looks very much as though JUNO is showing promising signs of a trend reversal. What I mean by this is a breach of the upper trend line, which may only be a matter of time. We have a very strong indication from volume with the wonderful large green bars we're seeing, a 'pinch' in the Bollinger bands and a very tiny, but hugely important 'up ward pointing' signal line within the MACD. As always, use many indicators to create a 'cocktail' of methods which adds to the strength of your decision making. Due to low liquidity, I'm not going in. But, take don't fall foul to FOMO here. Just because it's seen a spike, it doesn't mean it's going to break out of the channel and continue up. Good luck. Follow for more.

#BAND/USDT#BAND
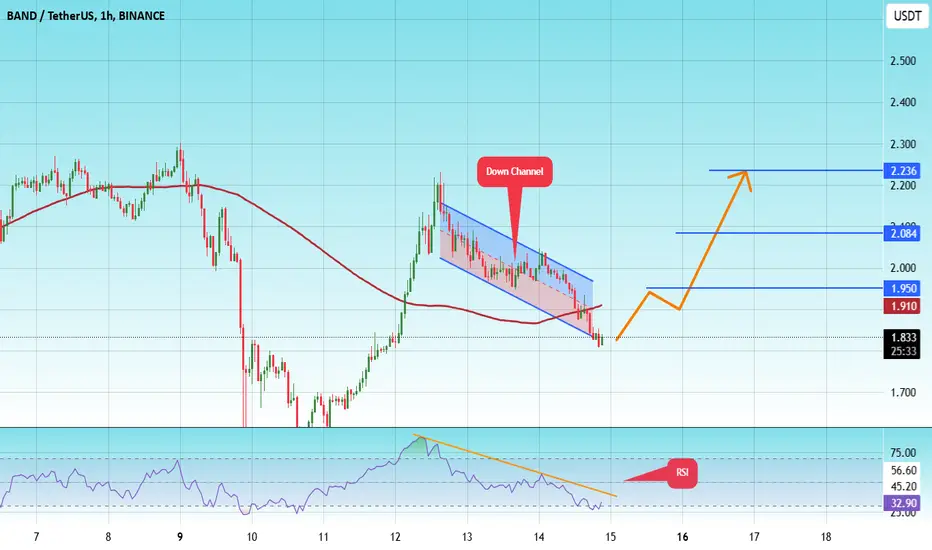
The price is moving in a descending channel on the 1-hour frame and is expected to continue upwards
We have a trend to stabilize above the moving average 100 again
We have a descending trend on the RSI indicator that supports the rise by breaking it upwards
We have a support area at the lower limit of the channel at a price of 1.80
Entry price 1.95
First target 1.95
Second target 2.08
Third target 2.23
XAUUSD: Buy when it falls back to the support rangeGold market fundamentals:
Affected by this week's US economic data, according to the CME FedWatch Tool, the market currently has a 55.5% probability of the Federal Reserve cutting interest rates by 50 basis points in September, down from the previous 70%.
The increase in geopolitical risks in the Middle East has led to an increase in safe-haven demand (it is not convenient to explain in detail here, you can learn about the latest Middle East conflicts on your own)
Gold market technical aspects:
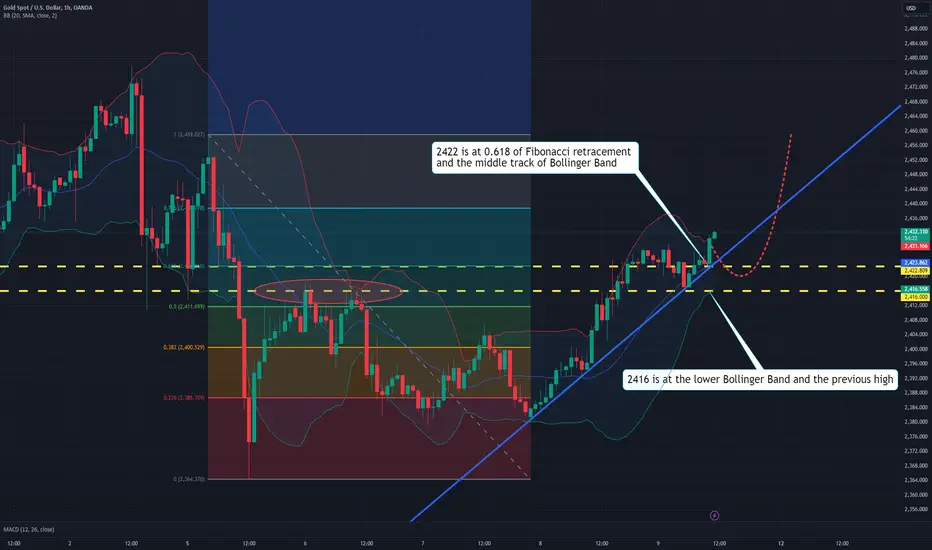
Yesterday I said that once the dense resistance range of 2411-2422 is broken, the potential for growth will increase. Now that the gold price has come above the resistance range, the dense resistance area has also turned into a dense support area. At the same time, this rebound has now formed an upward trend. If it can break through 2430-2440, then the gold price is likely to test the historical high again.
Trading strategy:
In the figure, 2416 is the previous high and the support of the lower track of the Bollinger Band. 2422 is the support of the middle track of the Bollinger Band and the Fibonacci retracement of 0.618. Therefore, I will buy if it falls back to the support range of 2416-2422 today, and I am bullish on 2430-2440.
Support range: 2410-2400
Resistance range: 2430-2440
Daily risk data: Canada's July employment (little impact)
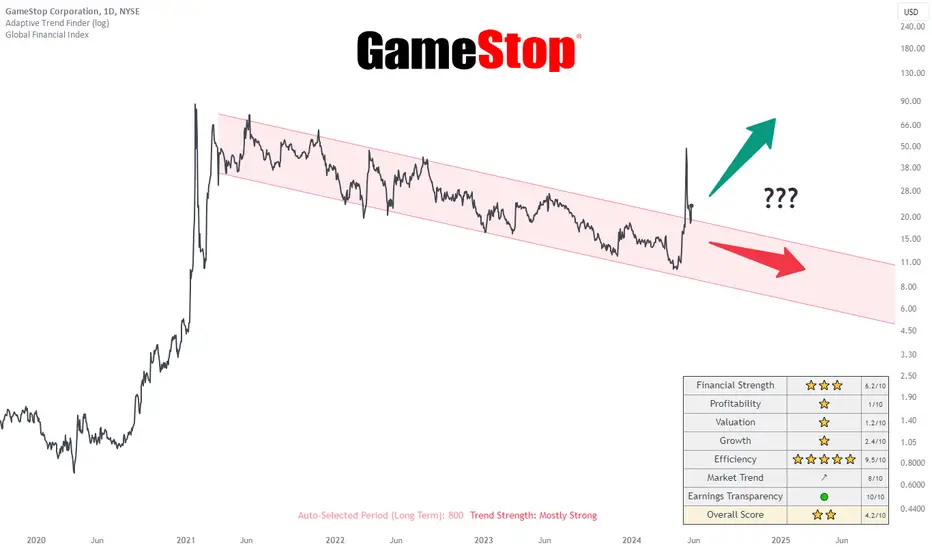
GameStop (GME): What Lies Ahead ?A pivotal moment as the stock breaks through the channel with a bullish surge, hinting at a potential shift in market sentiment. Here's a closer look:
Positive Indicators:
• Financial Resilience: There are signs that GameStop is gaining control over cash burn and losses, suggesting a possible turnaround in its financial stability.
• Margin Expansion Potential: Optimism brews around the prospect of improved margins, driven by a strategic shift towards higher-margin software sales and ongoing cost-saving initiatives.
• Strategic Capital Raise: GameStop's decision to capitalize on the recent share price surge by issuing shares at a premium indicates a proactive approach to bolstering its financial position.
Challenges and Concerns:
• Earnings Reality Check: Q1 results falling short of expectations raises questions about GameStop's ability to adapt to evolving market dynamics and meet investor demands.
• Management's Communication Strategy: Limited engagement with investors, marked by the absence of conference calls or Q&A sessions, fuels speculation about management's long-term vision and transparency.
• Sales Dynamics: A complex mix of declining hardware sales, shifting software preferences, and the rise of subscription services presents formidable challenges to GameStop's growth trajectory.
Navigating through this landscape of opportunity and uncertainty, investors are left to ponder whether this bullish surge marks a genuine turnaround or merely a temporary reprieve in GameStop's tumultuous journey.
Disclaimer: Market movements are inherently unpredictable. Always conduct thorough research and consider professional advice before investing.
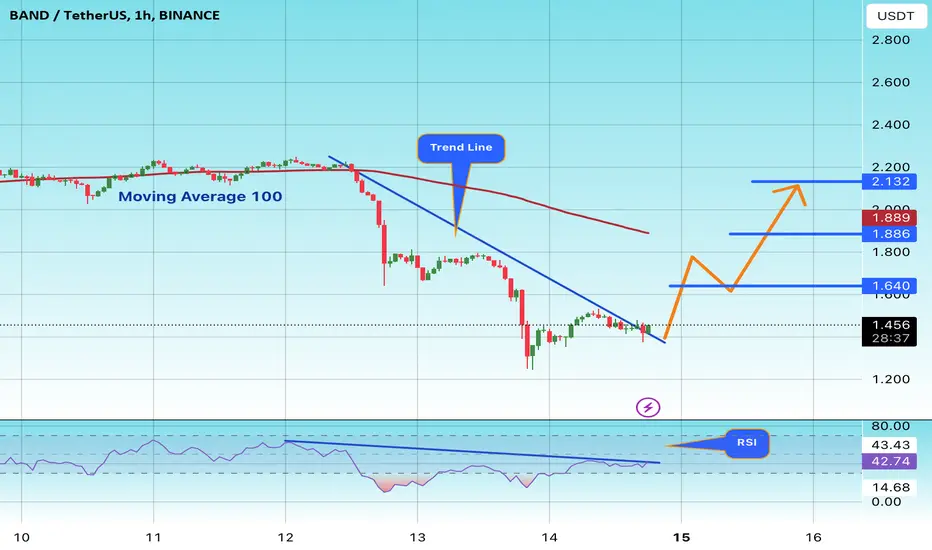
#BAND\USDT#BAND
'The price is moving in a downward trend on a 1-hour frame.
The price is moving within it and adhering to it to a large extent,
and it has just been breached. We have a tendency to stabilize above Moving Average 100.
We have a downtrend on the RSI indicator that supports the rise and has been broken to the upside
Entry price is 1.45
The first goal is 1.64
Second goal 1.88
Third goal 2.13
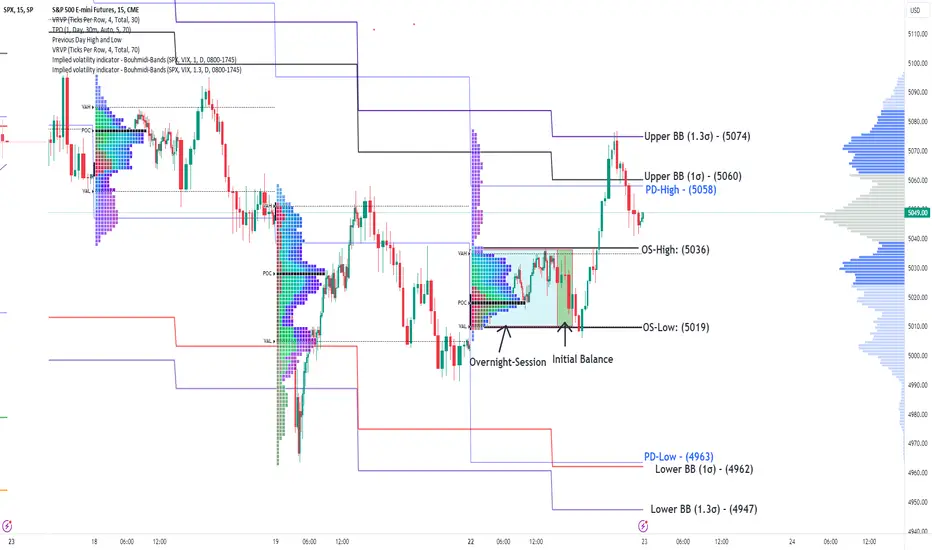
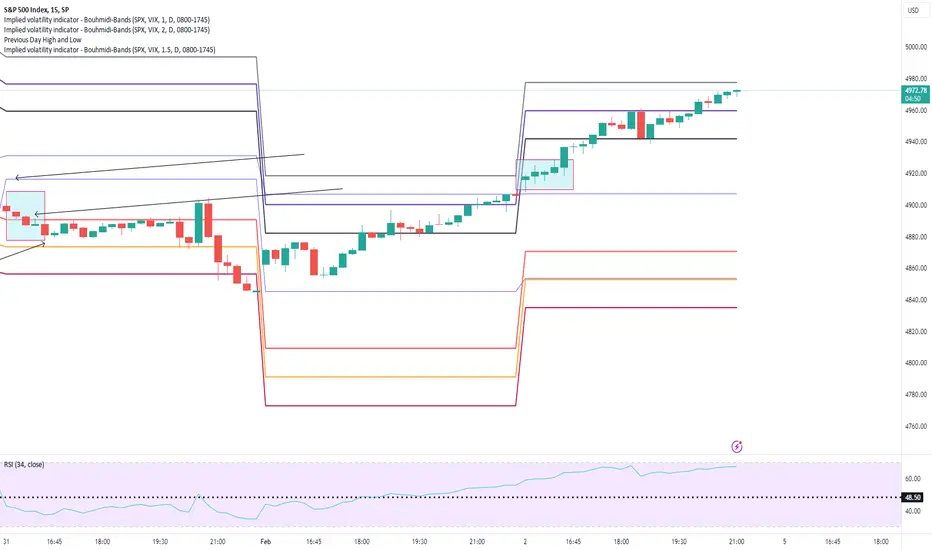
Bouhmidi-Bands and Overnight Session - Name of the Game The overnight range was the name of the game today. As mentioned earlier, we were looking for a potential break in either direction. After establishing the initial balance, we saw a test of the overnight session low (5019), which was successfully defended. Subsequently, buyers entered the market, leading to a push higher in $ES. This move broke the high of the overnight session (5036), confirming bullish momentum and surpassing the previous day high (5058) & upper #BouhmidiBand, reaching a peak at 1.3s BB (5074). In the last 1.5 hours, NYSE:ES retraced back within the Bouhmidi-Bands.
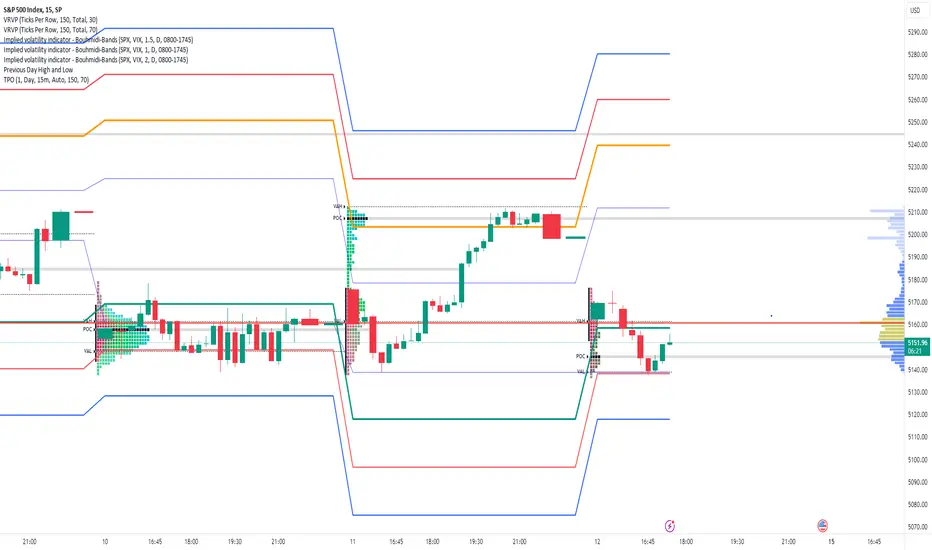
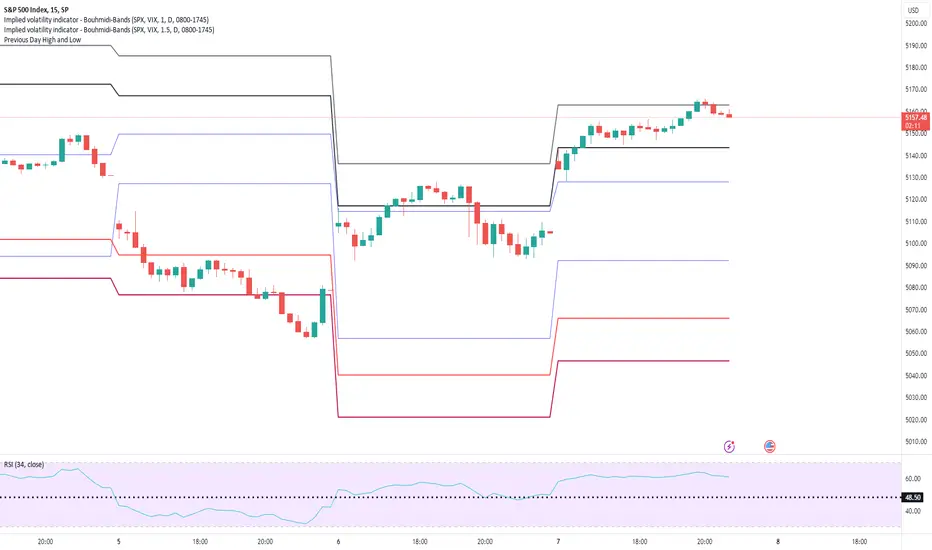
S&P 500: Bouhmidi-Reversal now with TPOAfter the initial balance, we see that the index continues its weakness and has broken through the 1 Bouhmidi-Bands and the point of control (POC) of Wednesday . Today, the previous day's low and the 1.5 Bouhmidi-Band converge at 5138. A test of 5138 is possible with even a reversal towards the BB range. I also now include TPO charts
SPX - Trendday Bull Put at lower Bouhmidi-BandSPX - Nice trend day in play. After defending previous day low we moved higher and breaking previous day high. Bull Puts on 1 + 1.5 sigma #BouhmidiBands working out fine today.

AVAX Kimbo Meme coin could of bottom out from hereLooking at the charts and volumes it done it's 3rd leg wave down in volumes (OBV chart at the bottom) and $0.0003992 US price could of been the next bottom for these waves. If so, Kimbo poised to be big for AVAX meme coin
The OBV volumes showing less selling presure now and good chance in the days ahead great buying pressure
Some of the fundamentals:
Avalanche Foundation Snaps Up KIMBO, COQ, and Three Other Tokens as First Meme Coin Investment
www.coindesk.com
I when to dexscreener to evaluate what moving fast for meme coins - dexscreener.com - Clicked on LIQUIDTY and when sort by descending order, Kimbo is number 2 spot. The number 1 spot doesn't have much value but Kimbo has long term potential for big gains
Their website is IMPRESSIVE!! So much community work on this meme coin A++ www.kimboavax.com
This the big one - they actually "burning" the "token supply" so Kimbo becomes more scarce. What think going to happen with the prices when reduce the token supply? Prices go up and up and faster!
If scroll down the bottom of the page for Kimbo website you see "Kimbo Merchandise" - These meme coins have VALUE! and can buy NFTs for it too
Fundamentals is good, AVAX team buying into this meme coin for exchange liquidity. Most likly be listed on KuCoin and then Binance. This has pretty good volumes too and I like the charts for this great opportunity
On twitter they going to expose this project to the masses on Facebook, Instragram i believe very soon. It has 18,000 twitter followers and can go pass the 50 to 100,000 followers
twitter.com
This poised to be the next Shib Inu, Dodge meme coin where billon and billon of dollars flood through this project
Do you like Kimbo, do you think it has so much potential?

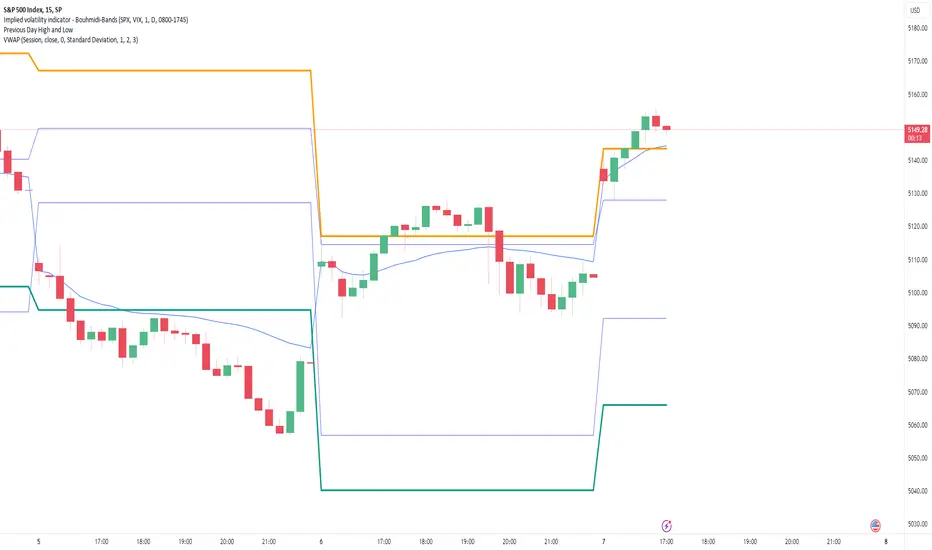
SPX: Bouhmidi-ReversalSPX starts with a gap-up and initially fails at the upper #BouhmidiBands. After the initial balance we have seen a breakout above upper Bouhmidi-Bands and now reverting back to bandwidth.
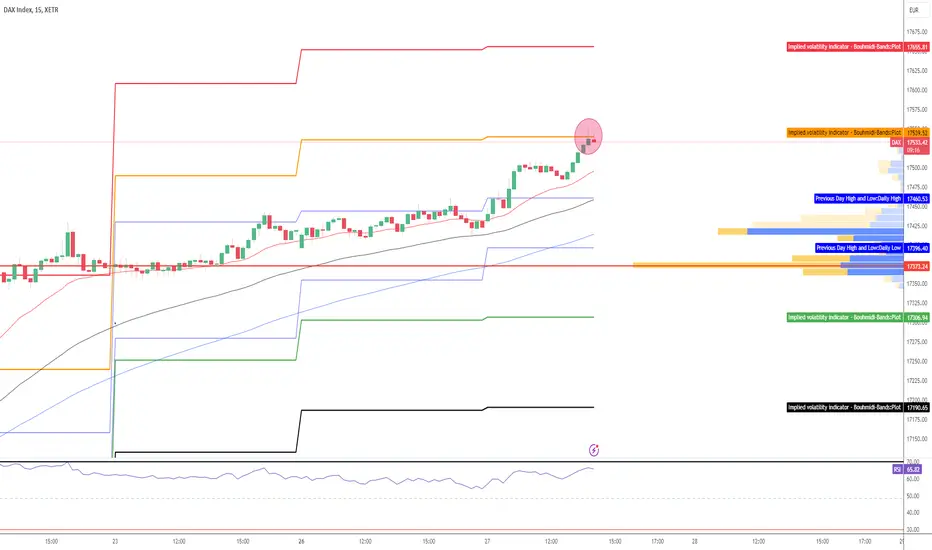
DAX testing Bouhmidi-Bands -TrenddayXETR:DAX update - New all-time high due to an expected test of the upper #BouhmidiBand. Attention trend day. A breakout should bring new impulses with the US opening.
S&P 500: Bouhmidi-Bands show new ATHsstarted around previous day high and is still trending sideways an hour after opening. A break above could continue the uptrend heading to new ATHs. Next target ist then upper #BouhmidiBands at 5028.

DAX - Gap close intraday XETR:DAX - The gap-up at the beginning was immediately closed again. Yesterday's previous day's range was almost completely filled. A fall below the previous day's low at 16859 could accelerate the downtrend intraday and target the lower #BouhmidiBand at 16784 next.

S&P 500 new all time highsS&P 500 one hour to go. New all-time-high in the pocket but as mentioned agressive bulls out there today. Trend was confirmed through couple of indications:
-starting above previous day high
-Break of upper Bouhmidi-Bands (1 & 1.5)
Currently we are close to 2nd upper BB - Here is where the party ends today.
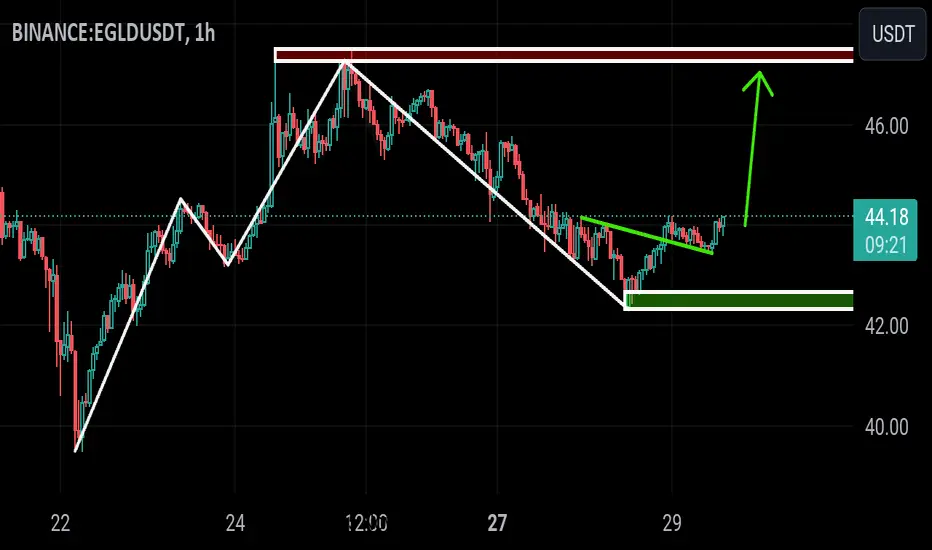
EGLDUSDT LONGTHIS IS NOT A FINANCIAL ADVICE
Conditions:
1.Fibonacci level:✅
2.Bollinger band:✅
3.Momentum:✅
4.Price action:✅
5.Volume:✅
6.1h tf:✅
7.4h tf:✅
8.1d tf:✅
APEUSDT SHORT This is not a financial advice
Conditions:
1. Fibonacci levels:✅
2. Bollinger bands:✅
3.Momentum:✅
4.Price action:✅
5.Volume:✅
6.1hr tf:✅
7.4hr tf:✅
8.1d tf:✅


BAND VOLUME INCREASEThank you for reading our update. Please remember that this is not advice for trading.
TRB Looks to have a new uptrend volume

SPX testing upper Bouhmidi-BandSP:SPX - Nice #BouhmidiBands reversal in play but watch out might see a pullback today
