BAND/USDT – Massive Trendline Breakout! Reversal Play!📌 Chart Overview:
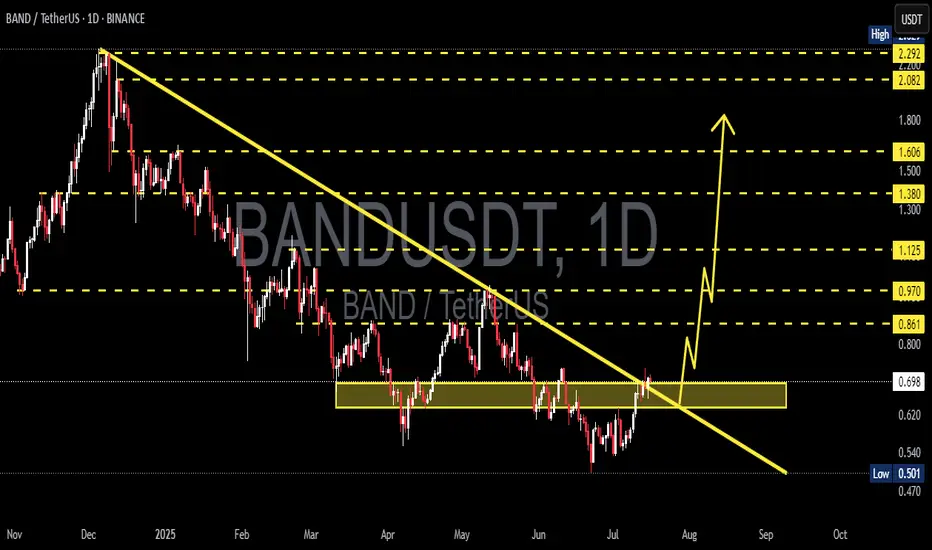
BAND/USDT has officially broken out from a long-term descending trendline that has suppressed price action for over 7 months. This breakout, confirmed with a bullish daily close above a key horizontal resistance zone ($0.68–$0.70), opens the door for a powerful trend reversal.
The structure signals the end of accumulation and the beginning of a potential markup phase, where volatility and volume often expand rapidly.
🔍 Technical Pattern Breakdown:
Falling Wedge Formation: A classic bullish reversal pattern formed after a prolonged downtrend. The wedge narrowed price volatility and concluded with a clean breakout to the upside.
Descending Trendline Breakout: The break of the major trendline marks a shift in control from bears to bulls. Historically, this is one of the strongest technical signals for a trend reversal.
Demand Zone Validation: The $0.60–$0.70 range has acted as a multi-month accumulation zone, with repeated rejections from the downside showing strong buyer presence.
✅ Bullish Scenario:
If BAND holds above the $0.68–$0.70 breakout zone, a strong bullish rally could unfold with the following upside targets:
1. TP1: $0.861 – Minor resistance, potential retest level.
2. TP2: $0.970 – Psychological resistance and historical flip zone.
3. TP3: $1.125 – Major horizontal resistance; a breakout from here could trigger FOMO buying.
4. TP4: $1.380–$1.606 – High-confluence zone from previous consolidation.
5. TP5: $2.08–$2.29 – Ultimate extension target aligned with macro resistance from November 2024 highs.
Each breakout above the target levels could lead to a short squeeze scenario, accelerating momentum.
⚠️ Bearish Scenario:
A failure to sustain above the $0.68–$0.70 level would invalidate the breakout and trap late buyers.
Breakdown back below the yellow zone could push price towards:
$0.60 – Key mid-support
$0.501 – The lowest support on chart; a break here would resume the downtrend.
Watch for volume divergence or fake-out signals on lower timeframes.
🧠 Market Psychology Insight:
This setup reflects a shift in sentiment. After a prolonged phase of apathy and seller exhaustion, smart money appears to be stepping in. The strong rejection from lows and breakout suggests early-stage bullish accumulation transitioning into public participation.
If volume increases along with upward price movement, it may confirm Phase C-D of a Wyckoff Accumulation, suggesting much higher upside.
📆 Timing Note:
Historically, July–September has offered volatility surges across mid-cap altcoins. With BAND breaking structure at this critical timing, early positioning could offer asymmetrical risk-reward.
#BANDUSDT #CryptoBreakout #AltcoinSeason #TrendlineBreak #BullishReversal #TechnicalAnalysis #FallingWedge #CryptoSignals #BANDToken #CryptoTA
Bandusdtbuy
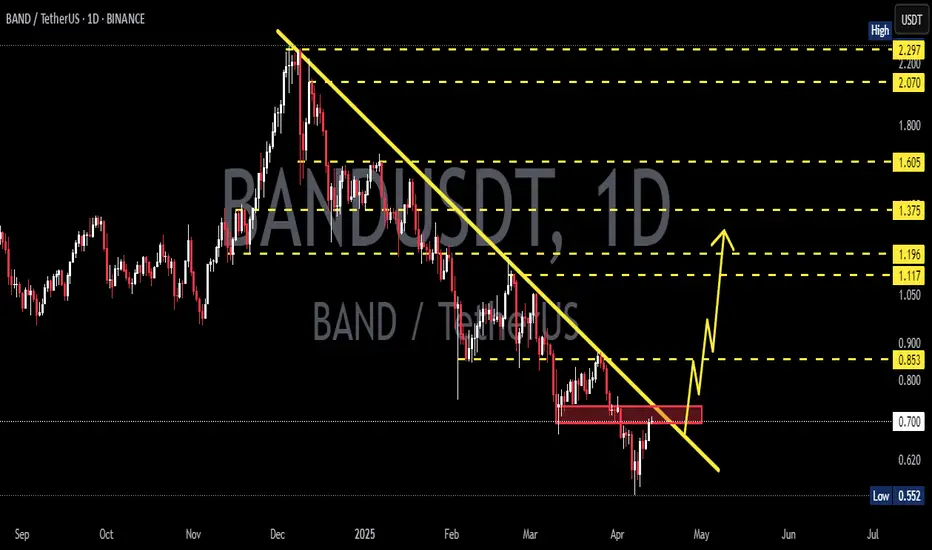
BANDUSDT 1DBAND ~ 1D Analysis
#BAND Buy after successfully penetrating this resistant line with a short -term target of at least 10%+.
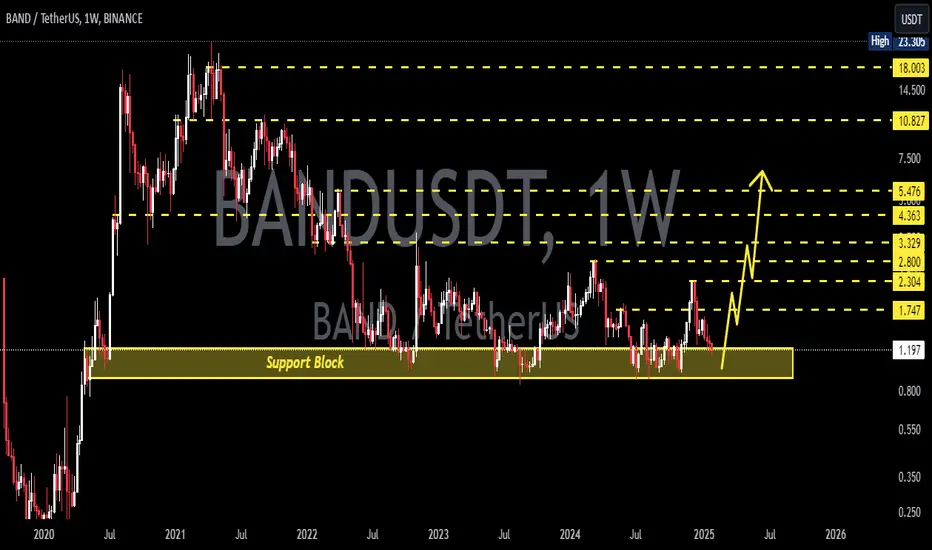
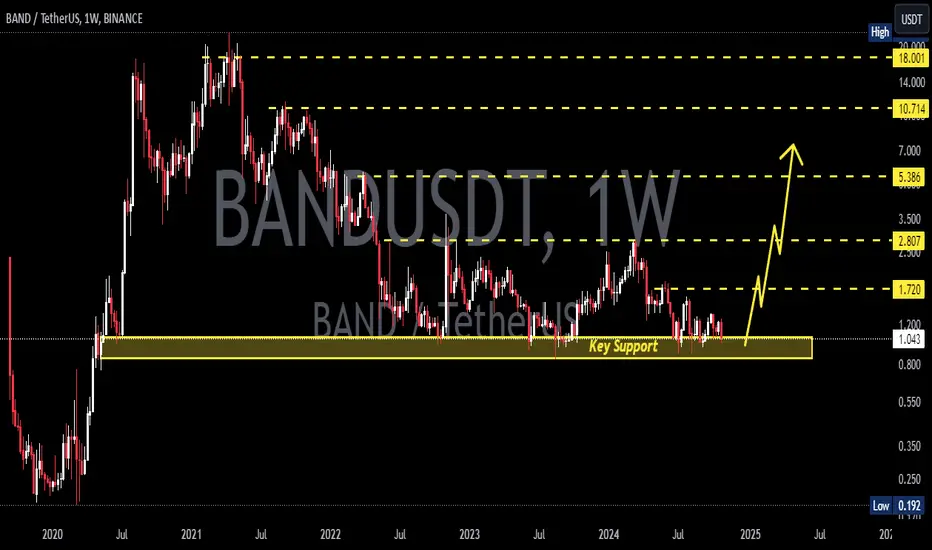
BANDUSDT 1WBAND ~ 1W Analysis
#BAND If you still have a Conviction on this coin. This support block will be a very good place of buy for now.

BANDUSDT 1WBAND ~ 1W Analysis
#BAND In Time Frame 1W continues to maintain this support block, buy from here if you still have a Conviction on this Coin with a minimum target of 20%+
BANDUSDT 1WBAND Update ~ 1W
#BAND If you still have Conviction on this coin. buy in stages from here. with a minimum target of 20%++, it is only a matter of time until this resistance line is successfully penetrated.
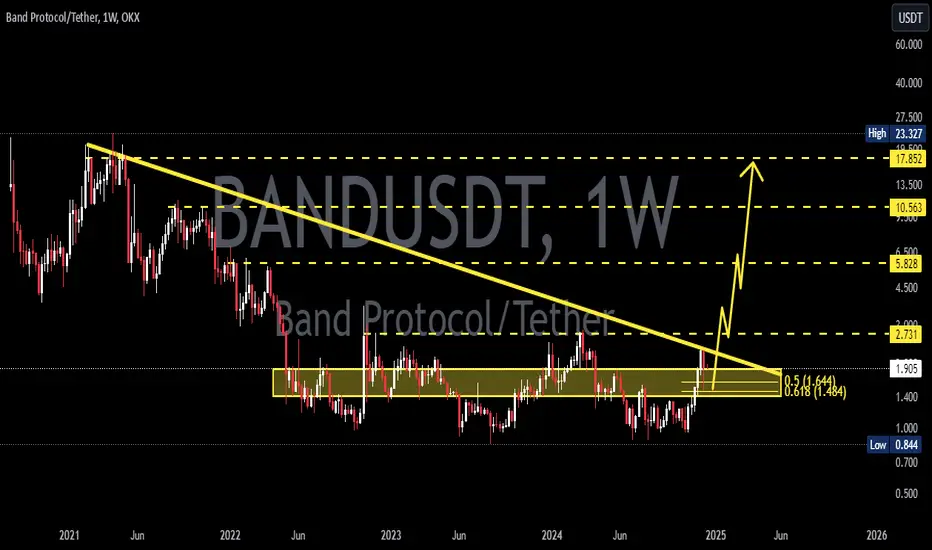
BANDUSDTBAND ~ 1W
#BAND This is an important support block that needs to be maintained.
If you have Conviction on this coin,. This support block would be a very good buy for now.
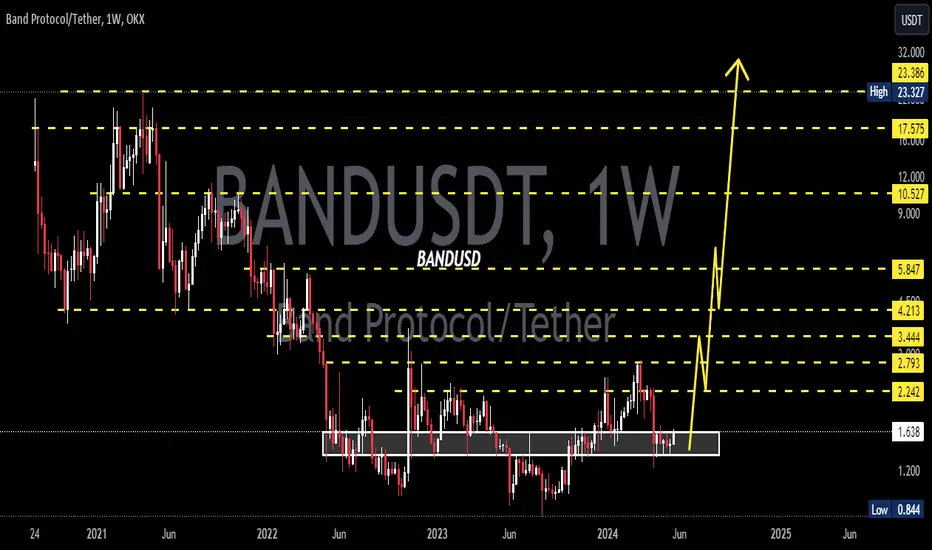
BANDUSD 1WBAND ~ 1W
NASDAQ:BAND Make purchases gradually on this support block. with a minimum target of 15%+. So far this support has been able to hold the price of $BAND.
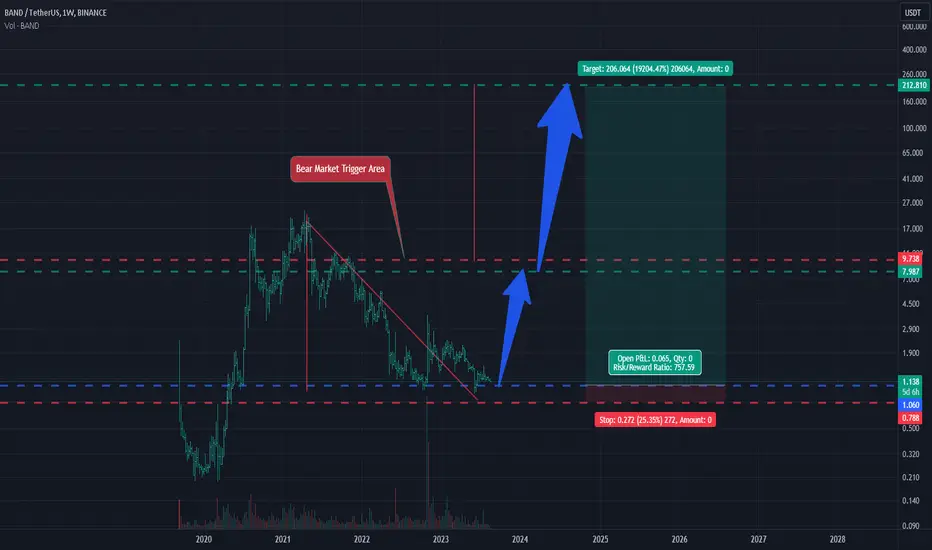
BAND has a very good investment OpportunityHi Everyone;
today we have one of the best risk to reward Investment opportunity
it is more than 757 times the risk and the chart is look very promising.
I expect breaking the previous bear market key point will clear the way to the final target
Band 100% Bullish Move Loading Bandusdt
Band Usdt Symmetrical Triangle Pattern Breakout Already Confirmed on 4h timeframe
Higher time-frame descending channel breakout & retest already done
Expecting 100-300% Bullish Move Incoming Days
Manage risk & do your own research
If you are satisfied with our work join

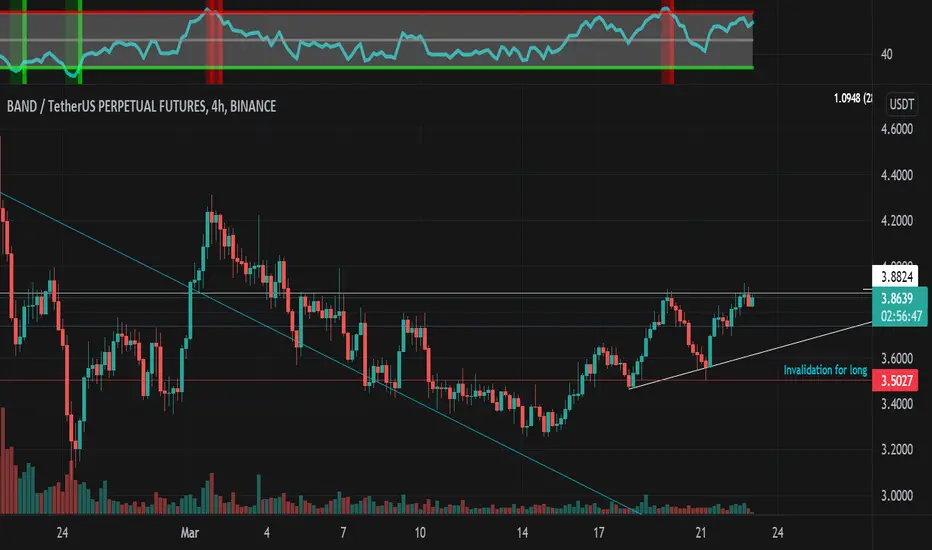
BAND USDT CHANCE FOR BUYINGThere is a chance for taking a buy position on Band/USDT, Band price has broken the blue trendline, this means the downtrend is weaker right now, the red horizontal line is invalidation point for buying, this means we should cancel buy position if Band price break the break and close beneath the invalidation point, the short term target is target 1, the mid term target is target 2 if Band still on uptrend, we should take this opportunity because the risk is smaller then the reward, if there is a comment or suggestion please comment below, I am open to learn
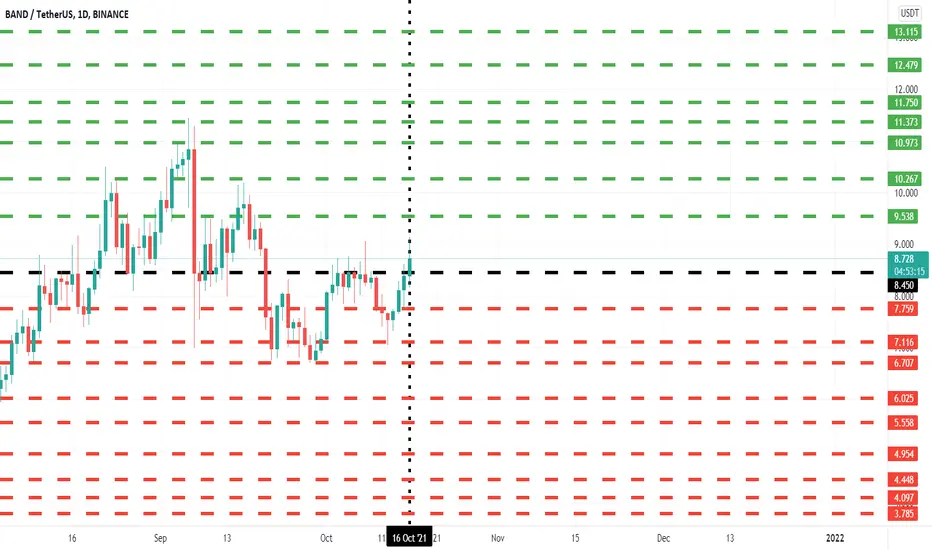
BANDUSDT Daily TimeframeSNIPER STRATEGY (new version)
It works ALMOST ON ANY CHART.
It produces Weak, Medium and Strong signals based on consisting elements.
NOT ALL TARGETS CAN BE ACHIEVED, let's make that clear.
TARGETS OR ENTRY PRICES ARE STRONG SUPPORT AND RESISTANCE LEVELS SO THEY CAN ACT LIKE PIVOT POINTS AND REVERSE THE WAVE (or act like a mirror that can reflects light) BASED ON STRENGTH OF THAT LEVEL.
ENTRY PRICE BLACK COLOR
MOST PROBABLE SCENARIOS TARGETS GREEN COLOR
LEAST PROBABLE SCENARIOS TARGETS RED COLOR
TARGETS ARE NOT EXACT NUMBERS THEY ARE MORE LIKE A ZONE.
DO NOT USE THIS STROTEGY FOR LEVERAGED TRADING.
It will not give you the whole wave like any other strategy out there but it will give you a huge part of the wave.
The BEST TIMEFRAMES for this strategy are Daily, Weekly and Monthly however it can work on any timeframe.
Consider those points and you will have a huge advantage in the market.
There is a lot more about this strategy.
It can predict possible target and also give you almost exact buy or sell time on the spot.
I am developing it even more so stay tuned and start to follow me for more signals and forecasts.
START BELIEVING AND GOOD LUCK
HADIMOZAYAN
BANDUSDT 4H: Possible LONGBANDUSDT 4H: Possible LONG
Rebound from the level 8,000 and possible growth to the level 12,000

MORE BUYS ON BANDUSDTAfter price bottomed out from the $4.40 area, we have seen some uptrend moves on this one.
Having crossed the $5.20 key level, we have positioned ourselves long.
Already on the move, we expect price to continue its uptrend with targets at $6.80.

BANDUSDT Bullish Butterfly PatternBANDUSDT Bullish Butterfly Pattern
BandChain having several updates and events in the upcoming days and I am expecting a Bull Rally.
Here is the setup for "When to open a buy position" for a long hold Band for a huge profit.
Keep following the market and enter IF AND ONLY IF The Setup is Validated.
Buying Zone: 10.6
Targets:
TP1 @14.306 - 35.26%
TP2: 15.932 - 50.63%
TP3: 18.447 - 73.95%
Stop Loss: 7.760
NOTE: DO YOUR OWN ANALYSIS. DO PROPER RISK AND MONEY MANAGEMENT. SPOT TRADING ONLY.
Do not use more than 20% Risk of your account. I will not be responsible for any loss.
Happy Trading!
