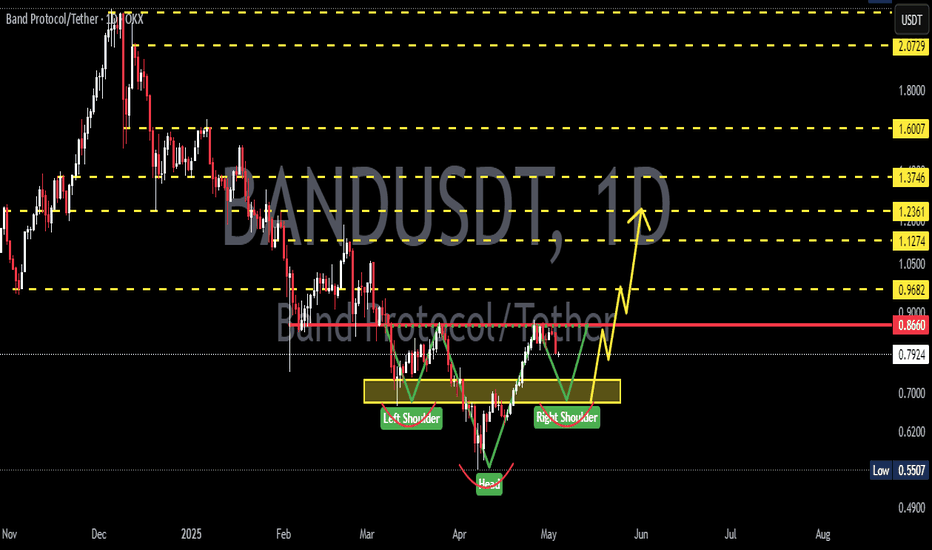
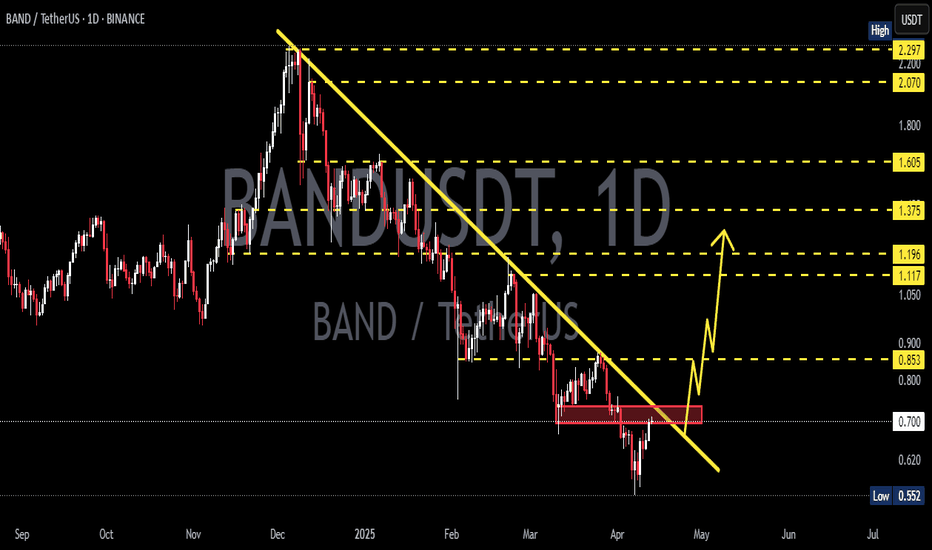
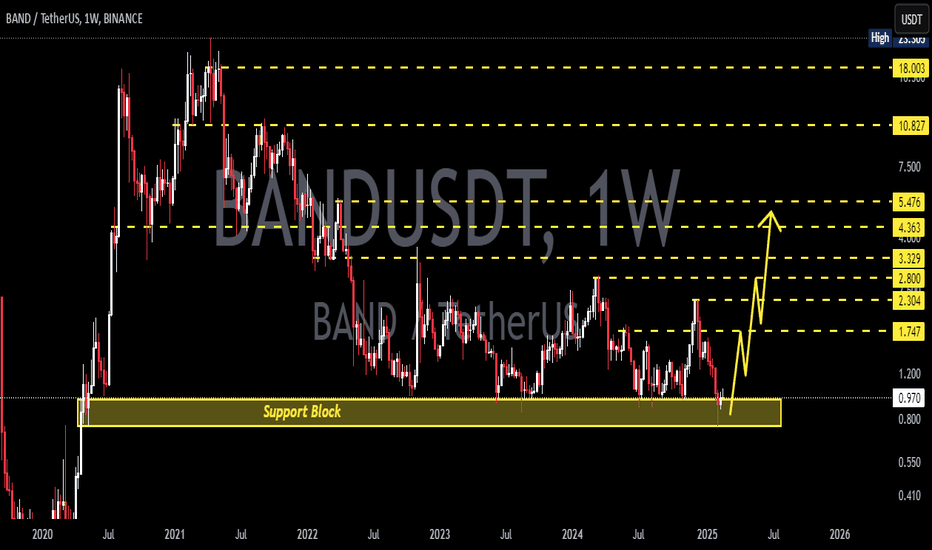
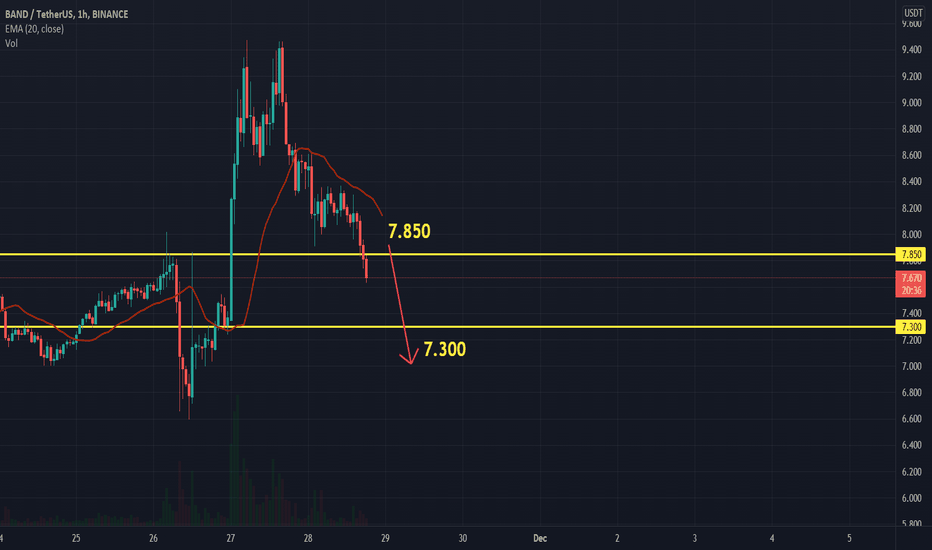
BAND/USDT – Massive Trendline Breakout! Reversal Play!📌 Chart Overview:
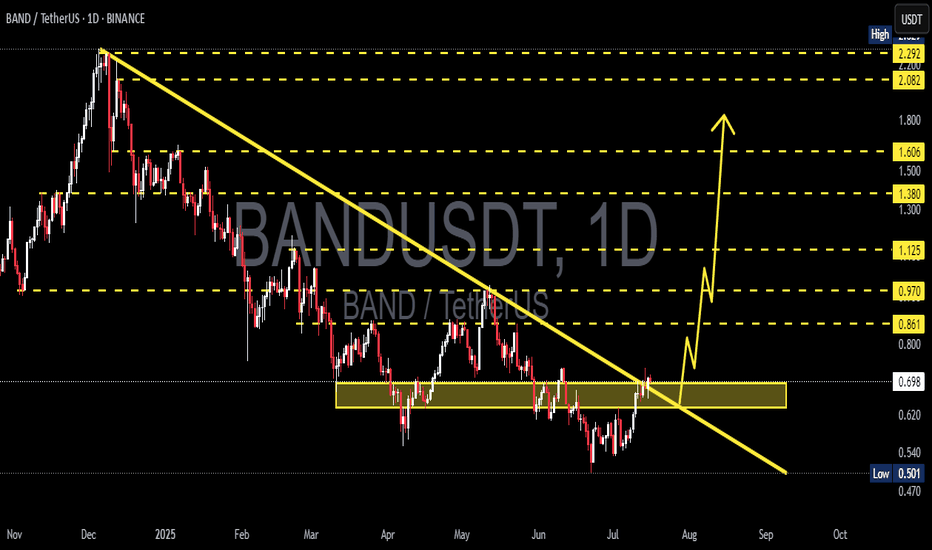
BAND/USDT has officially broken out from a long-term descending trendline that has suppressed price action for over 7 months. This breakout, confirmed with a bullish daily close above a key horizontal resistance zone ($0.68–$0.70), opens the door for a powerful trend reversal.
The structure signals the end of accumulation and the beginning of a potential markup phase, where volatility and volume often expand rapidly.
🔍 Technical Pattern Breakdown:
Falling Wedge Formation: A classic bullish reversal pattern formed after a prolonged downtrend. The wedge narrowed price volatility and concluded with a clean breakout to the upside.
Descending Trendline Breakout: The break of the major trendline marks a shift in control from bears to bulls. Historically, this is one of the strongest technical signals for a trend reversal.
Demand Zone Validation: The $0.60–$0.70 range has acted as a multi-month accumulation zone, with repeated rejections from the downside showing strong buyer presence.
✅ Bullish Scenario:
If BAND holds above the $0.68–$0.70 breakout zone, a strong bullish rally could unfold with the following upside targets:
1. TP1: $0.861 – Minor resistance, potential retest level.
2. TP2: $0.970 – Psychological resistance and historical flip zone.
3. TP3: $1.125 – Major horizontal resistance; a breakout from here could trigger FOMO buying.
4. TP4: $1.380–$1.606 – High-confluence zone from previous consolidation.
5. TP5: $2.08–$2.29 – Ultimate extension target aligned with macro resistance from November 2024 highs.
Each breakout above the target levels could lead to a short squeeze scenario, accelerating momentum.
⚠️ Bearish Scenario:
A failure to sustain above the $0.68–$0.70 level would invalidate the breakout and trap late buyers.
Breakdown back below the yellow zone could push price towards:
$0.60 – Key mid-support
$0.501 – The lowest support on chart; a break here would resume the downtrend.
Watch for volume divergence or fake-out signals on lower timeframes.
🧠 Market Psychology Insight:
This setup reflects a shift in sentiment. After a prolonged phase of apathy and seller exhaustion, smart money appears to be stepping in. The strong rejection from lows and breakout suggests early-stage bullish accumulation transitioning into public participation.
If volume increases along with upward price movement, it may confirm Phase C-D of a Wyckoff Accumulation, suggesting much higher upside.
📆 Timing Note:
Historically, July–September has offered volatility surges across mid-cap altcoins. With BAND breaking structure at this critical timing, early positioning could offer asymmetrical risk-reward.
#BANDUSDT #CryptoBreakout #AltcoinSeason #TrendlineBreak #BullishReversal #TechnicalAnalysis #FallingWedge #CryptoSignals #BANDToken #CryptoTA
Bandusdtsignal
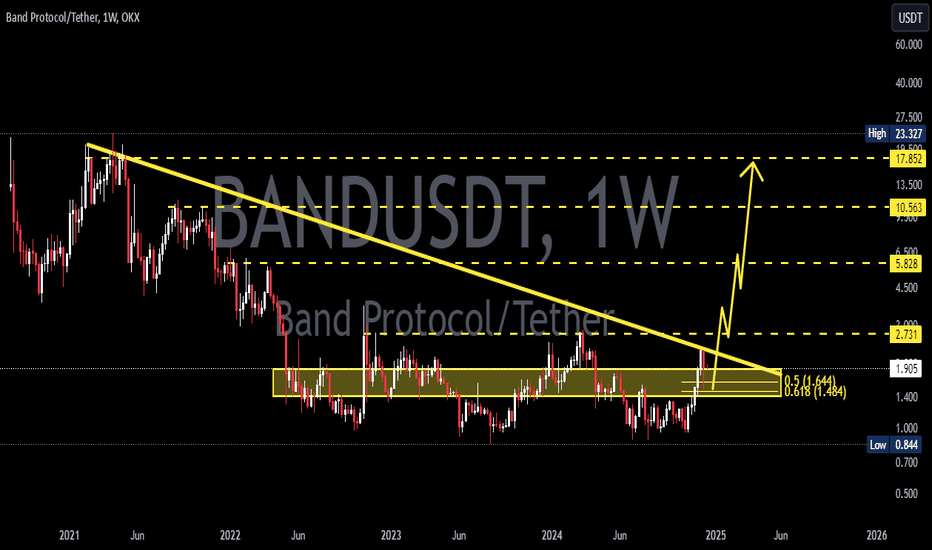
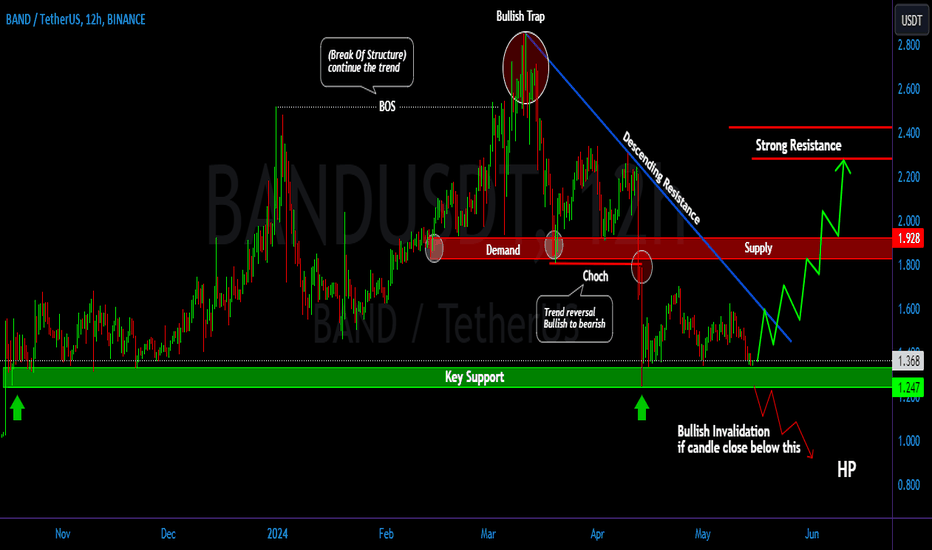
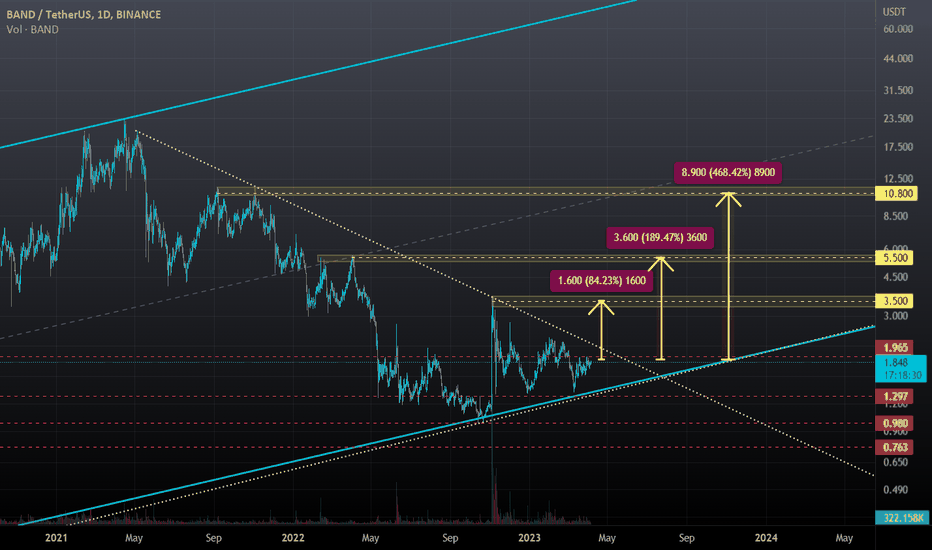
BAND/USDT Possible to bounce on here and break the descending!💎 Paradisers, #BAND is indeed a coin worth monitoring closely.
💎 It's currently situated at a key support area, and a successful bounce from this level is crucial to maintain bullish momentum and continue its upward movement.
💎 If the bounce proves to be valid, BAND may attempt to break above the resistance trendline of the descending pattern.
💎 However, if BAND fails to break above the resistance and experiences rejection, there's a potential for the price to retreat back to the support area. Repeated touches on the support may gradually weaken its effectiveness, posing a concern for the bullish outlook.
💎 The bullish invalidation would occur if BAND fails to bounce from the demand area and confirms a daily candle close below the support level at 1.25. This would indicate a shift towards bearish sentiment and could lead to further downward movement in price.
MyCryptoParadise
iFeel the success🌴
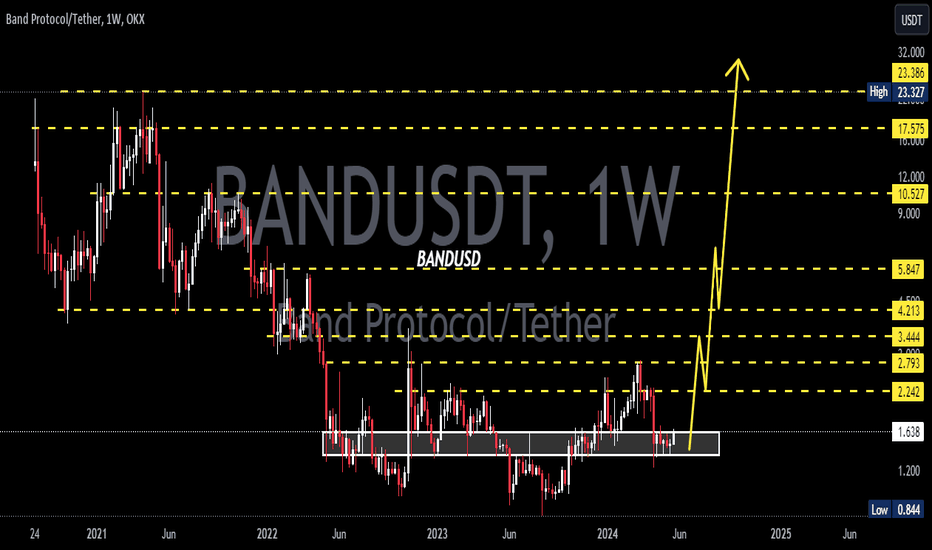
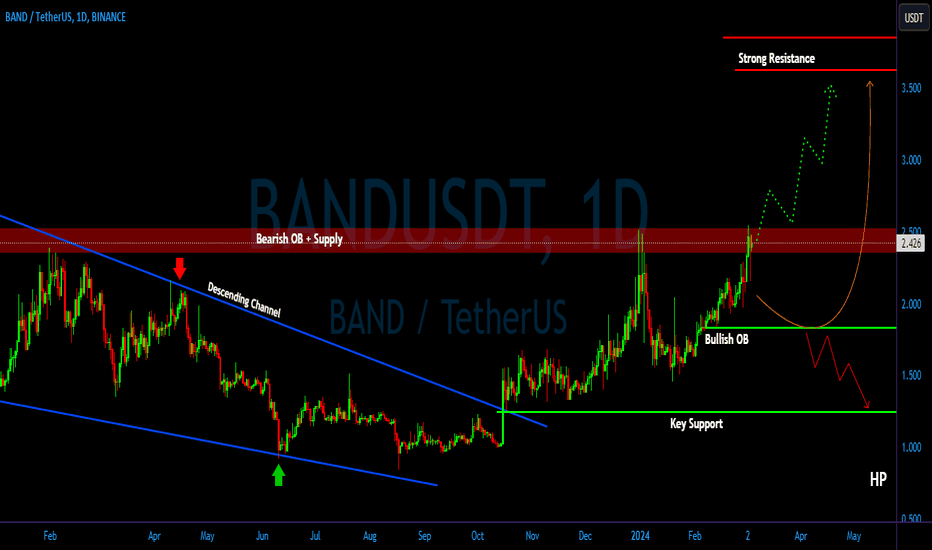
BAND/USDT A Successful breakout will indicating Bullish Momentum💎BAND has recently demonstrated noteworthy market dynamics, with significant upward movement facing resistance at the bearish OB and supply area.
💎 If BAND successfully breaks out above this supply zone, it could signal a bullish momentum, probability leading to significant upward movement and reaching our target strong resistance area.
💎However, if BAND fails to break above the supply zone, the price may face rejection and retreat downward, possibly revisiting the Bullish OB around 1.83 to gather new momentum.
💎It's essential for the price to bounce from the Bullish OB area if it aims to resume its upward trajectory. Failure to bounce, or worse, a breakdown below the demand area, would be concerning signs indicating continued downward movement. In such a scenario, the price might retreat further towards the key support zone or even lower levels.
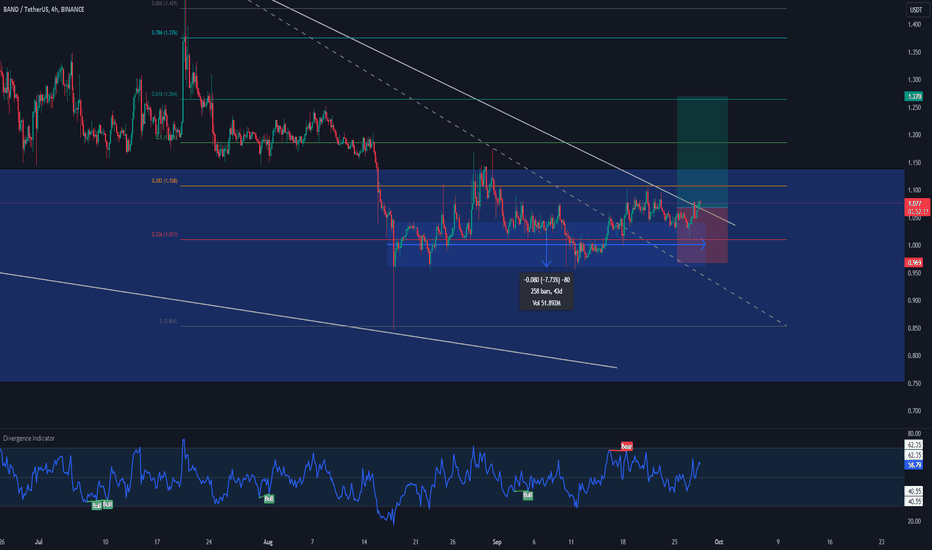
BAND/USDT Breakout and Accumulation Zone BreakoutBINANCE:BANDUSDT
BAND/USDT breakout and accumulation zone breakout
BAND/USDT has broken out of the downtrend line and the accumulation zone, signaling a potential bullish reversal. The price has shown good strength over the past 40 days, trading within a range of 0.95 to 1.17.
This breakout suggests that buyers are gaining control and that the price could move higher in the coming weeks. The immediate targets are 1.27 and 1.40, with a stop loss below 0.96.
However, it is important to note that the cryptocurrency market is volatile and that prices can move quickly in either direction. It is always advisable to do your own research and to trade within your risk tolerance.
Disclaimer: This is not financial advice. Please do your own research before making any investment decisions.
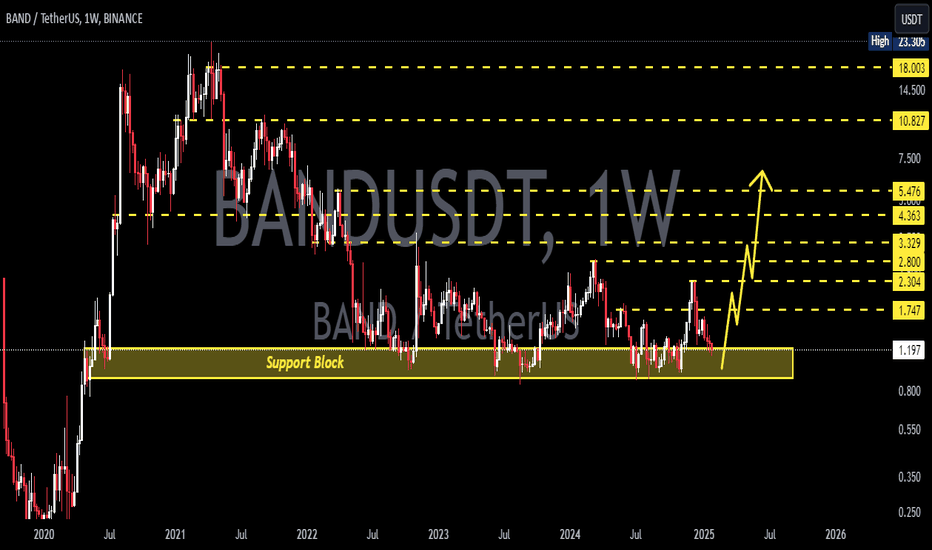
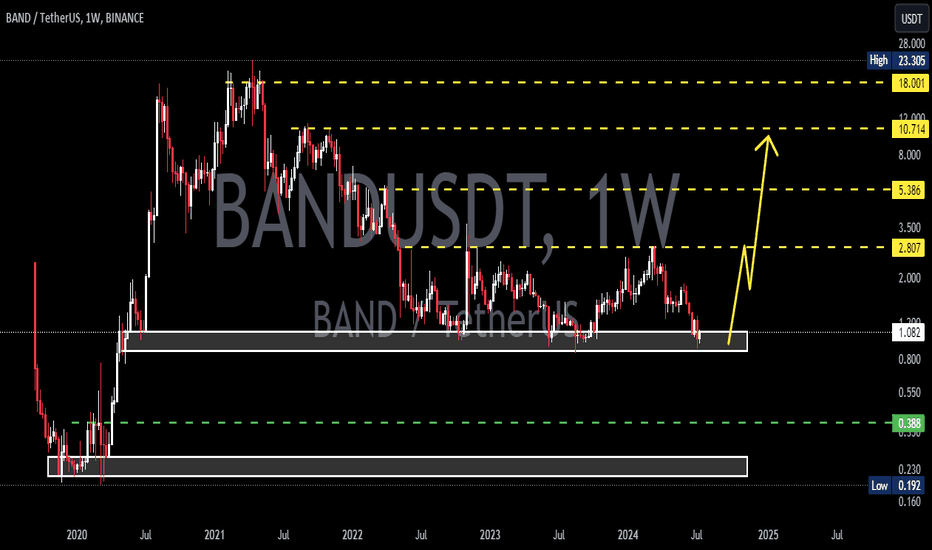
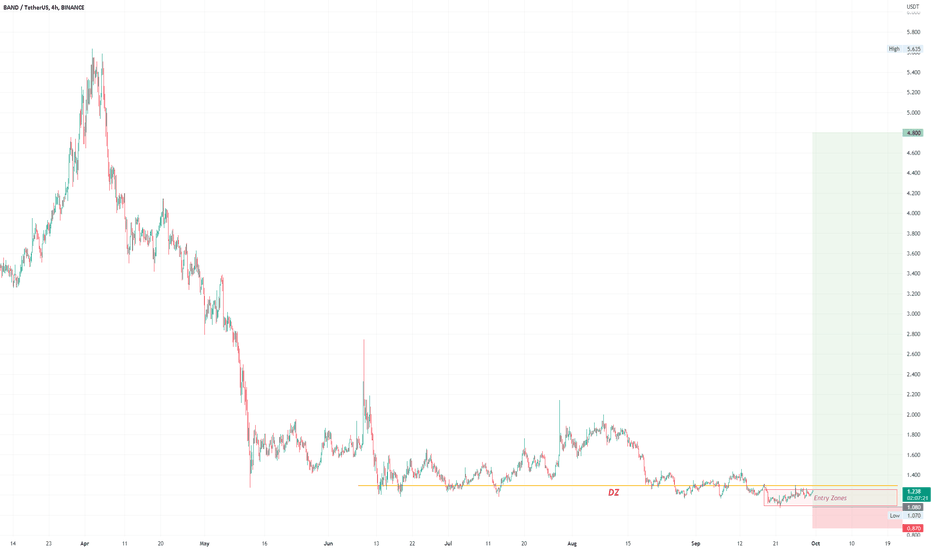
BANDUSDT Long SignalBANDUSDT is a Spot Gem and its currently making up the bullish momentum to go further ahead of its current market price, i am highly bullish on $BAND and it will surely spike within the next few weeks. Lets ride this spot beast!
My setup is as follows:
ENTRY: 1.08 - 1.20
One time Entry: 1.13
TARGETS
Short Term: 1.27 - 1.32 - 1.38 - 1.46 - 1.58 - 1.75
Mid Term: 2.00 - 2.40 - 2.90 - 3.50 - 4.20- 5.00
STOP LOSS: 0.87
Please be aware with your money!
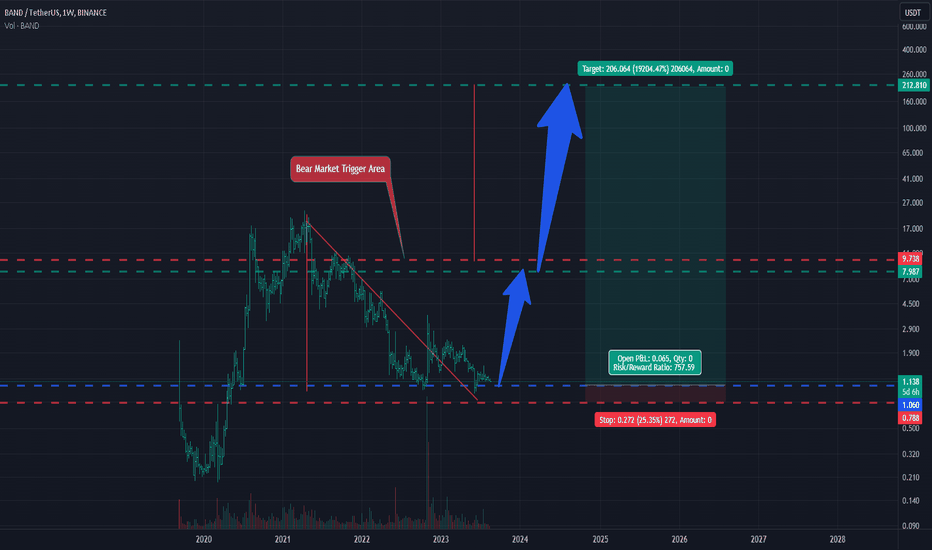
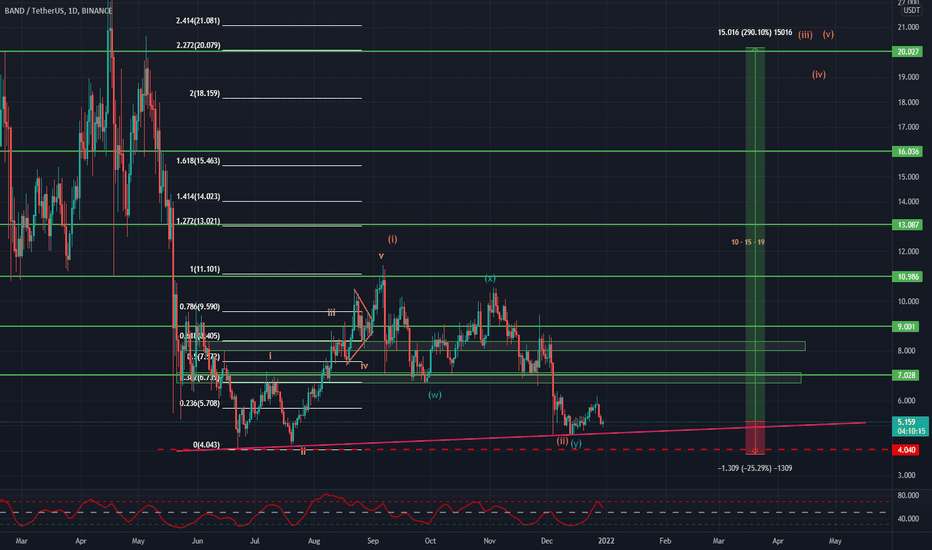
BANDUSDT GLOBAL VISION (HUGE RISK/REWARD POTENTIAL)Hello friends.
Please support my work by clicking the LIKE button👍 (If you liked).Thank you!
Everything on the chart.
Entry: market and lower
TP: 10 - 15 - 19
after first target reached move ur stop to breakeven
Stop: (depending of ur risk). ALWAYS follow ur RM .
cancellation of growth, consolidation below 4
Risk/Reward: 1 to 12
risk is justified
Good luck everyone!
Follow me on TRADINGView, if you don't want to miss my next analysis or signals.
It's not financial advice.
Dont Forget, always make your own research before to trade my ideas!
Open to any questions and suggestions.
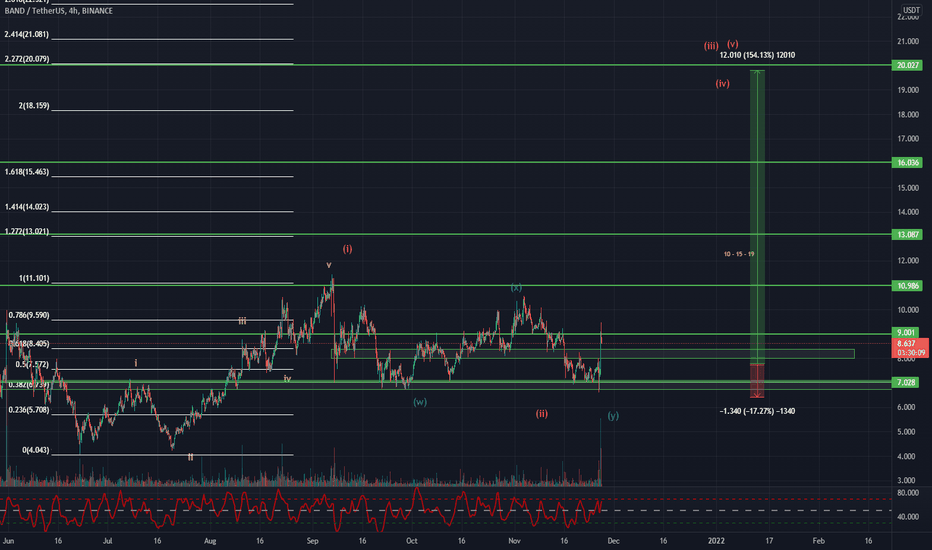
BANDUSDT AnalysisHello friends.
Please support my work by clicking the LIKE button(If you liked).Thank you!
Everything on the chart.
open pos: market and lower
target: 10 - 15 - 19
after first target reached move ur stop to breakeven
stop: under 6.3 (depending of ur risk). ALWAYS follow ur RM .
risk/reward 1 to 9
risk is justified
Good luck everyone!
Follow me on TRADINGView, if you don't want to miss my next analysis or signals.
It's not financial advice.
Dont Forget, always make your own research before to trade my ideas!
