Review and plan for 30th July 2025 Nifty future and banknifty future analysis and intraday plan.
Quarterly results- analysis.
This video is for information/education purpose only. you are 100% responsible for any actions you take by reading/viewing this post.
please consult your financial advisor before taking any action.
----Vinaykumar hiremath, CMT
BANKNIFTY

[INTRADAY] #BANKNIFTY PE & CE Levels(29/07/2025)Bank Nifty is expected to open with a gap-down, continuing its downside pressure from the previous sessions. The index is now hovering near an important support zone around 56,050–55,950.
If Bank Nifty sustains above the 56,050–56,100 zone after the gap-down open, a reversal rally can be seen with potential upside targets of 56,250, 56,350, and 56,450+. This zone may offer a low-risk long opportunity, provided price action confirms strength.
However, if Bank Nifty remains below 56,050 and especially breaches 55,950, fresh short positions can be initiated with downside targets of 55,750, 55,650, and 55,550-. A close below this support zone can accelerate the selling momentum further.
The market remains in a bearish tone unless a clear reversal structure forms above 56,050.

Bank Nifty view - August 2025Bank Nifty is trading around a crucial decision zone as we enter August 2025. The index is currently oscillating near significant technical levels that could dictate the next major directional move. Here’s a detailed outlook based on the latest key levels:
Bearish Scenario
Bank Nifty will turn distinctly bearish if it sustains below 56,040, especially if confirmed by persistent price action and volume. This breakdown could trigger accelerated selling and open up the following downside targets:
First Support Target - 55,475
If the index remains under 56,040, expect initial support around 55,475. This is the first area where some short covering or intraday bounce is possible. However, failure to hold here may invite further downside pressure.
Second Support Target - 54,885
A break below 55,475 paves the way towards the next meaningful support at 54,885. Watch for momentum and volume cues at this level; a lack of buying interest can result in a steeper fall.
Final Support Target - 54,302
Should the selling persist unabated, Bank Nifty could test the final support at 54,302. A close below this level could confirm a deeper corrective move, signaling increased bearish sentiment and potentially inviting broader market weakness.
Bullish Scenario
Bank Nifty would flip decisively bullish on a sustained move above 56,600. This breakout could attract fresh buying interest and propel the index toward the following upside targets:
First Resistance Target - 57,280
A breakout above 56,600 should see the index quickly challenging 57,280. Monitor price behaviour here for signs of continuation or profit booking.
Second Resistance Target - 57,630
Further strength above 57,280 could carry Bank Nifty to 57,630. This level represents short-term resistance and could see volatile swings.
Final Resistance Target - 58,205
Sustained bullish momentum may take the index to 58,205. Watch for signs of exhaustion or reversal as this is a critical resistance zone.
Risk Management:
Adopt a tight trailing stop-loss (TSL) to protect profits, as volatility can cause sharp pullbacks. Remain nimble and prepare to cover positions promptly.
This analysis is intended purely for educational purposes and should not be considered as financial advice.

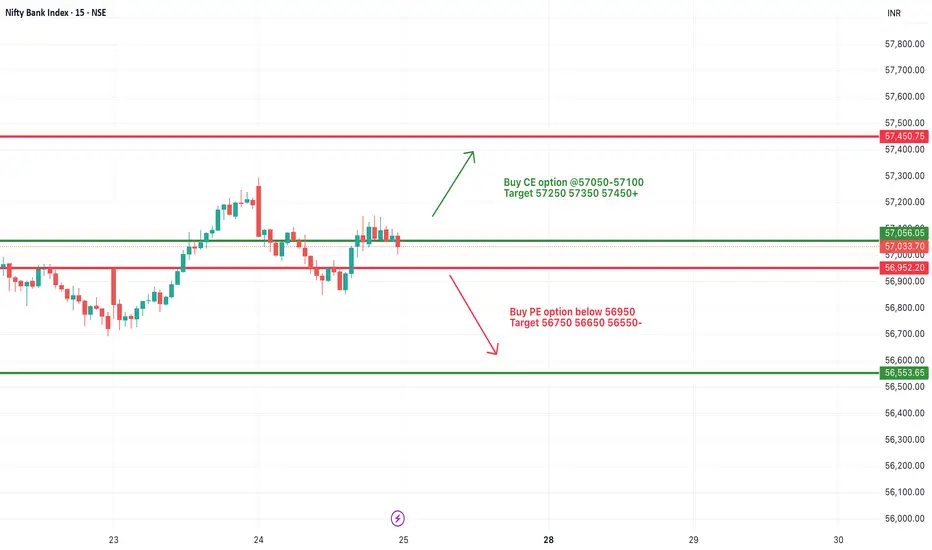
[INTRADAY] #BANKNIFTY PE & CE Levels(25/07/2025)Bank Nifty is likely to start the session with a slight gap-down, hovering just below the 57,050–57,100 resistance zone. This zone has been acting as a critical barrier over the past sessions, and until it's breached, upside momentum may remain capped.
A strong bullish move can be anticipated above 57,050, where call option buying is favored. If Bank Nifty sustains this breakout, we can expect a continuation rally toward 57,250, 57,350, and 57,450+ levels. This would mark a short-term trend reversal and signal fresh bullish interest.
On the downside, weakness may resume if the index breaks below the 56,950 mark. A sustained move below this could trigger a quick correction targeting 56,750, 56,650, and 56,550- levels, offering good opportunities for put option buyers.
Review and plan for 25th July 2025Nifty future and banknifty future analysis and intraday plan.
Quarterly results.
This video is for information/education purpose only. you are 100% responsible for any actions you take by reading/viewing this post.
please consult your financial advisor before taking any action.
----Vinaykumar hiremath, CMT

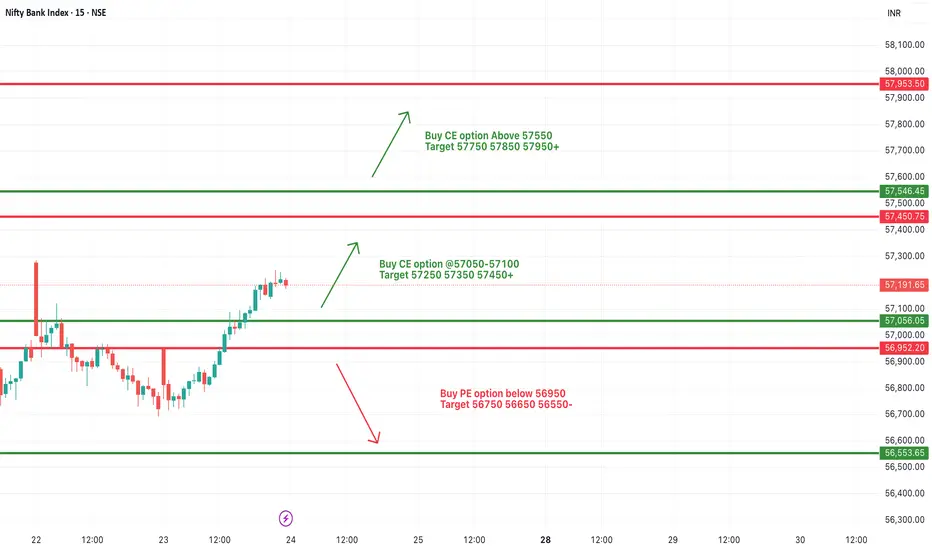
[INTRADAY] #BANKNIFTY PE & CE Levels(24/07/2025)Bank Nifty is likely to open with a slight gap-up, continuing its recent upward trajectory. The index has shown strength by reclaiming key resistance zones and now trades above 57,100, indicating bullish sentiment in the market. Today’s price action will be crucial near immediate supply and resistance zones.
On the upside, if Bank Nifty sustains above 57,050–57,100, a continuation move may unfold toward 57,250, 57,350, and 57,450+ levels. A decisive breakout above 57,550 will open up further upside possibilities with targets near 57,750, 57,850, and 57,950+, where the next key resistance lies.
On the downside, weakness will only emerge if the index breaks below 56,950, which could trigger a sell-off with downside targets of 56,750, 56,650, and 56,550-. This zone also marks the base of the recent rally, and breaching it could suggest exhaustion of momentum.
Overall, the trend remains positive with momentum favoring the bulls as long as the index remains above 57,000. Traders are advised to wait for confirmation near the mentioned levels before initiating trades and maintain strict risk management with trailing stop-losses.
Review and plan for 21st July 2025Nifty future and banknifty future analysis and intraday plan.
Quarterly results.
This video is for information/education purpose only. you are 100% responsible for any actions you take by reading/viewing this post.
please consult your financial advisor before taking any action.
----Vinaykumar hiremath, CMT

Review and plan for 18th July 2025Nifty future and banknifty future analysis and intraday plan.
Analysis of quarterly results.
This video is for information/education purpose only. you are 100% responsible for any actions you take by reading/viewing this post.
please consult your financial advisor before taking any action.
----Vinaykumar hiremath, CMT

Review and plan for 17th July 2025 Nifty future and banknifty future analysis and intraday plan.
This video is for information/education purpose only. you are 100% responsible for any actions you take by reading/viewing this post.
please consult your financial advisor before taking any action.
----Vinaykumar hiremath, CMT

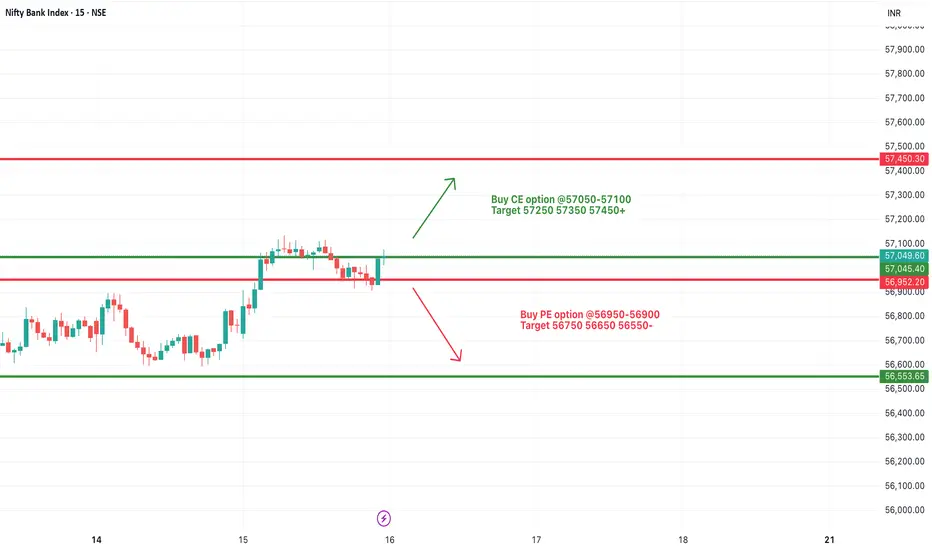
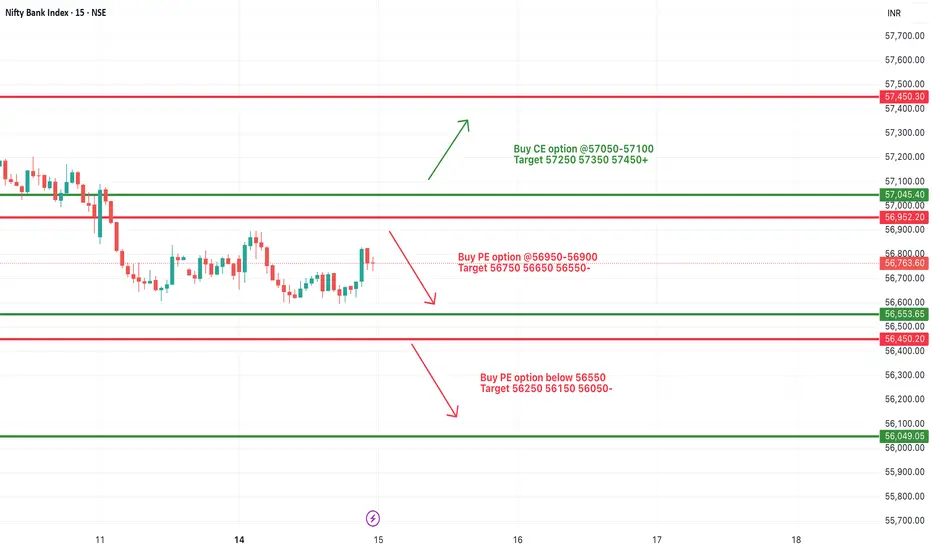
[INTRADAY] #BANKNIFTY PE & CE Levels(16/07/2025)Bank Nifty is expected to begin the day on a flat note near the 57000 mark, indicating indecisiveness after the previous session's recovery. The immediate resistance zone lies between 57050 and 57100. A sustained move above this level can trigger an upward continuation toward the targets of 57250, 57350, and possibly 57450+. This zone will be key for bullish momentum, and traders can look for strength confirmation around this breakout.
On the downside, the 56950–56900 level is crucial. If Bank Nifty slips below this zone, it may invite fresh selling pressure, with intraday downside targets around 56750, 56650, and 56550. The support at 56550 and below can act as demand zones for any pullback.
[INTRADAY] #BANKNIFTY PE & CE Levels(15/07/2025)Bank Nifty is expected to open with a gap-up near the 56950 zone. If the index sustains below the 56900–56950 resistance range after the initial up-move, it could face selling pressure. A downside move from this level may trigger a correction toward the 56750, 56650, and 56550 zones. This level becomes a key intraday resistance.
On the downside, a breakdown below the 56650 level could intensify selling, leading to further downside targets of 56250, 56150, and 56050. This zone must be monitored closely as it holds short-term support strength. A decisive move below 56650 will shift sentiment bearish for the session.
On the other hand, a breakout and sustained move above 57100 could attract bullish momentum and may lead to upside targets of 57250, 57350, and even 57450+. Price action around the 57000–57100 mark will be crucial to determine any bullish continuation.
Overall, today's session is expected to open strong but watch for follow-through near the key zones. Traders should remain cautious and wait for confirmation around 56900–57100 for direction clarity.
Review and plan for 15th July 2025Nifty future and banknifty future analysis and intraday plan.
Intraday ideas.
This video is for information/education purpose only. you are 100% responsible for any actions you take by reading/viewing this post.
please consult your financial advisor before taking any action.
----Vinaykumar hiremath, CMT

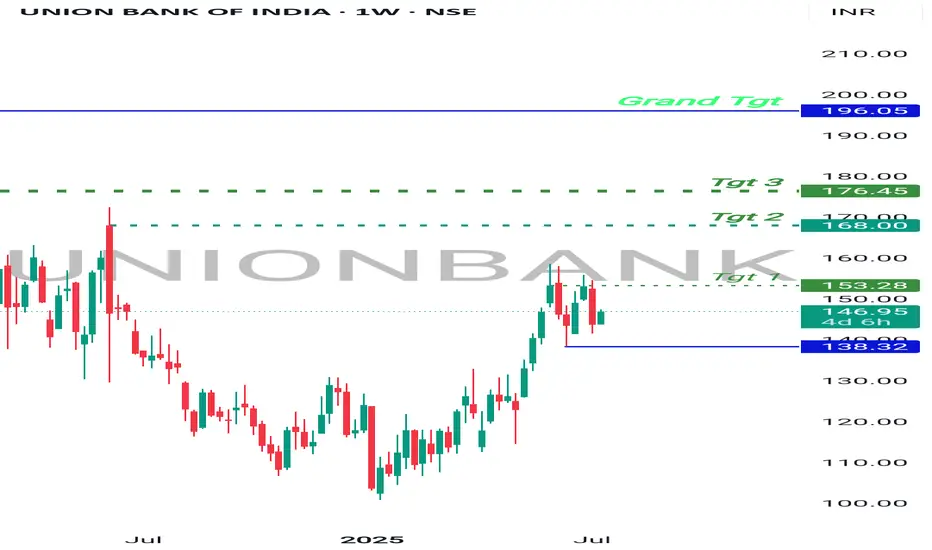
Bullish Bet , UnionBankBanknifty at support.
UnionBank on recent high making sideways moves, which means consolidation.
Once Banknifty Bounce back, UnionBank will break the resistance on weekly and monthly Basis and will start moving higher.
It has higher targets on a short and long term investment.
Good to hold for short term.
Review and plan for 14th July 2025 Nifty future and banknifty future analysis and intraday plan.
Results - analysed.
This video is for information/education purpose only. you are 100% responsible for any actions you take by reading/viewing this post.
please consult your financial advisor before taking any action.
----Vinaykumar hiremath, CMT

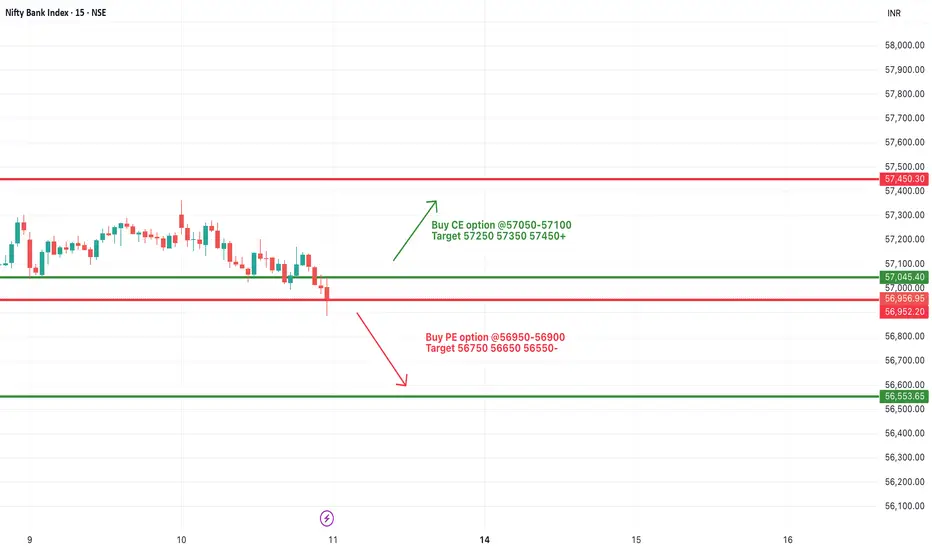
[INTRADAY] #BANKNIFTY PE & CE Levels(11/07/2025)Bank Nifty is expected to open flat today after a prolonged consolidation and a narrow trading range observed in the previous sessions. The index is hovering near the support zone of 56900–57000, which has acted as a critical level in recent price action.
If Bank Nifty sustains above 57050–57100, we may witness a rebound towards 57250, 57350, and 57450+. However, a decisive breach below the 56900 level can trigger a sharp fall, with immediate downside targets at 56750, 56650, and 56550-.
Since the index is trading close to a major support zone, today's movement could decide the next directional trend. Until a breakout or breakdown is confirmed, expect range-bound moves with limited momentum.
Review and plan for 11th July 2025 Nifty future and banknifty future analysis and intraday plan.
Analysis of "what i traded today".
This video is for information/education purpose only. you are 100% responsible for any actions you take by reading/viewing this post.
please consult your financial advisor before taking any action.
----Vinaykumar hiremath, CMT

Review and plan for 10th July 2025 Nifty future and banknifty future analysis and intraday plan.
Swing ideas.
This video is for information/education purpose only. you are 100% responsible for any actions you take by reading/viewing this post.
please consult your financial advisor before taking any action.
----Vinaykumar hiremath, CMT

Review and plan for 9th July 2025Nifty future and banknifty future analysis and intraday plan.
This video is for information/education purpose only. you are 100% responsible for any actions you take by reading/viewing this post.
please consult your financial advisor before taking any action.
----Vinaykumar hiremath, CMT

Review and plan for 8th July 2025Nifty future and banknifty future analysis and intraday plan.
Swing ideas.
This video is for information/education purpose only. you are 100% responsible for any actions you take by reading/viewing this post.
please consult your financial advisor before taking any action.
----Vinaykumar hiremath, CMT

Review and plan for 7th July 2025 Nifty future and banknifty future analysis and intraday plan.
Swing ideas.
This video is for information/education purpose only. you are 100% responsible for any actions you take by reading/viewing this post.
please consult your financial advisor before taking any action.
----Vinaykumar hiremath, CMT

Review and plan for 4th July 2025 Nifty future and banknifty future analysis and intraday plan.
Swing ideas.
This video is for information/education purpose only. you are 100% responsible for any actions you take by reading/viewing this post.
please consult your financial advisor before taking any action.
----Vinaykumar hiremath, CMT

Review and plan for 3rd July 2025 Nifty future and banknifty future analysis and intraday plan.
Swing ideas.
This video is for information/education purpose only. you are 100% responsible for any actions you take by reading/viewing this post.
please consult your financial advisor before taking any action.
----Vinaykumar hiremath, CMT

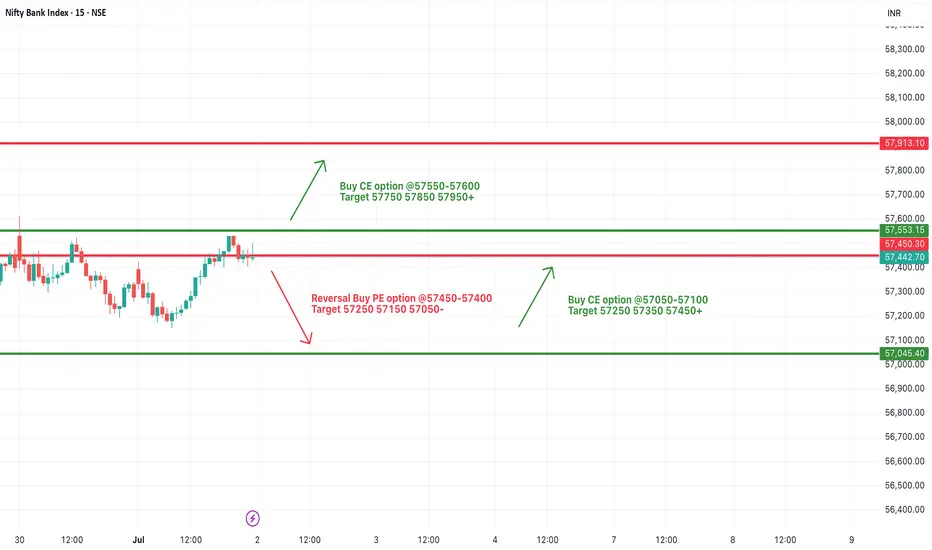
[INTRADAY] #BANKNIFTY PE & CE Levels(02/07/2025)Bank Nifty is expected to open flat near the 57,440 level, just below the immediate resistance at 57,450. This zone will play a crucial role in today’s session. Sustaining above 57,450 can lead to bullish momentum with potential upside targets of 57,550, 57,850, and 57,950. Traders may look for a breakout confirmation before entering long trades.
On the downside, if the index fails to sustain above the 57,450 level and reverses, support around the 57,100–57,050 zone could be tested. A move below this range might lead to a short-term decline toward 57,000 and 56,950. The market remains in a consolidation phase, and breakout from this tight zone can lead to a directional move.