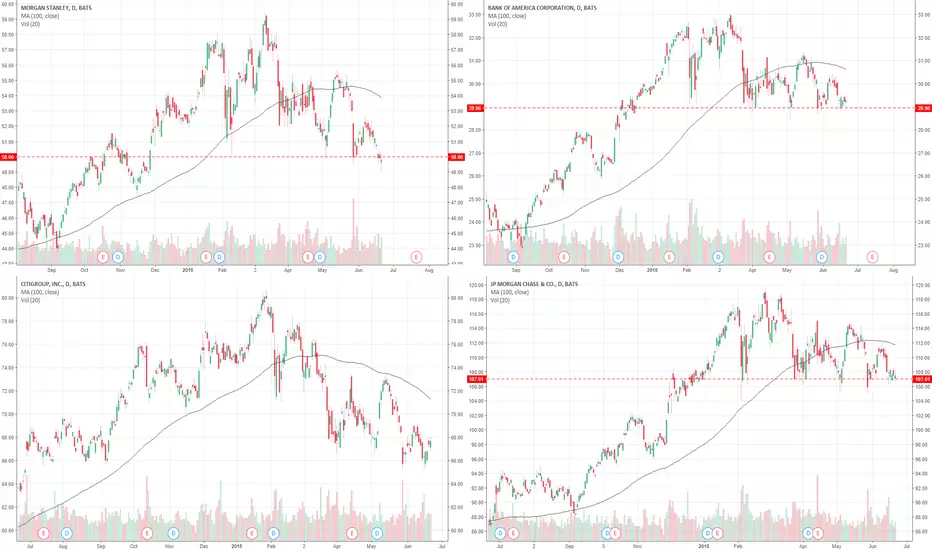
A Bad Year For US Financials Looking Even WorseMorgan Stanley, Bank Of America, Citigroup and JPMorgan - all exhibiting similar year to date behaviour. The whole sector is rolling over, reversing the 2017 rallies as the yield curve remains flat, and possibly set to invert. JPMorgan and Bank Of American look particularly bad.. notice both are just managing to hold up above a clear 6 month support. I would bet on break lower in the coming weeks, possibly days. BAC, JPM, C, MS, XLF.
Banks
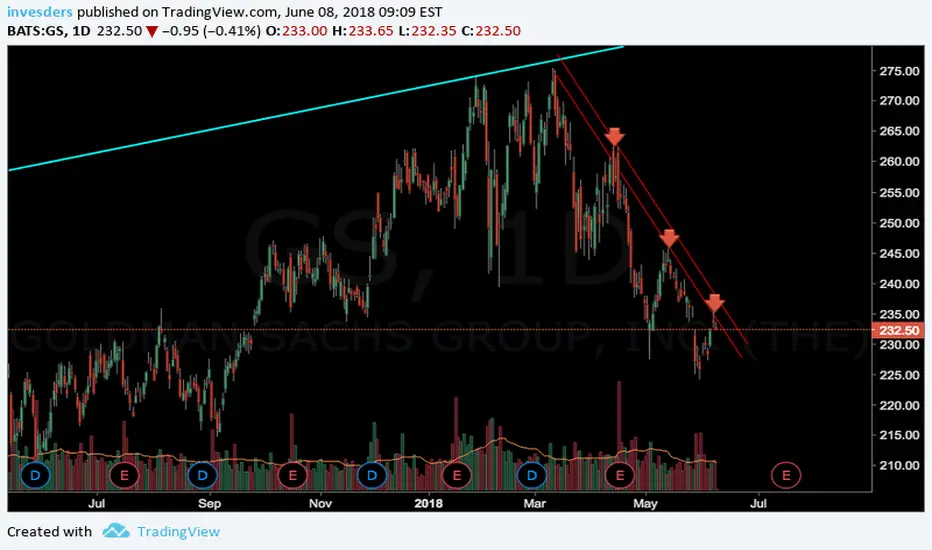
$GS Short Down trendline resistance and price level ceiling at $234. Seems like a good spot to go short.
OMGBTC (OMISEGO Token) Ready, Set…………..!OMGBTC (OMISEGO Token) 05/26/18, 8:15 PM EST, by Mike Mansfield
Good evening, trader friends! Thanks for stopping by. No, no, no, I am not here to wrangle a thumbs up from you on this one. However, if you just love any of the other forecasts, feel free to like away! ;-)
OMISEGO sounds a bit like what “oh my gosh” would be in another language.
Perhaps you can relate to the following statement: "Sometimes I literally “know” what an outcome of a chart will be with a high degree of clarity, probability, and ultimately accuracy." However, this is not one of those times. I can rationally make the case for several outcomes. That is not something I love….but since someone asked for this, I’ll map out the 3 patterns and their likely paths and change of trend times and price areas to watch for.
BOTTOM LINE: UG! We have patterns within patterns, but the cycles look good!
Pattern-1 is long-term neutral:
Large triangle wedge pattern (lime green and dark red lines) may be forming. If correct, it is unfinished and will have at least one, possibly two, more legs down toward the red long-term support trend trend-line, before we can say for sure if the pattern will resolve to the upside and moonshot, or tank into crypto oblivion.
Pattern-2 is medium-term bearish. Maybe:
Bearish rising wedge (cyan blue trend-lines) lines are converging in an upward direction. But it’s not super perfect pattern, as they sometimes look. Rising wedges typically resolves to the downside in a significant way. Moreover, OMG broke the lower support line at the recent May 23 low, which likely means eventually lower prices.
Pattern-3 is short-term bullish:
Falling wedge (yellow downward trend-lines) is short-term bullish and no matter what,
a cyclical bounce is due now based on the two quite accurate cycles thus far.
CYCLES:
Two nicely aligning cycles lows are nesting now (making a low). OMG should have a tradable rally to the green downtrend line.
Green cycle moving up and due to peak June 18,
Green cycle bottoms again July 15th.
Pink cycle is also moving up. Both the pink and green cycle are both due to top around August 10 also, =/- 2 days.
INDICATORS:
Klinger Volume Force is in a wedge. It also supports the idea that the eventual breakout, up or down, should be big.
MACD is rounding in line with cycle lows due any day now.
SUMMARY:
Short-term pattern and cyclical are bullish for a bounce, or more, perhaps until mid June.
Then, another selloff back to the lower cyan support trend-line, in alignment with the cycle low of the shorter-term green cycle, while the larger pink cycle is
moving up.
OMG with then either breakout the upside in line with the pink cycle moving up until about August 10th, while the pink longer-term cycle is also moving up and
blast off.
If the breakout does not happen by the peak of the Pink cycle (Aug 10th), then OMG is very bearish, and the bigger triangle/wedge will likely end badly for OMG.
If OMG breaks out to the upside between now and June 18th, then it might retest the breakout line or pullback around July 15th then have a cyclical peak
August 10th +/- 2 days.
POTENTIAL TRADE:
Consider looking for a short-term cyclical long trade. Lower risk area could be at the first higher swing low once a 34-50 bar EMA
average (or something better) turns up and price is also closing above the average. If The trade doesn't move nicely after the first or second pullback on a 240 minute chart, then the outlooks would be quite bearish short-term and long-term.
DISCLOSURE:
This analysis is meant for educational purposes only. You trade at your own risk!
Cheers!
Michael Mansfield CIO

DBs 3 gap play is powerfully bullishDBs 3 gap play is powerfully bullish
Banking Sector New Leaders?

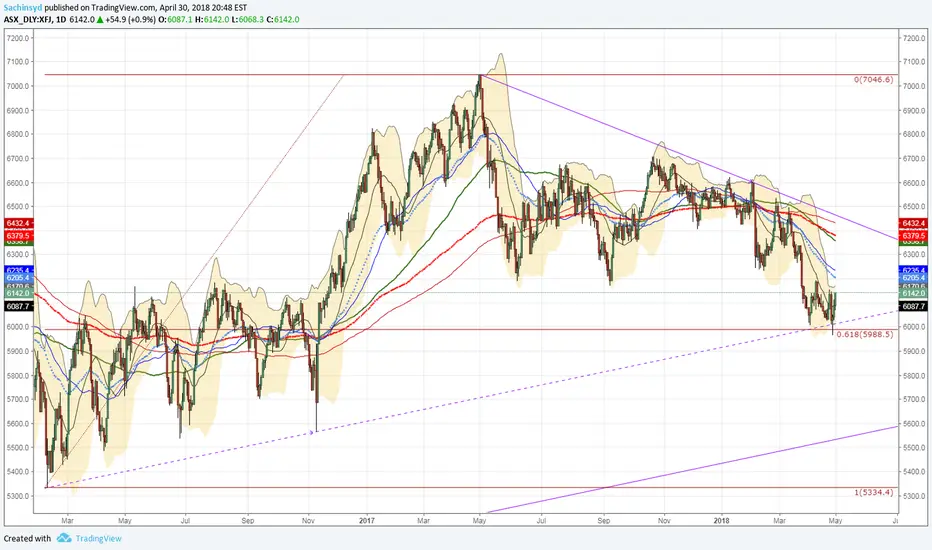
ASX Financial aka Banks IndexASX Financial aka Banks Index looks good from here if holds the fib golden ratio and trend support. Yummy divys coming
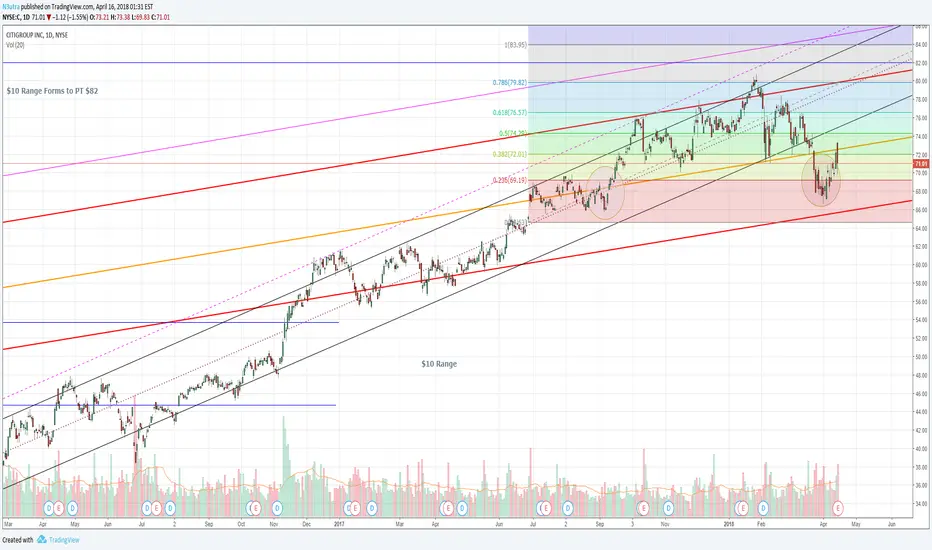
The "Cheap" Bank w/ Short Term Trading Gains (PT $75.40)Who couldn't love Citi when it had dropped to $68? Given both the long term and "2017 Hotness" trend lines, the stock has been knocked down between a reasonable to weak area where it can rebound back up to a comfortable "median" position that has been previously held. Reading between the fib lines and the somewhat consistent range of $70-77, it wouldn't be unreasonable for the stock to climb back to around the midpoint of $75. Its earnings call was great, though some will argue with how fantastic it should have been given the current climate and what's priced in.
If the stock reaches $78, absolutely sell and don't be greedy trying to wait for that magic $80 mark. I'm sure everyone will be watching and waiting for it, but without proper volume, it will be a short lived rally up as everyone else takes their gains. I love Citi as a company and believe it to be strong and stable moving forward the rest of this year. Any price point close to $70 is great for a small position and for technical trading to get some ranged gains.
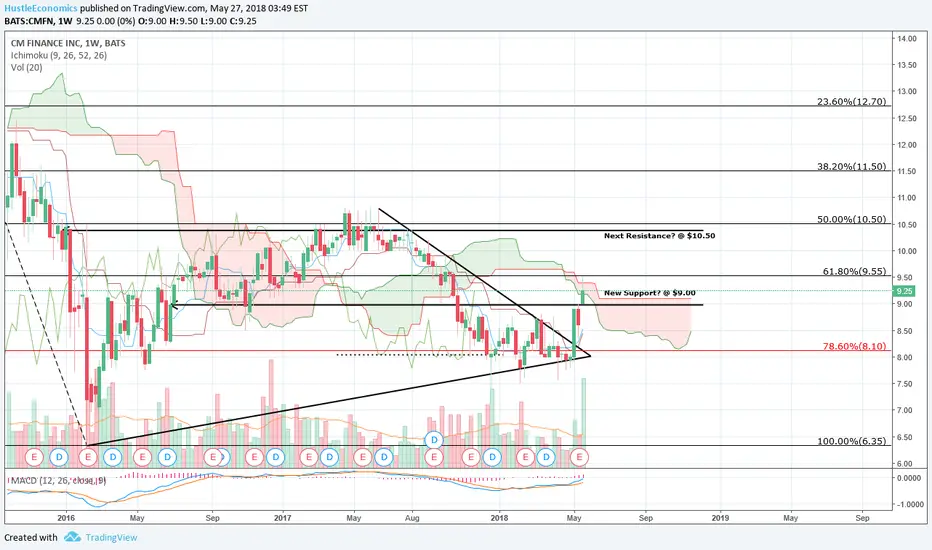
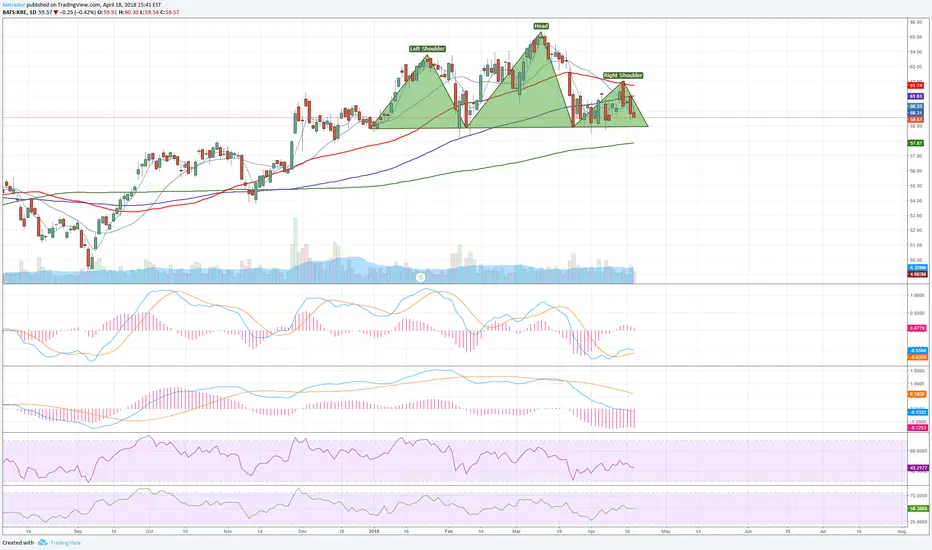
Bearish SignalsFirst off, I'm not the best @ TA, so I would appreciate it if a mistake is seen - please tell.
Multiple bearish signals on Ichimoku cloud, RSI, MACD. Very similar pattern is evident on GS & MS.
Default rates on student loans, retail, & personal are climbing. Combined with a mediocre jobs report, this spells out trouble for banks. However, to me, the most important thing is that big banks have continued to do sub-prime loans. They are the loaners of the loaners of the loaners. Many 2nd & 3rd tier subprime loaners have defaulted and declared bankruptcy. This is not good news for big banks, who, in my opinion, have got greedy, again. On top of this, banks did not do exceptionally well in earnings considering the tax cuts of President Trump.
Nearly $200B in likely exposure, at minimum, for the top 6 big banks alone.
wolfstreet.com
wolfstreet.com (I quite like wolfstreet, very well researched analysis, reasonable article, in my opinion)
www.forbes.com

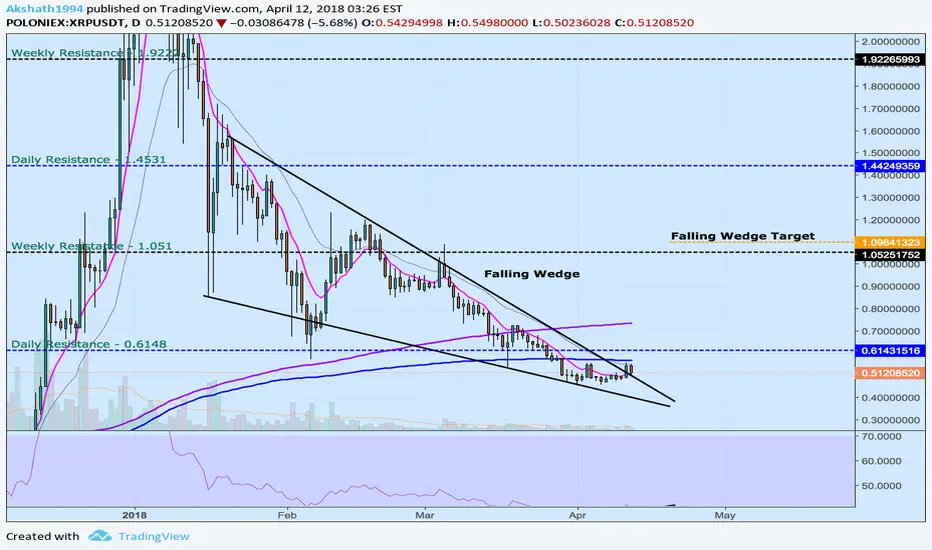
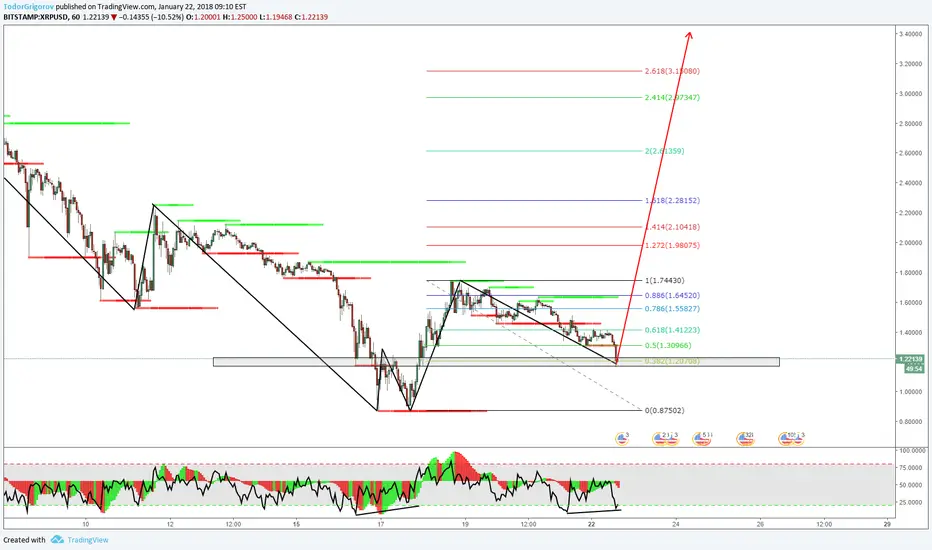
XRP :- FAlling Wedge BreakoutRipple (XRP) :-
Ripple has finally broken out of the falling wedge.There is a possibility of ripple entering back into the wedge and this could then very well categorize itself as a fakeout.
Keep in mind if we do see a jump from here over the blue moving average we could then head to the falling wedge target of over a dollar.
A dollar and 9 cents is the target for the falling wedge and the volume based spike could take only 4-5green days for that to be achieved.
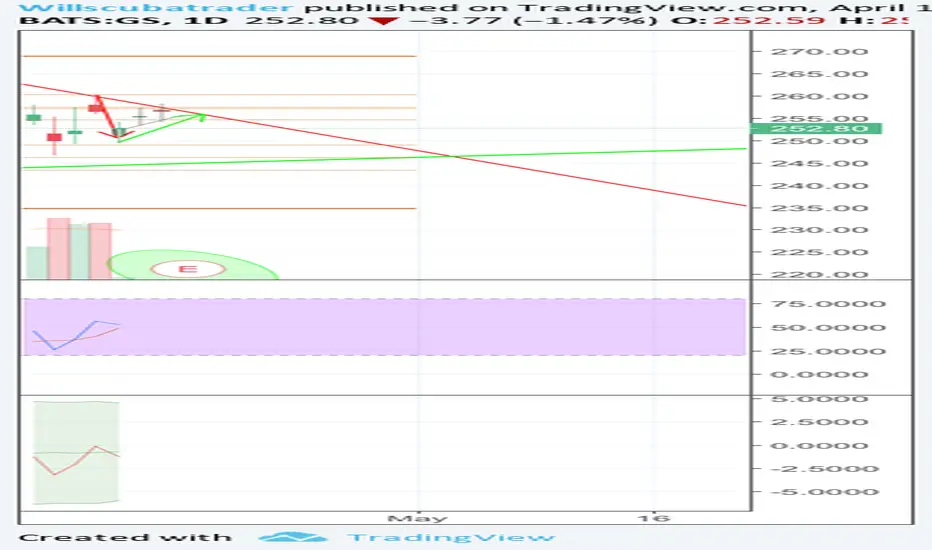
GoldmanSachs ready to shine..? This is one of my shorter time scale predictions heading into the earnings reports coming up.
With all the volatility we have managed to open a couple of more postions during the beginning of the week that are already in the green, these are set with a x1 leverage on our PI profile on eToro (Willscuba).
We currently have a reducing wedge but have seen some drawdowns recently to geo-politics. Making this a good time to increase our exposure by a small margin.
The earnings report is due April 17 before the bell.
The whisper on the street is $6.03 where as the consensus is $5.67.
If the numbers come through better than expected for JPMorgan due this friday before the bell then that should start the ball rolling for all the other financial sector stocks that we are currently holding as they usually trade in sympathy if the first few do well -unless there is a really big red herring that crops up-.
Even if the earnings disapoint we still have almost 20% free in the portfolio to capitalize on the dips that could occur just like we have with all the trade war news and potential rate hikes.
NYSE:GS
PYPL: The New Bank & $80+ PT Range w/ BonusPaypal is and will always be a permanent, financial player. The Venmo acquisition: brilliant. Square, sure, it's growing and has potential. Tell me one person back in 2014 or 2015 that had heard of it over Venmo. Brand recognition and explosive growth make it one of the pinnacles of the PYPL story. Was it expensive at $80? Yes, absolutely. Is it expensive now for what all it has going? Debatable, but I guarantee that it will rise as anything else financially responsible and relevant will.
Technical trading up, over $80 is doable. With a perfect environment and more than likely absurd EC beats, expect a path to $100 if the market is stable and experiencing growth momentum. $100+ prime and over, take your money and sell. Don't be greedy. The Venmo story is real, relevant, impactful and unique. The eBay bs is now absorbed and incompetently understood. No one is thinking of it, so PYPL is a pure, no news related play.

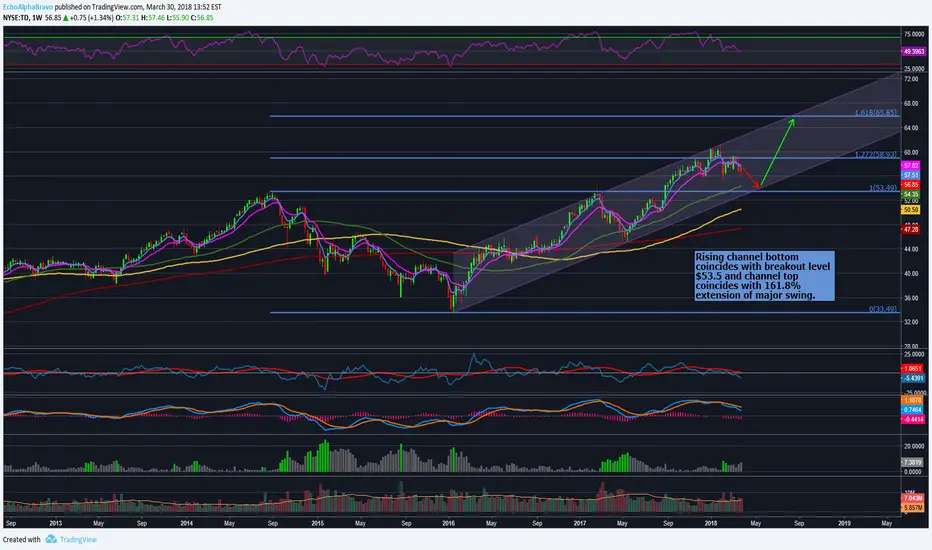
Bullish setup for TDShares of TD appear to be pulling back to test a breakout level at ~$53.50, which coincides with a rising channel bottom. I'm a buyer at that level and will be targeting ~$66 on the upside, or +23% from here. In a rising rate environment and given the technical setup, I expect shares to outperform over the next several months.

Morgan Stanley SHORTShort from $58.02 will continue to short up to $66.
Market Cap - $102.8B
VWAP - 56.77
P/B - 1.49
Debt/Capital - 71.05%
Beta - 1.49
P/E - 18.13
- A major chunk of Morgan Stanley's revenues come from trading activities, which obviously is dependent on what the market is doing. The capital markets have performed very well in the past which lead to decent trading revenues - though since 1Q17 this trend has reversed (which is odd considering what the markets have done since then?!) They have had a slowdown in client activity and the low volatility led to a 1% decline in equity trading and a 4% in fixed income in 2017. This is expected continue in the near term.
- MS 12-month ROE undermines its growth potential. The company's ROE is 10.07% which has gradually improved since the crisis is much lower than the S&P 500's ROE of 16.08%. Showing its not using its shareholder's funds effectively.
- They continue attempting to strengthen their corporate banking section of the company. It was seeing a rise in net interest income over the past couple of years. Though again, since 1Q17 net interest income started to fall. In 2017 the net income interest fell 11% YoY - mainly due to interest expenses up 72%.
NeroTree Capital rates Morgan Stanley as a SELL with a price target of $40 over the next 52w.

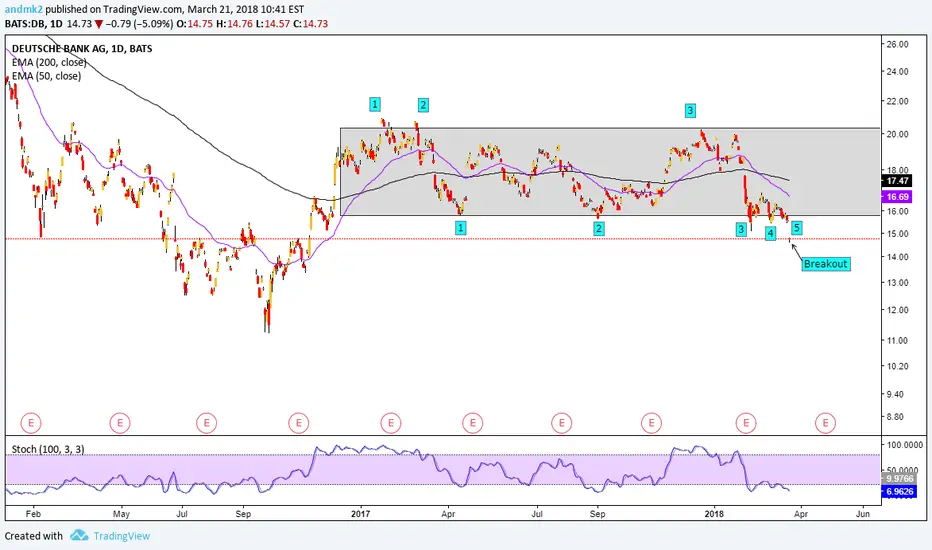
Deutsche bank breaks to the downsideAfter ranging since Dec 2016, DB has broken its rough rectangle
and broken to the downside.
Still bearish
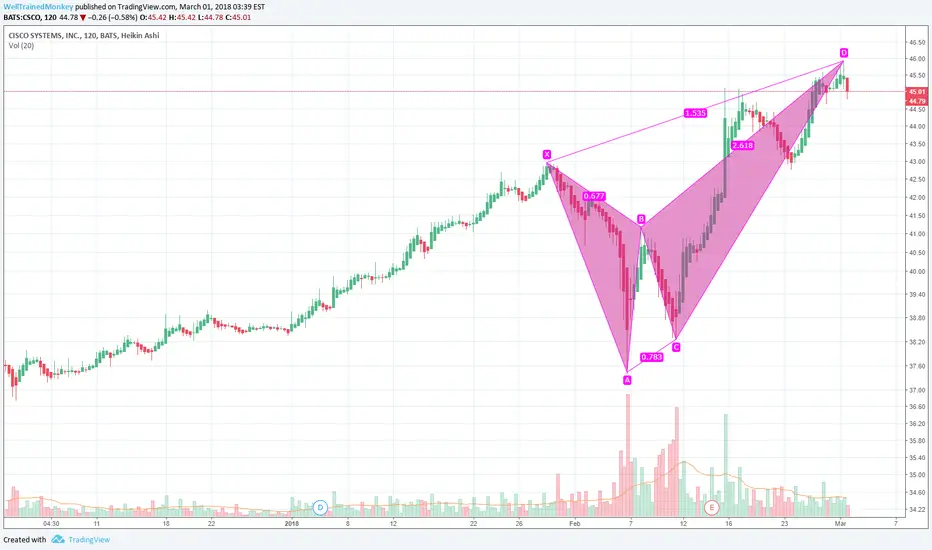
CSCO 120M butterfly reversalIs tech hot steak coming to an end? CSCO exhibiting a beautiful butterfly formation. What other butterflies can you spot? Clue...think banks, big banks...
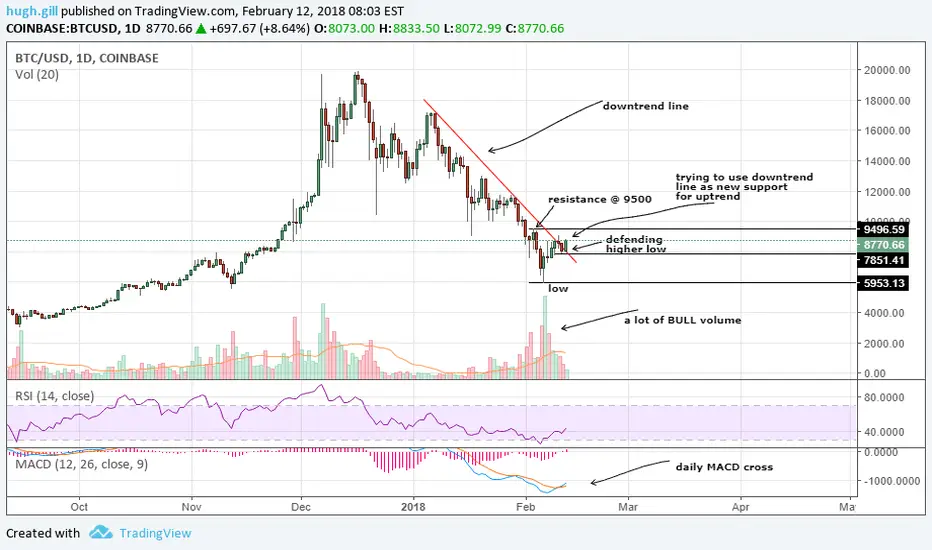
BTC NEEDS Higher LOWBTC needs to form this Higher Low on the daily . If it can the BTC recovery is looking a lot more positive.
The Daily MACD has crossed but BTC still needs to confirm higher low .
The first test is the 9500 level and if BTC can break above this and form a new higher low over the next week this would be a very good sign that the recovery is underway.
Also to note there was a LOT of Bull volume in on the 6k mark which may have signalled the bottom may be in for now
Lets see :)
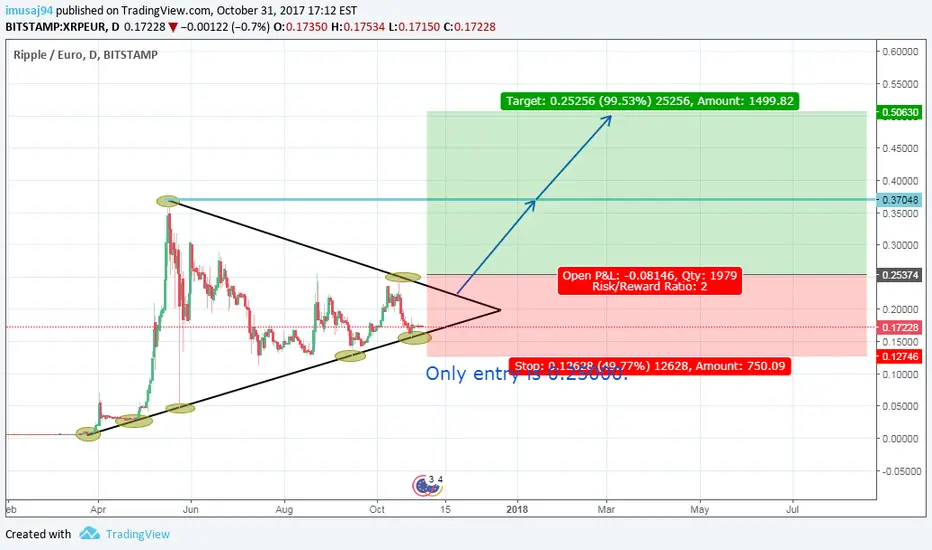
RIPPLE FAKE COIN DOUBLE TOP BUYI dont like XRP to be honest. In my opinion its marketing and idea behind it is to raise its market cap and buy all the other REALLY important cryptos with much higher potential for growth. XRP and its utility in my opinion is not able to reach such high prices as eth or monero or whatever. We might stick in the 1-10$ range. Hopefully I will be wrong and many people will become richer and richer. BUT DONT FORGET ITS CENTRALIZED by WHO DO YOU THINK ??? (Think twise before answering yourself that question) Anyway XRPUSD meets my trading condtions and rules. We have double topped fib retracement some level of support RSI oversold will see how it goes. GOOD LUCK $$$
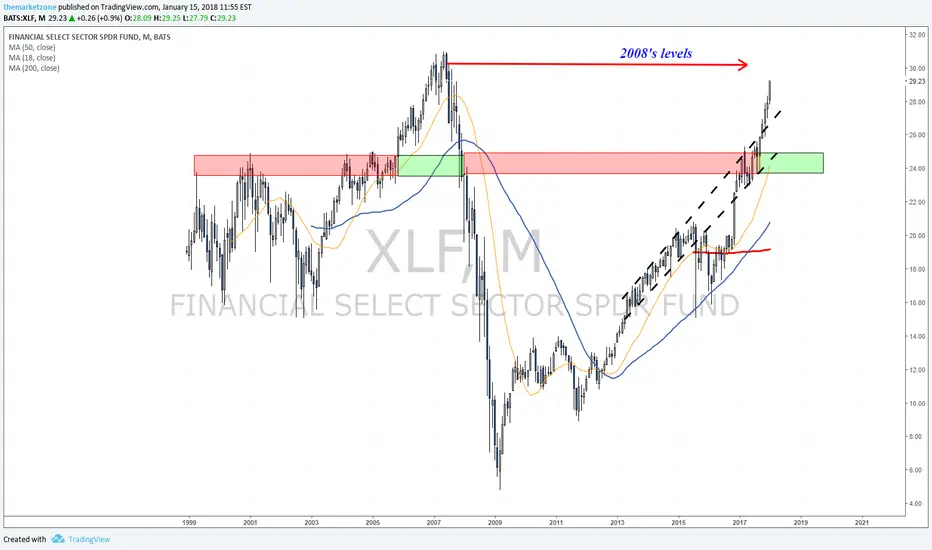
Heading towards levels seen before 2008's crisis Banks earnings, Trump and the Fed drove XLF back to where it was before the major financial crisis of 2008.
10 Years later, will history repeat itself?
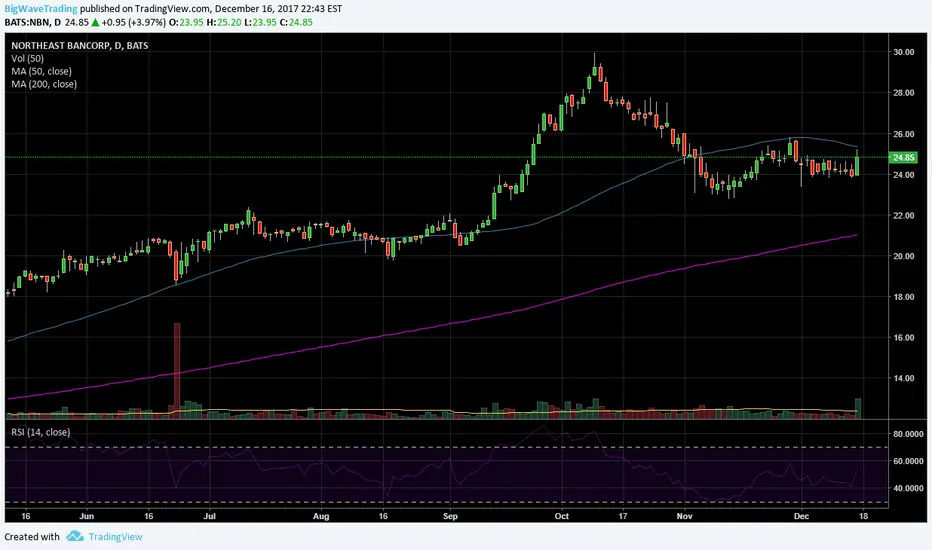
Going long NBN on MondayNBN is printing a bullish full-body candlestick over candlestick price bar on heavier above-average volume with my momentum/trending oscillators confirming the price move. I am going long NBN on Monday using a limit (GTC-BUY-LMT) order @ 25.20. I will have two trailing sell stops (GTC-SELL-STP) @ 23.35 and 22.70 to protect my initial invested capital in case NBN does not move higher immediately. I am expecting a measured move similar to the previous uptrend from November '16 - October '17.
More Italian Bank problems? UniCredit SpA and Intesa Sanpaolo SpA could face combined losses of almost 20 million euros from the failure of Innowatio.
