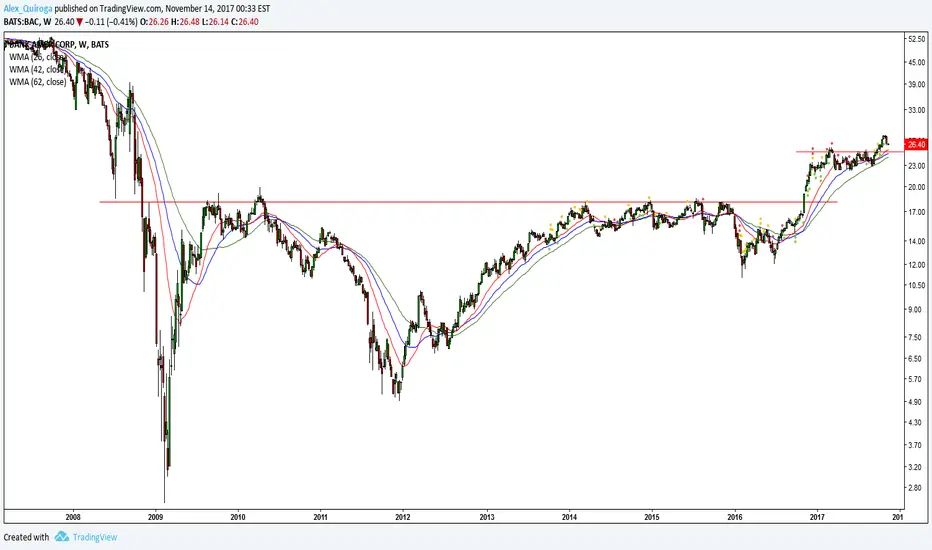
Raising interest rates support this pickYou do not need to be a sophisticated Ph.D. in Economics for understand that Raising interest rates is a god deal for commercial Banks but this do not mean than all the commercial Banks and financial Institutions are in a Bull Trend specially because this sector was punishment during the last financial crisis of 2008 and until recently has begun to show strength based mainly in a Raising interest rates. I Set up a list of more than 140 commercial Banks and Institutions and not all are having a good time.
I select this Bank based in a Basic Understanding of the Fundamentals who move the Stock Market and the Industries and your Sectors.
But always making emphasis in the Chart and with a simple and traditional Technical Analysis (Support and Resistance)
Obviously this pick is with a long term view and with a long term hold period
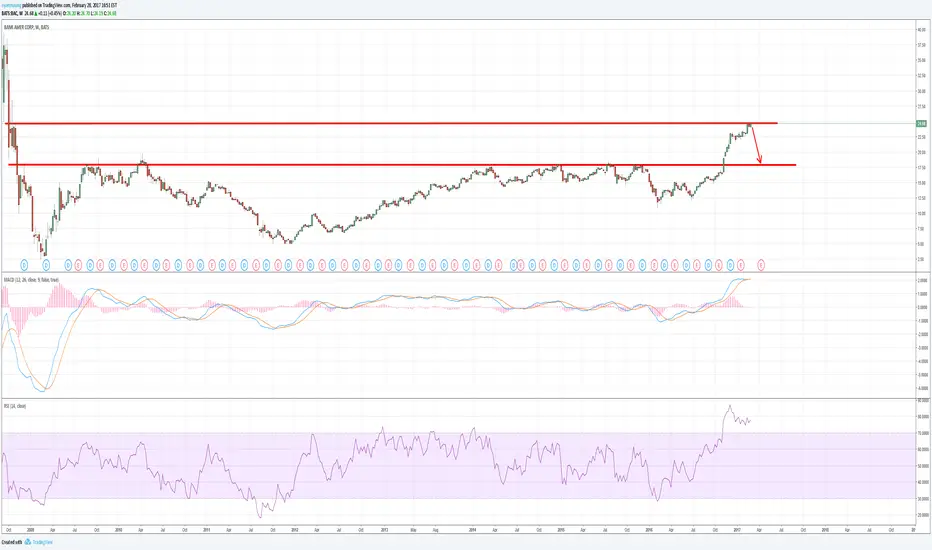
Now Go to Technical: In this case you can watch the resistance breakout around 25.00 or 25.10 "do not get complicated for 0.10" and the pullback who is coming. The pullback need more time, this means need more Days for confirmation, In other words I wanna to Buy this stock at 25.30 or less and not at the actual price of 26.40 for this you can use a order called Buy limit at 25.30 or follow daily this stock and buy at the market .
The other aspect is this do you like this PE Ratio 15.11? Is too High ? compared with the Industry Is Bank of America overvalued ?
Additional Material for learning
www.investopedia.com
www.investopedia.com
www.investopedia.com
www.investopedia.com
Banks
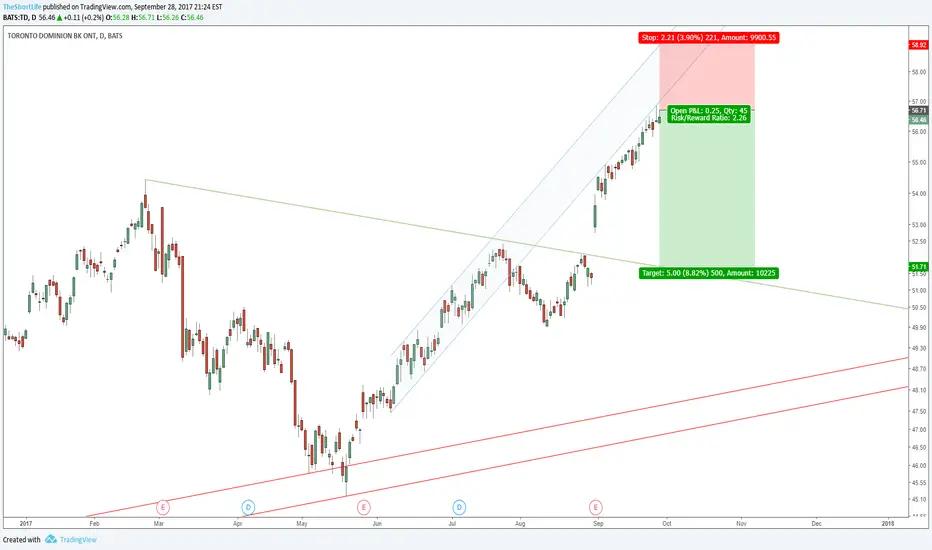
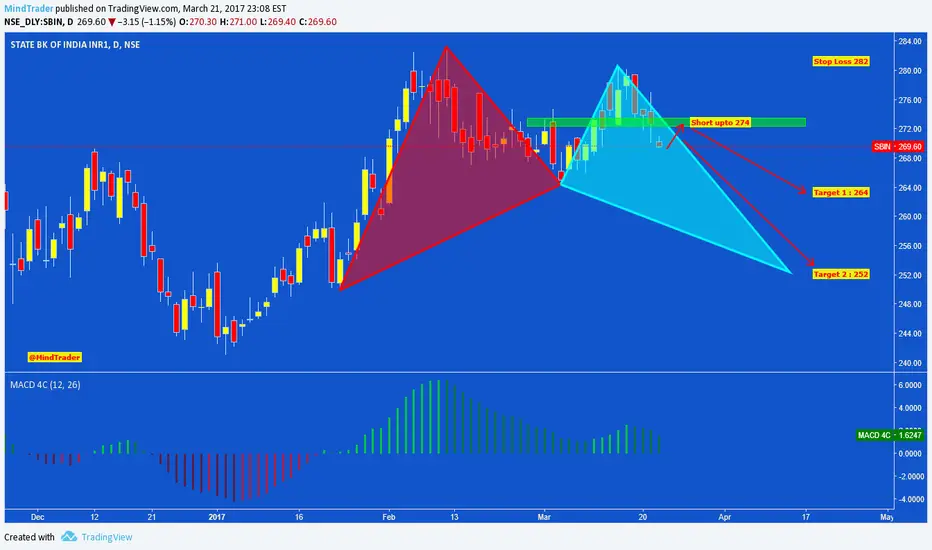
TD high probability shortShort TD
- lots of upper wicks on daily is smart money selling into strength
- bollinger bands tightening means move is coming soon
- retest of red breakout line before moving up higher (see attached chart)
Just a note - the better trade would be to try to grab some shorts once price hits the lower line of the blue channel.
Euro Banks down the drain QE Infinity !!DB will drag down the financials all it takes is for one big bank to lose it before everyone else follows !! Not a Bull market for DB , CS & BCS not looking good.

XLF potential bearish engulfing pattern forming.The XLF was off to the races this morning as the longer-dated maturities of the yield curve sold off, increasing the spread captured by banks who borrow-short and lend-long. In the middle of the day a key reversal occurred, setting us up for a bearish engulfing candle. This chart pattern is a rally above the previous day's high and a close below the previous day's low, and has a high probability of follow-through selling.

Citigroup (C) still has a ways to runI'm simply posting this chart as a reminder how far Citigroup (C) has fallen since its 2008 highs. Rising long rates will benefit the banking sector as banks borrow short and lend long, keeping the spread. Even though the stock has doubled off the lows, it's still priced at 1.0x book (cheapest in the sector, JPM is 1.7x book) and Barron's thinks the shares could appreciate another 50%: www.barrons.com

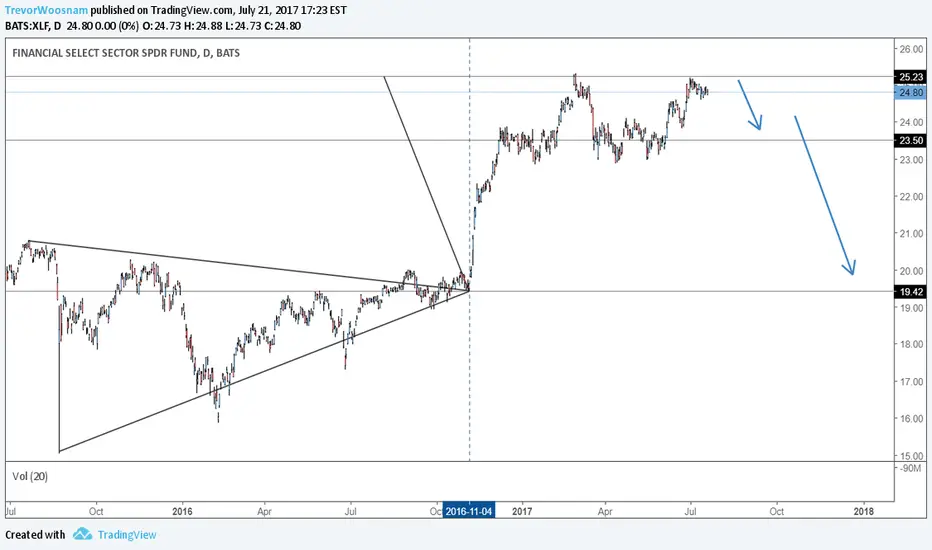
Short FinancialsChart is fairly self explanatory. Target on the HVF has been met and price action now looking toppy with dollar collapsing. Financials need to retrace to 23.5 at the very least, although would expect more depending on rate hike narrative
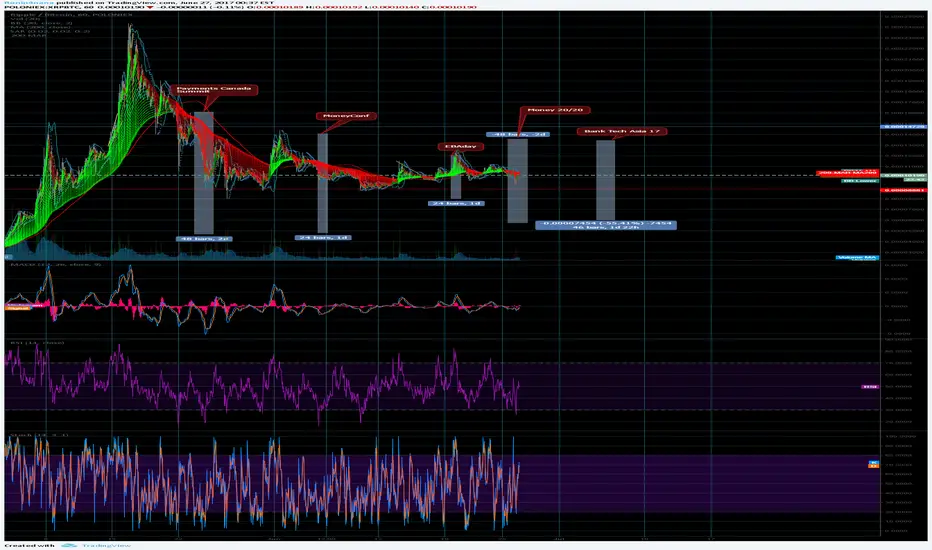
$XRP pre-conference pumpsI think the chart graphically depicts the P&D's coinciding with the various conferences Ripple attends. I expect another pump coming between the XLM/STR giveaway tomorrow and Bank Tech Asian 17.
ABN-AMRO (NL) medium term trend reversal short setupWith general market weakness and a rapidly detiorating banking sector, we are looking for good short-entries. ABNAMRO offers excellent risk/reward opportunities for the next 2-5 months.
EURONEXT:ABN

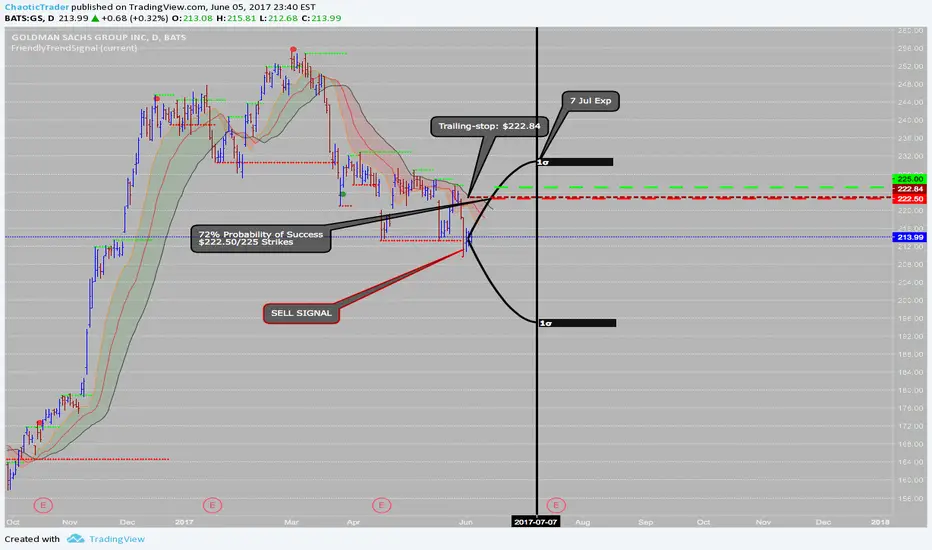
6.5.2017 Trade Idea: GSIf you are interested in more of our trades, check out our profile and Tradingview Indicator @ChaoticTrader
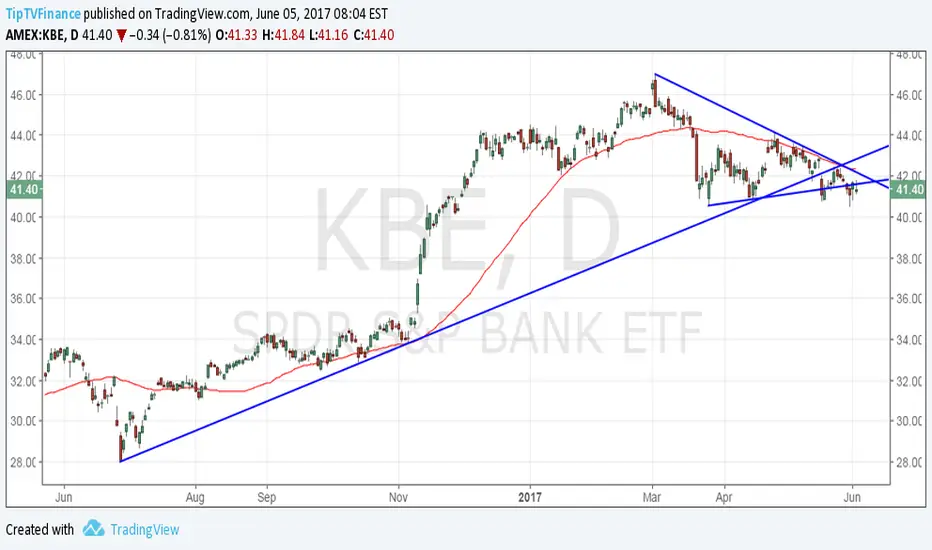
SPRD S&P Bank ETF daily chart looks bearish50-DMA has topped out and is now sloping downwards.
The rising trend line was breached in mid-May. An attempt to take back the rising trend line failed.
We also have a bearish breakdown of the triangle formation.
The bearish price chart suggests bank stocks could lose altitude in the coming days. This goes will with the flattening of the treasury yield curve.
WFC 4HR Chart + Banks up weekWent Long Last Friday $55C and then opened position for $54C today.
Looking at a gap fill around 54.64 with possible continuation to 55.6 for next week.
Nice ascending triangle pattern with 53.45 being breakout area.
Based off todays move I see that and more to come.
-TheTradingNInja

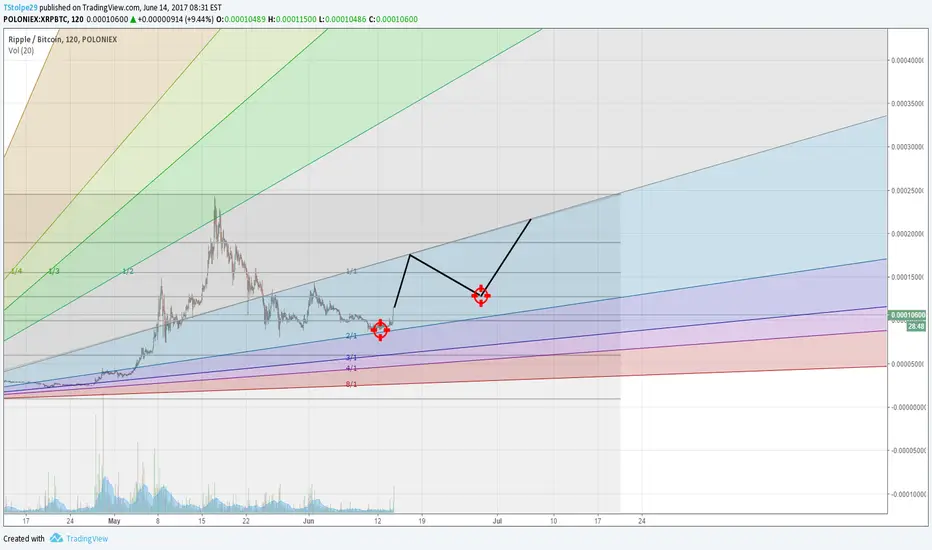
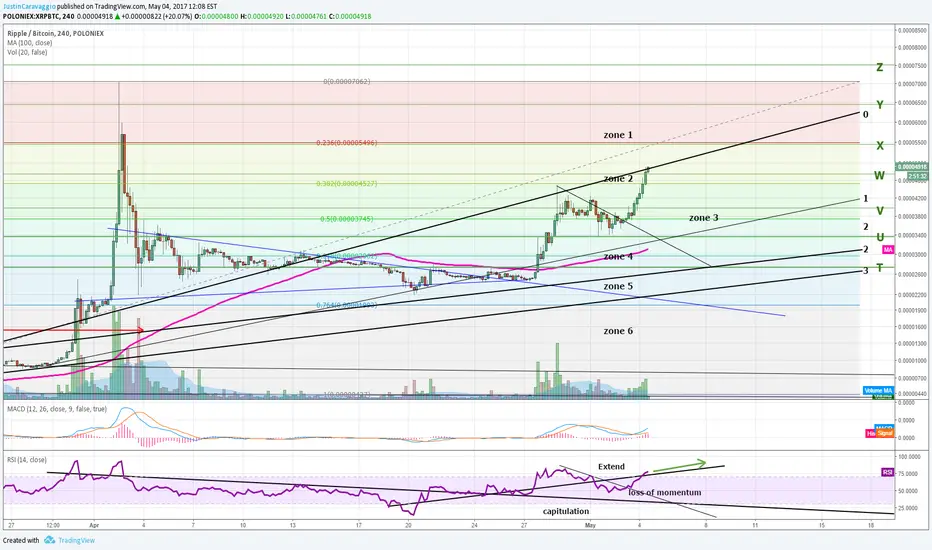
Ripple breaks out of triangleRipple recently broke out of a triangle formation and breached through the 50 and 38% retracements along with long term support lines V and W.
We met resistance at diagonal line 0 and are currently building support at line W
I suspect we build some support between lines W, X and the 38% retracement, as we continue to test diagonal line 0 in zone 2
Bank of America and the So-Called "Trump Rally"Bank of America was supposed to jump anyway. The current drop is not Trump’s fault, either. BAC is still in a long-term uptrend.

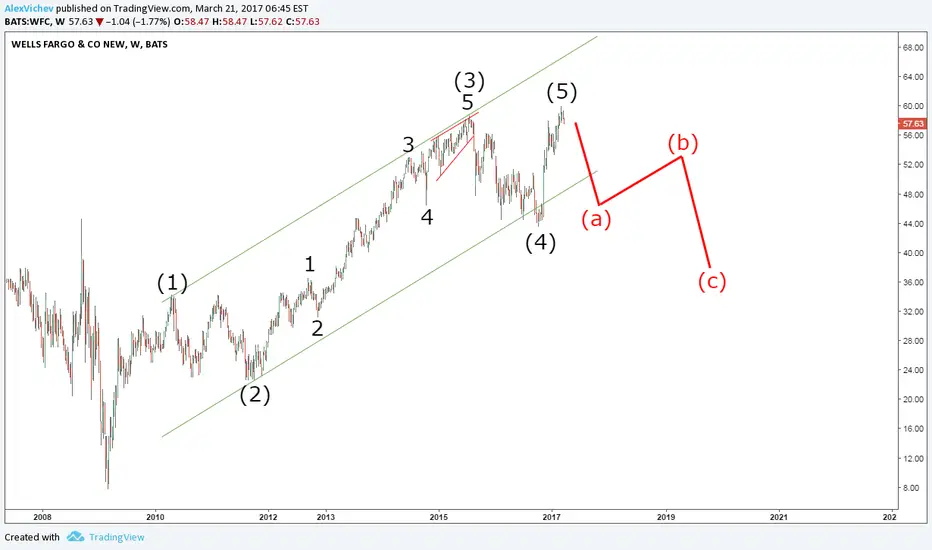
Wells Fargo to Lose 30% From Now On?If this is the correct count, Wells Fargo investors should get ready for another sell-off towards the $40 mark.
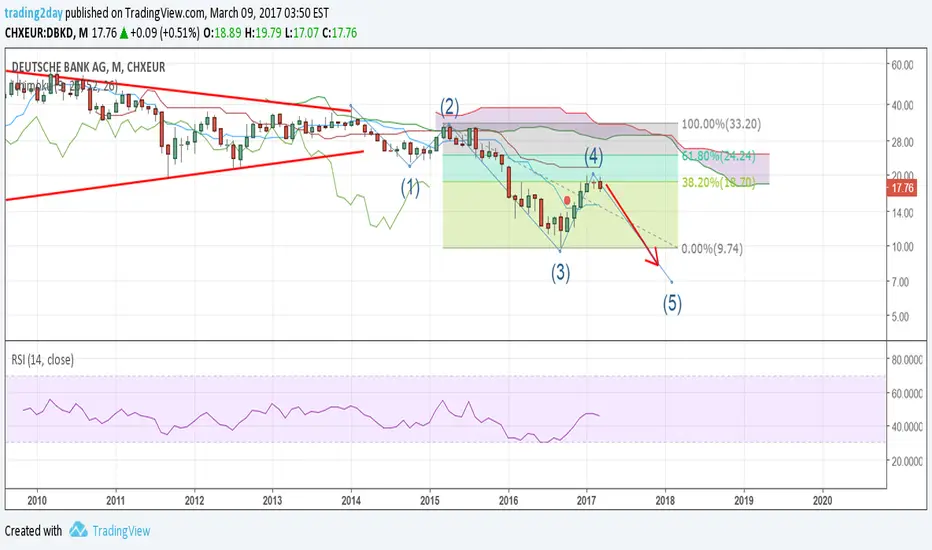
DEUTSCHE BANK wave 4 might be over.There are increased chances that wave 4 was complete in Deutsche BANK right on the 38% Fibonacci retracement. The recent decline from 19.79€ is impulsive with 5 waves complete at 17.07€. I expect a bounce towards 18-18.50€ for wave 2 and then a strong wave 3 downwards targeting 15.50€ first and then 13.80€. Stop for this idea is the recent high. Confirmation will come with the break below 17.07€.
Barclays ready to break 3-month rangeBarclays has been in this range since December. I see prices moving lower before tracking higher to the psychological 250.00 level

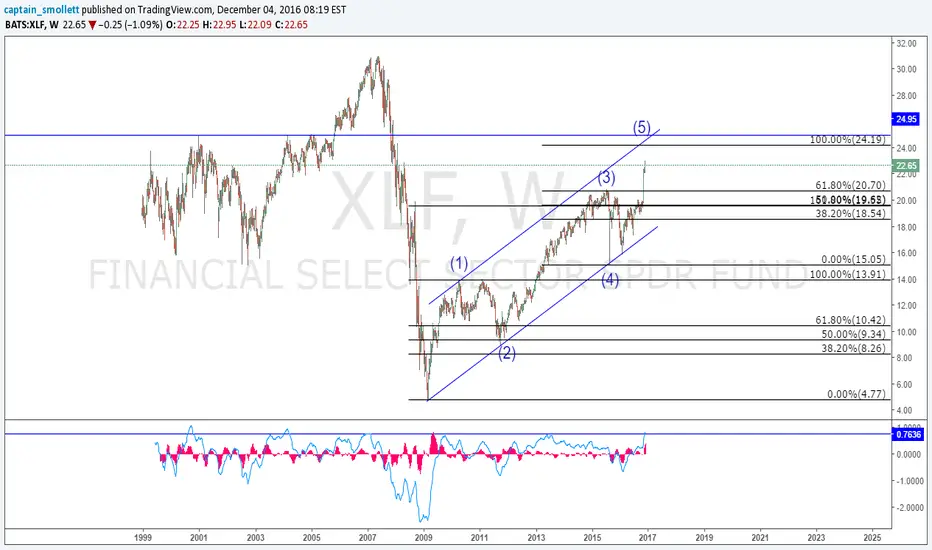
XLF. Welcome to hell!I will try to call a multi-year top on the XLF fund. Will short from 25, targeting... Probably, 12.
But my main question is: was the whole movement from 2009 to now a wave 1 or it was a B and we still wil see a Wave C? If that was a B, then we can probably say: welcome to hell, banks! Hope you enjoy your stay here