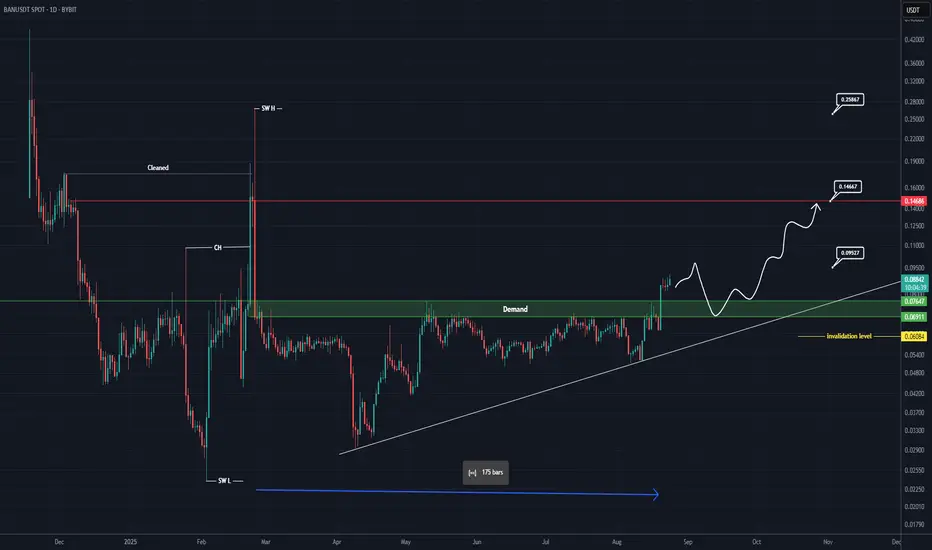
BAN Looks Bullish (1D)After 175 days, the price has managed to break out of an important level. Now, during the pullback, we can look for buying opportunities on BAN around the green zone.
The targets are marked on the chart.
Keep in mind that this is a low-volume altcoin, so manage your risk carefully and enter the position with a small size.
A daily candle closing below the invalidation level would nullify this analysis.
For risk management, please don't forget stop loss and capital management
When we reach the first target, save some profit and then change the stop to entry
Comment if you have any questions
Thank You
BANUSD
BAN Analysis (8H) This coin is somewhat risky and highly volatile, so only allocate a small amount of capital.
From the point where we placed the green arrow on the chart, a bullish phase seems to have formed on the BAN chart. This phase appears to be a diametric pattern, and we are currently in its final wave, wave G.
If the price reaches the red zone, we can look for sell/short positions.
A daily candle closing above the invalidation level will invalidate this analysis.
For risk management, please don't forget stop loss and capital management
Comment if you have any questions
Thank You
