How to Choose Chart Types in TradingViewThis tutorial covers the 21 chart types available in TradingView, explaining what each one is, how to read it, as well as the advantages and drawbacks.
Learn more about trading futures with Optimus Futures using the TradingView platform here: www.optimusfutures.com
Disclaimer:
There is a substantial risk of loss in futures trading. Past performance is not indicative of future results. Please trade only with risk capital. We are not responsible for any third-party links, comments, or content shared on TradingView. Any opinions, links, or messages posted by users on TradingView do not represent our views or recommendations. Please exercise your own judgment and due diligence when engaging with any external content or user commentary.
This video represents the opinion of Optimus Futures and is intended for educational purposes only. Chart interpretations are presented solely to illustrate objective technical concepts and should not be viewed as predictive of future market behavior. In our opinion, charts are analytical tools—not forecasting instruments. Market conditions are constantly evolving, and all trading decisions should be made independently, with careful consideration of individual risk tolerance and financial objectives.
Barchart

Support and Resistance Markup Here is how I markup my 4 hour chart for Bitcoin. The candlestick chart isn't used very much for marking up as it doesn't provide the same amount of data as the line chart. I also toggle between the bar chart to provide more data when it comes to seeking a specific wick.

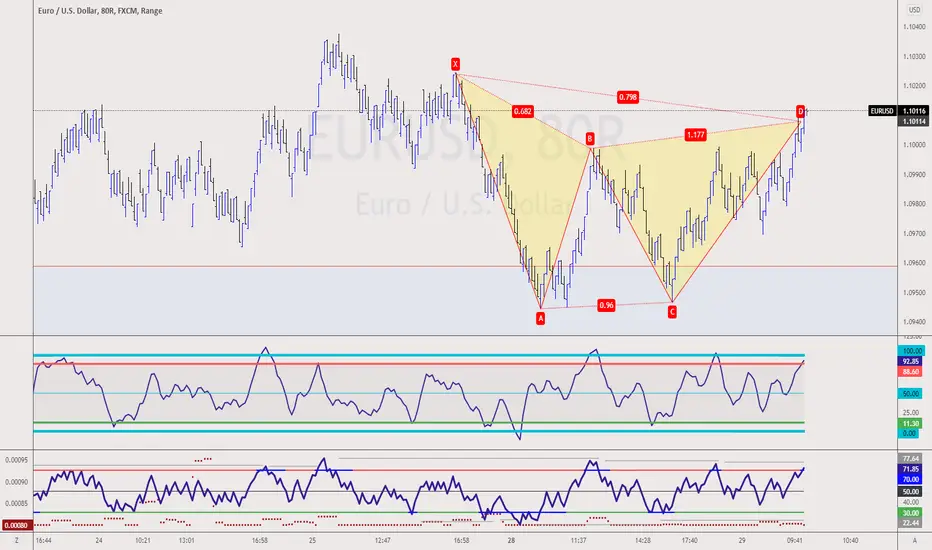
EURUSD - Bearish GartleyBearish Gartley on range bar chart has retest. There are risks in this setup, however, rules are rules, they fulfil my criteria and I'm in.
Let's see how this goes.
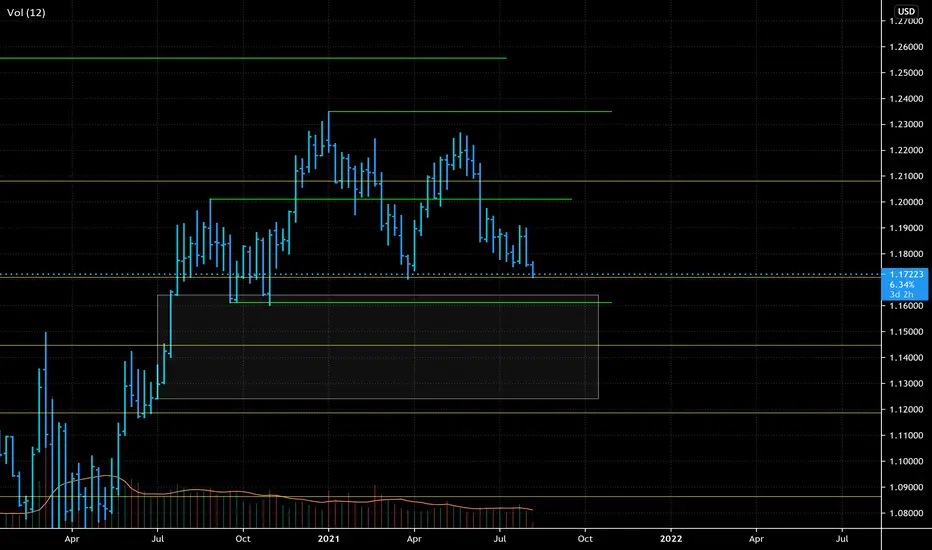
Buy potential after testing that boxed area?-For now just shorting this trend but this pullback might be the beginning of a good uptrend!
GBPCHF short ideaGBPCHF trading around the top of a range. Demand zone to the left on the 1h and daily tf. Previous RSI divergence shows trend is weakening. Entry on round number 1.22000. 25 pip stop 75 pip tp 1:3 R:R

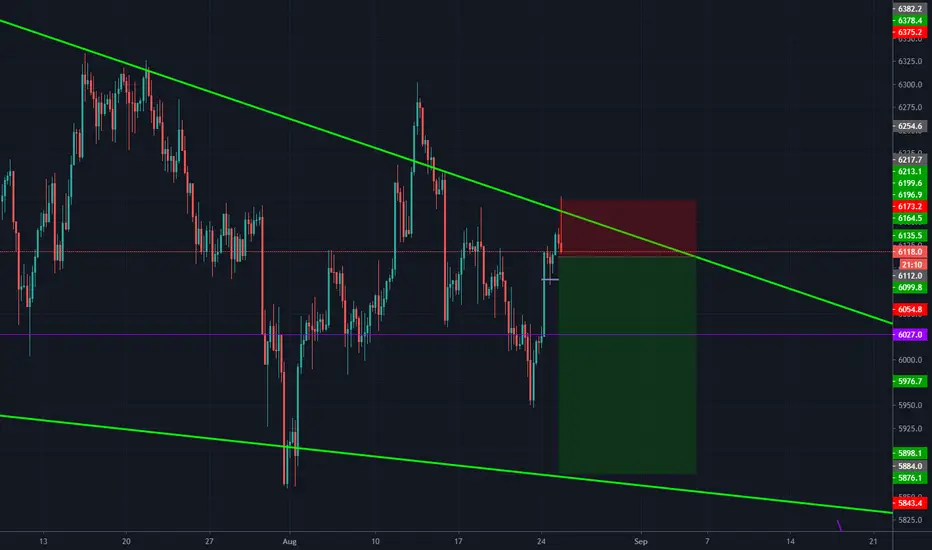
UK100 Reversal Or Not?Depending on how this 4hr candle closes, , we could be seeing a reversal.
Otherwise a filled wick and 6300 upcoming.
AXSM Going Parabolic!I first started tracking AXSM on Monday Jan 7th (Pre-market at approx. $5.00), and it has since Sky-Rocketed to a high of $17.05 today pre-market Tuesday March 26th representing 248% in Gains, locking in enormous profits.

CRUFF "BULLISH" GOLDEN CROSSCRUUF is now displaying one of my favorite bullish signals - GOLDEN CROSS
Also, very bullish is its current buy opinion by one of Wall Street’s leading Technical indicators barchart.com, which just issued CRUUF an 80% "Buy" short term! > Hence Time Sensitive?

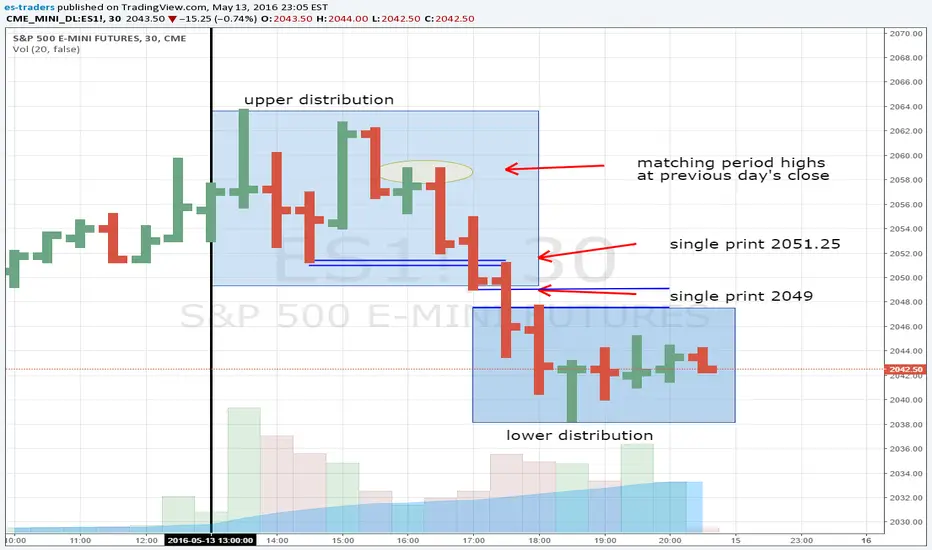
S&P 500 emini futures day trade ideas for Monday, May 16Although I do not have access to a Market Profile indicator on TradingView , I've shaded in the areas (on a 30 minute bar chart) where I see two separate distributions from Friday's double distribution trend day selloff.
If the market opens Monday in the lower distribution, I would look to enter a day trade short if price rallies to the high of this balance and fails, re-entering the lower distribution below 2047.75 with a stop above 2049.25 (back inside the upper distribution). There is also a single print at 2051.25 and may be a more attractive spec short, as that level could be considered the "spike base" from Friday's earlier 3rd period low.
Short targets would initially be Friday's low, and possibly to test last week's low at 2033.75. If that weekly low fails it opens up the possibility of trading down to 2026.00, which below that would stop the one time-framing higher on the monthly bar.
If price opens Monday in Friday's upper distribution ideally I would look for a long entry if price trades down to 2047.75 with a small stop just back into that lower distribution, with initial profit target of 2058.75 - where mechanically two 30 minute periods sold off from (mechanical because it was Thursday's close).
With declining NYSE volume Friday of 3.5 billion, Friday's selloff could be attributed more to weekly options expiration, and the market could be very short. With any trade monitor for continuation, and look out for a possible short covering rally.
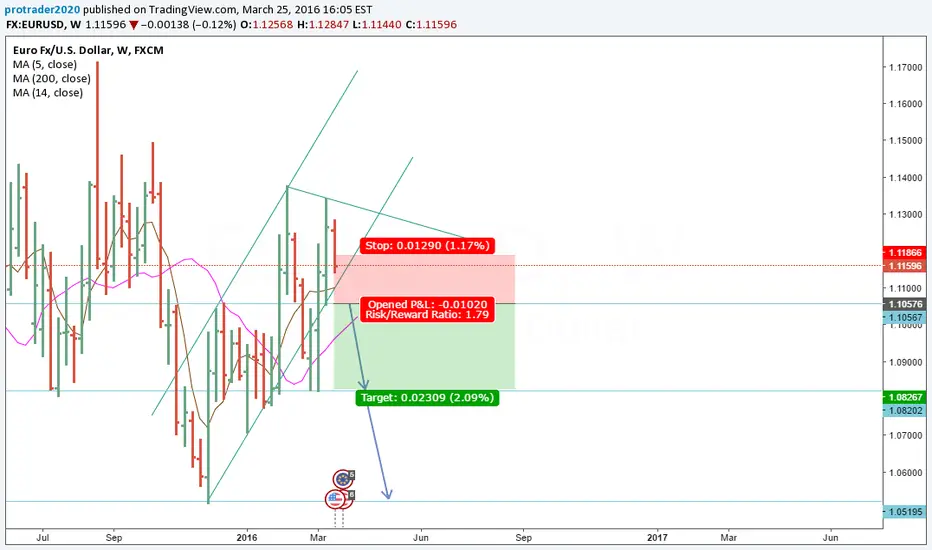
Long-Term view of the EURUSD pairThe pair is trending in an ascending channel and in the weekly chart it is clear that we will have an inside bar which extend my view over the next upcoming weeks for a down trend. I setup a pending short position on the chart. Wish you have a great weekend.