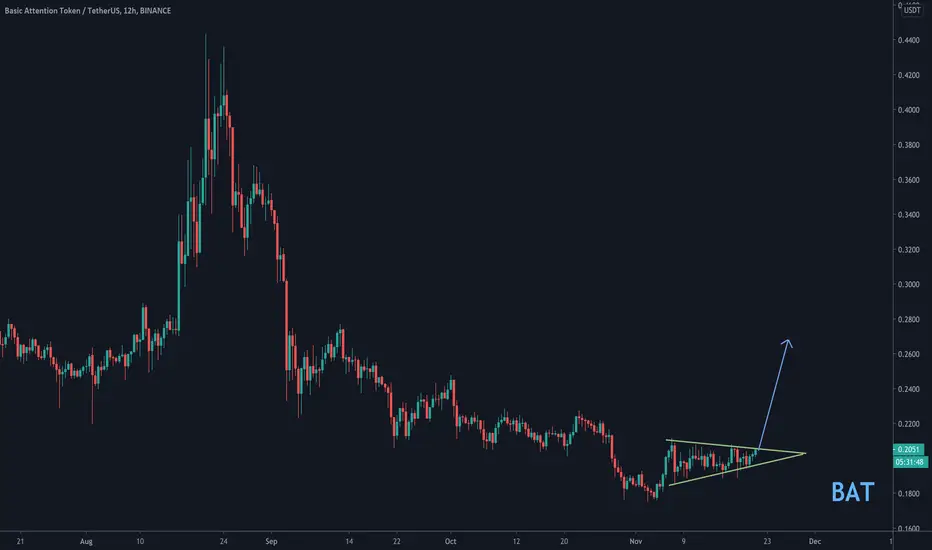
Easy BAT Scalp of +30% on the next leg up. Just be patient.The Bull Flag Pattern on Bat
The last two flag poles have been +32% profit
If you set your sell point at 32% profit it should be an
easy automatic set and forget trade from here.
Batusdtlong

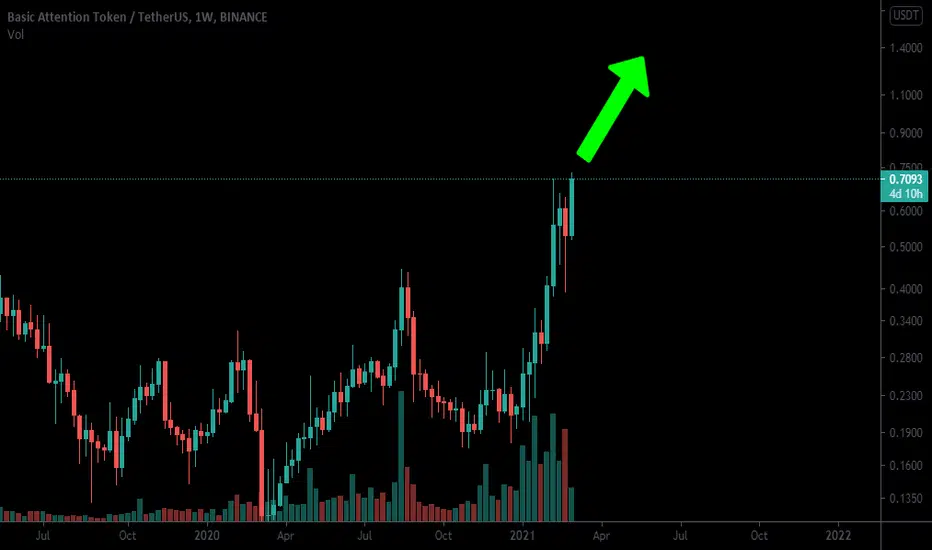
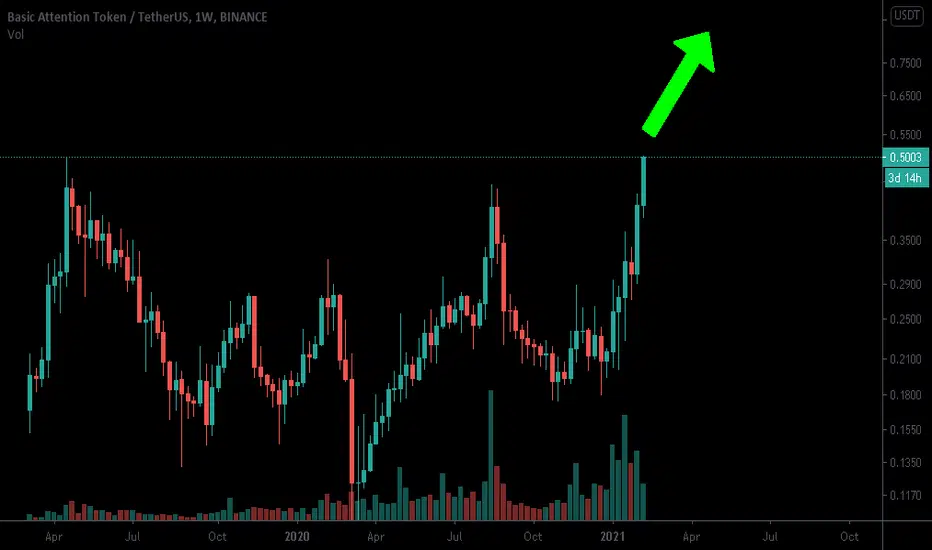
BAT to $3 by AugustCould BAT ever hit $3?
Earliest
Based on short term trend lines which are less accurate than long term trend lines, we could see BAT hit $3 between Early May to Mid August.
Latest
Based on long term trend lines BAT could hit $3 between April 2022 and September 2023
My Conclusion:
Because we are in a bull market and still have a lot of steam left to go, I see BAT hitting $3 by August

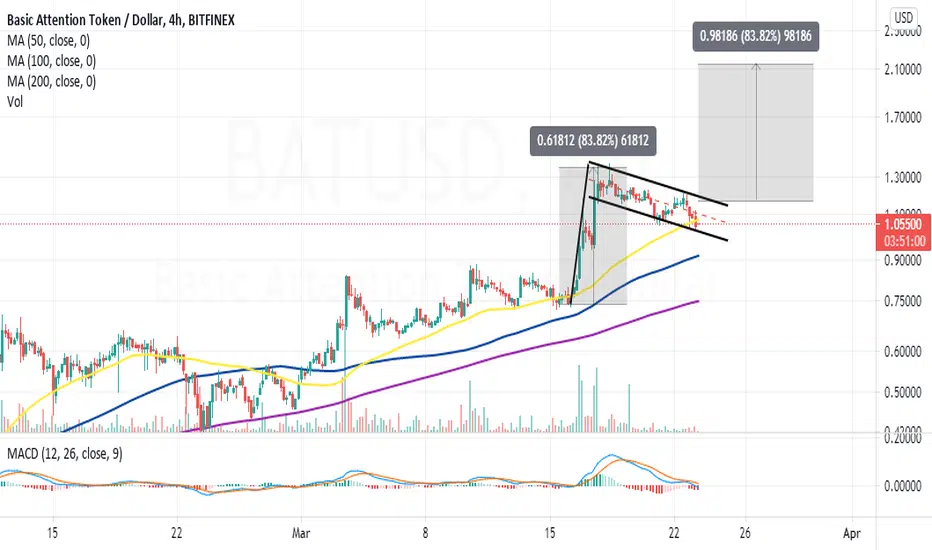
BAT moves closer to colossal breakout eyeing $2.1
Basic Attention Token is looking forward to a possible upswing from a bull flag pattern.
Support above $1 is critical to the upswing, likely to be validated by price action beyond the 50 SMA.
Losses will come into play if the descending parallel channel support is broken.
Basic Attention Token is trading is dealing with a retreat following a majestic upswing in mid-March. The digital asset hit a wall at $1.38, cutting short the massive liftoff. At the time of writing, BAT is exchanging hands at $1.08. If a technical pattern on the 4-hour chart matures as expected, this token will assume the trajectory toward $2.1.
Meanwhile, the least resistance path is downwards, as observed with the Moving Average Convergence Divergence (MACD). This indicator tracks an asset's trend and measures its momentum. The MACD can be used to identify buy the bottom and sell the top levels.
For now, BAT is in the bear's hands, a situation that has been reinforced by the MACD line (blue) sliding under the signal line. The downtrend may continue if the indicator remains with the negative gradient.
However, it is essential to realize that Basic Attention Token seeks support at the descending parallel channel that may mature into a bull flag pattern. This pattern is bullish and may see BAT resume the uptrend, targeting an 84% upswing to $2.1. The length of the flag pole measures the breakout target from the bull flag.
It is worth mentioning that BAT has a bearish impulse according to the Moving Average Convergence Divergence (MACD). If the indicator's downtrend remains intact, the flag pattern will fail to confirm.
Note that a break under the descending channel may extend the bearish leg to the 100 Simple Moving Average (SMA), currently at $0.9. Extended losses will stretch out toward $0.75, support illustrated by the 200 SMA.
Basic Attention Token intraday levels
Spot rate: $1.04
Relative change: -0.05
Percentage change: -4.7%
Trend: Bearish
Volatility: High
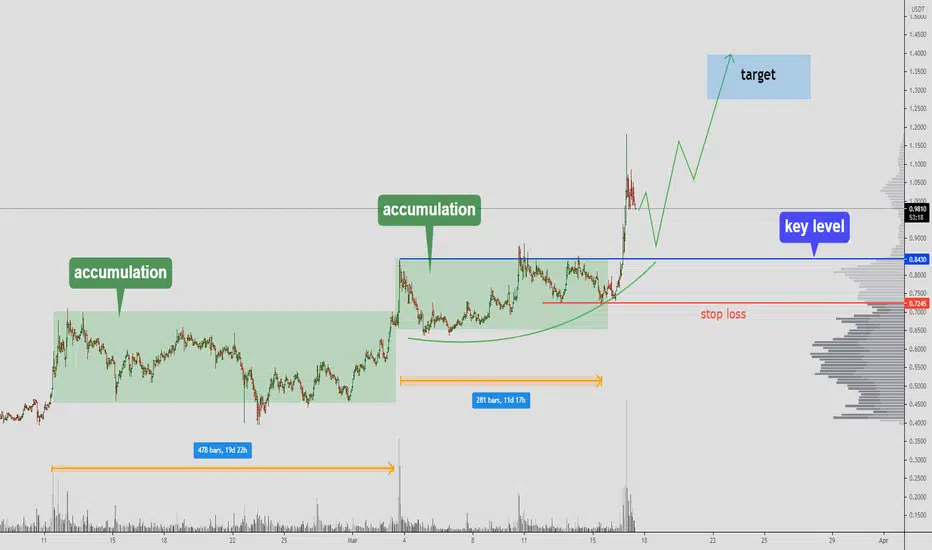
BATUSDT - bullish trend preconditions:
- second accumulation
- key level
- waiting for a correction
- global uptrend
- local uptrend
Push like if you think this is a useful idea!
Before to trade my ideas make your own analysis.
Thanks for your support!
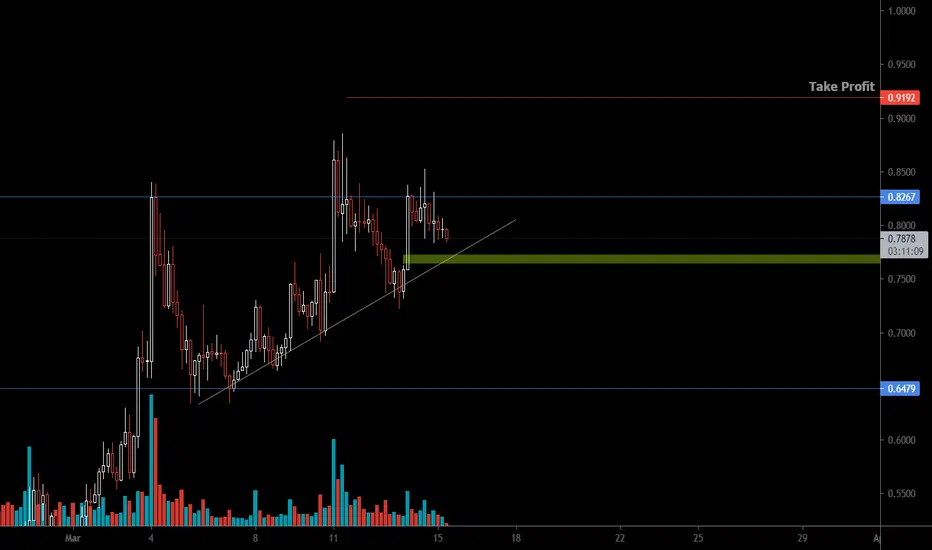
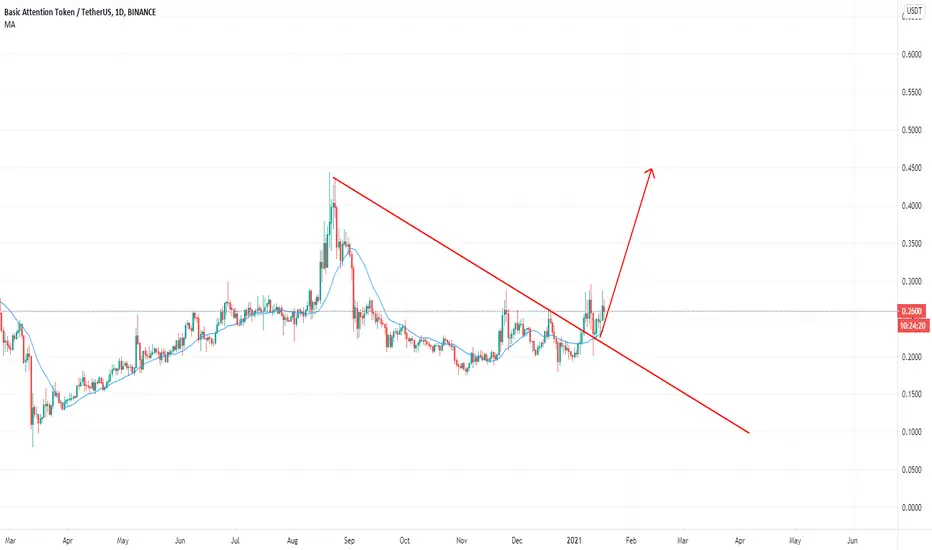
BAT building a new falling wedge LOLThings are playing out just as we expected.
Two new potential areas to touch.
Falling Wedge forming again. I expect it to come down
BAT loves the falling wedge haha.
More info is written on the chart.

BATUSDT - My campaign in futuresBAT still needs to peform in comparison to the others and fairly unervalued as of now. On higher TF's it has clearly broken out of accumulatuion range, my initial spot buy was around 0.4230 and has a great potential towards 7$ region approx.
However, I see a decent setup on lower time worth to play on futures and stops to be placed based on risk put in.
All the best!
Here I go long on Basic Attention Token and BAT will go upHere I go long on Basic Attention Token. The price is testing the major resistance, so now I go 5x long and the bullish breakout will start. See you up there
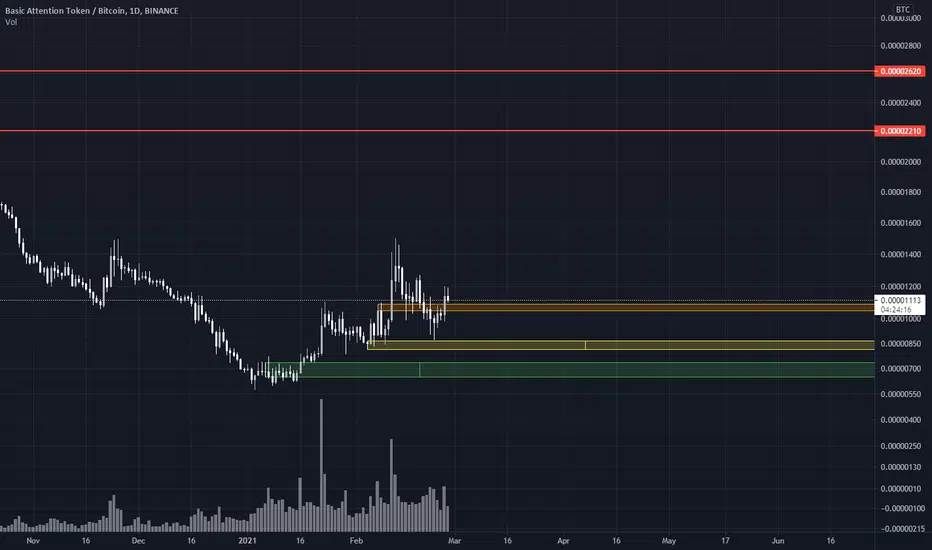
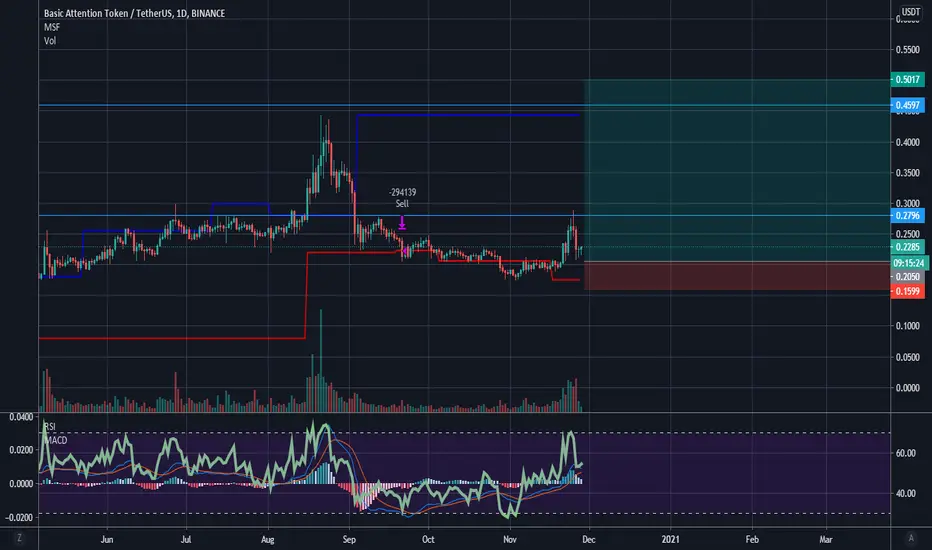
BATBTC. New ATH. SoonHey everyone, we decided to show our BAT analysis results.
Unfortunately, we cannot disclose details of the process. Since this is our development.
Those who subscribed to us in the discord long time know that our approach works.
We cannot recommend buying BAT now as there is a high risk of loss.
In this case, the risk is about 40%, which is quite a lot.
But what can we do to reduce the risk?
Ideal to buy in the green zone. But the market may not give us this price.
If you are not afraid of a drawdown. You can buy in the orange and yellow zone.
You can also place multiple orders in each zone. To get the best average price and normal risk.
The sales area is marked with red lines. 2210 and 2620.
Yes, we can get 100-130% in profit for the next 3-4 months.
Recall that it is very dangerous to enter the position of altcoins for more than 5% of the capital.
Stick to risk management.
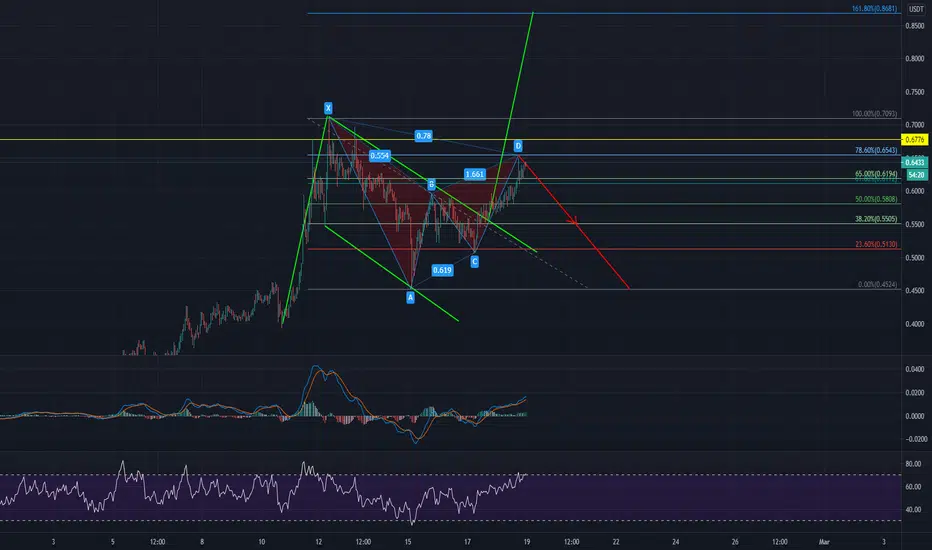
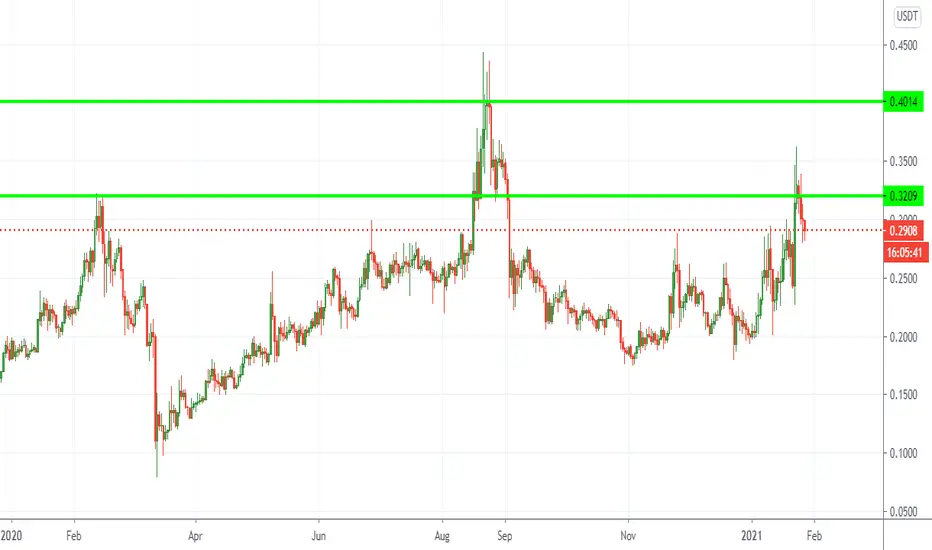
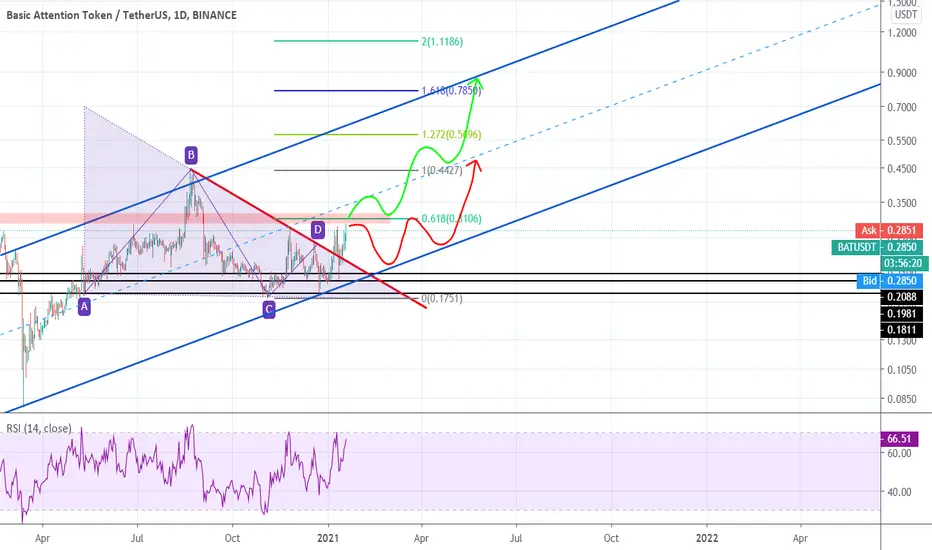
BATUSDT at a decisive level: 0.85 or 0.45 ?2 very nice patterns : showing a decisive point.
A Gartley with targets at 0.55 and 0.45
and
A bull flag with a target for the pole at exactly 161.8 Fibonacci level
For the bullish scenario, it has som important resistances to break tho with a bounce on 78.6%. Going for a retest ?
Interestingly, a strong sign would be a nice coup and handle pattern to form, which would retest the breakout and then confirm it on Daily chart. Please see the linked chart.
Here I go long on Basic Attention Token and BAT will go upHere I go long on Basic Attention Token. The price is testing the major resistance, so now I go 5x long and the bullish breakout will start. See you up there
BATUSDT - bull triangle Preconditions:
- global uptrend
- local uptrend
- wait break out the trend line
Push like if you think this is a useful idea!
Before to trade my ideas make your own analysis.
Write your comments and questions here!
Thanks for your support!
BATUSDTI think we have two way to up, red line and green line, it will depend to break the red box as strong resistance,
if you liked this idea or have your opinion on it, write in the comments and like it, I will be glad. Things can change... The markets are always changing and even with all these signals, the market changes tend to be strong and fast Thank you for seeing idea . Have a nice day and Good luck.
BATUSDTBAT looks like he will explode.
Good teamwork from devs will give the result.
One of my longhold favorite coin.
We will talk more after we get 0.5$.
BATUSDT Descending Channel BREAKOUTBAT/USDT currently trading at $0.221
LONG ENTRY LEVEL :$ 0.205 to 0.222
STOP LOSS ( support): Below $0.186
Resistance level 1(Target) : $0.275
Resistance Level 2(Target): $0.315
Resistance Level 3(Target): $0.435
Risk Reward Ratio: 1:6
Max Leverage: 5X
ALWAYS KEEP STOP LOSS...
Please Follow our Tradingview Account, Like, Share and Comment your thoughts

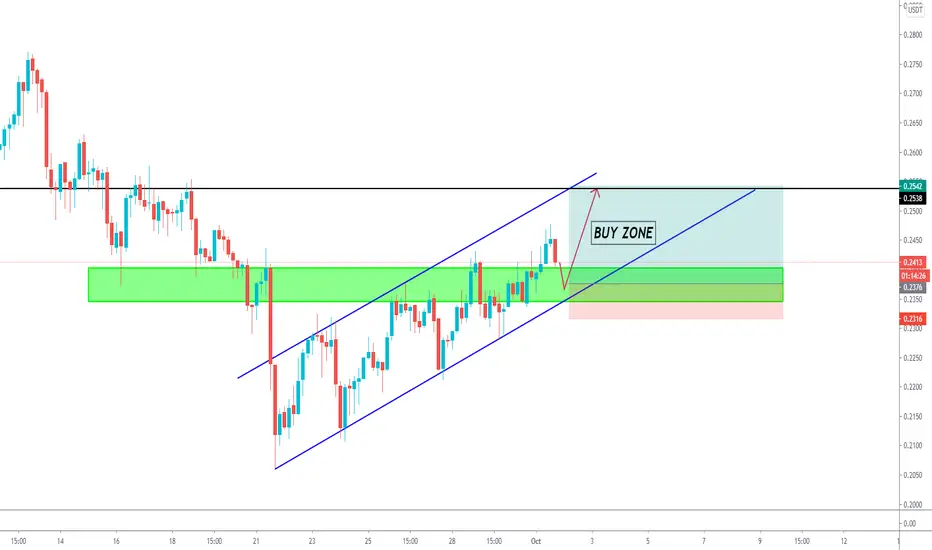
BATUSDT [H4] Coming to support ??? ✅✅✅BATUSDT Coming to support ??? ✅✅✅
Noe BATUSDT Running on Up channel wait until hiting on Support
Howto trade ??
When price hitting on support entry BUY
📣📣📣 IMPORTANT
❌ IF BREAK SUPPORT NO TRADE ❌
Next Station 🚩 0.253X
Support 🚩 0.237X
Good luck
Ton Trader
🔥 THAILAND 🔥
BAT ready for BULL RUN - (Currently at MONTHLY SUPPORT)#BATBTC Technical Analysis Update:
Reasons for BULLISH MOVE:
1. BAT is currently at a monthly level(Support) around 2125 sats.
2. BAT is also near the DEMAND ZONE. If we look back on 30 SEP 2019 (BAT was in DEMAND ZONE, After which it did 75 % percent UP MOVE), right now after 1 year, again we are in the same DEMAND ZONE.
3. BAT back in 04 MAY Week was also in DEMAND ZONE, after which it went again 75% up. So whenever, BAT comes into DEMAND ZONE, it flys afterward.
4. BAT has been in accumulation ZONE since DECEMBER 2019, so huge breakout can be expected in coming weeks.
5. BAT Price has been fallen in the last month but the important thing to note is that there is no selling volume. The amount of distribution volume is very low, which means the downtrend is not supported by the volume. and we can expect BULLISH move.
Reasons For Bearish (In case)
1. Bitcoin Dominance can cause all the ALTS to PUMP & DUMP. Always watch out the levels of bitcoin dominance.
If Bitcoin Dominance Increase & Bitcoin Price Increase >>>> Then Alts BLEED/DUMP/BEARISH
If Bitcoin Dominance Decrease & Bitcoin Price Increase or Sideways >>>> Then Alts PUMP/MOON/BULLISH
If Bitcoin Dominance Increase & Bitcoin Price decrease >>>>> Then ALTS DUMP >>> Accumulate FIAT(USDT) in that situation.
Thanks.
Stay Tuned.
Support needed just give me a thumbs UP if I deserve, otherwise, Thanks anyways. Stay Blessed.

BAT vs USDT ---LONG--- 09.09.20#BATUSDT
Type: LONG
Buy at: 0.240 - 0.255
Size: 3%
Target:
1) 0.278
2) 0.300
3) 0.320
SL: below 0.220


