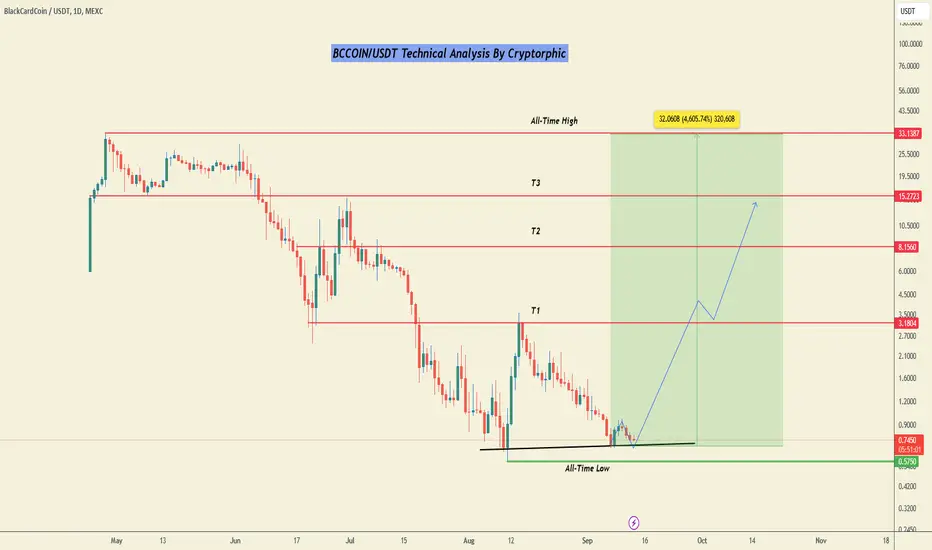
BCCOIN: The big move is yet to Happen!BCCOIN is currently in an accumulation phase, testing the support trendline and potentially forming a double-bottom pattern. This coin is yet to explode and once it does, its upward movement could be significant.
The all-time low of $0.5750 and the current support at $0.6732 are crucial levels that need to hold. This range represents an ideal accumulation zone, and if a rebound occurs, it could ignite an epic bullish rally.
Here are some key observations:
- Support: $0.5750-$0.6732.
- Accumulation: $0.5750 to CMP.
- Short-term Target: $3.
- Long-term Targets: $5.7, $8, $12, $15.27, $22.8, & $33.
Note: Accumulate the dip and trade carefully.
DYOR. NFA.
Please hit the like button to support my content and share your thoughts in the comment section. Feel free to request any chart analysis you’d like to see!
Thank you!
#PEACE
BCCOINUSDT
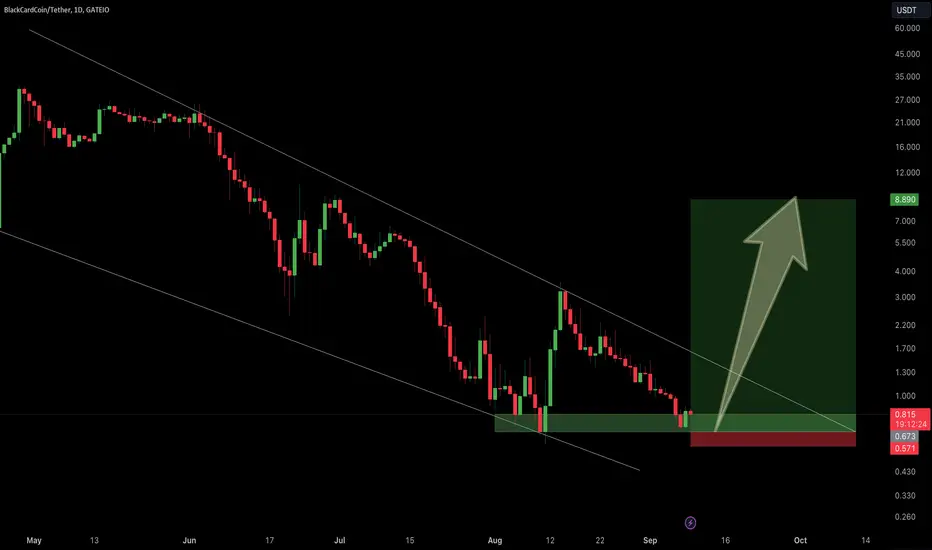
BlackCardCoin/USDT Daily Analysis:Trading near $0.814, testing the lower boundary of a descending channel.
Immediate support is highlighted around $0.673 to $0.571. A bounce from this zone could initiate a bullish move.
The upper boundary of the descending channel acts as resistance. A breakout above this channel is necessary for further upward momentum.
A strong bounce from the support zone could lead to a breakout above the channel, targeting higher levels such as $8.890.
Failure to hold the support zone could result in further downside, breaking below the key support at $0.571, which would invalidate the bullish outlook.
Monitor for a breakout from the descending channel and maintain vigilance around the critical support levels.
Disclaimer: This analysis is for informational purposes only and is not financial advice. Please consider market conditions and adjust your strategy accordingly.
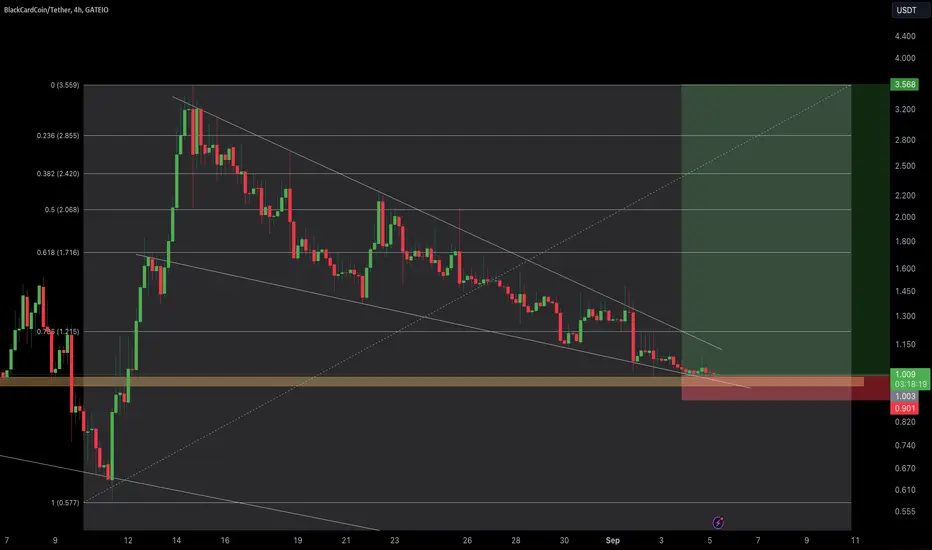
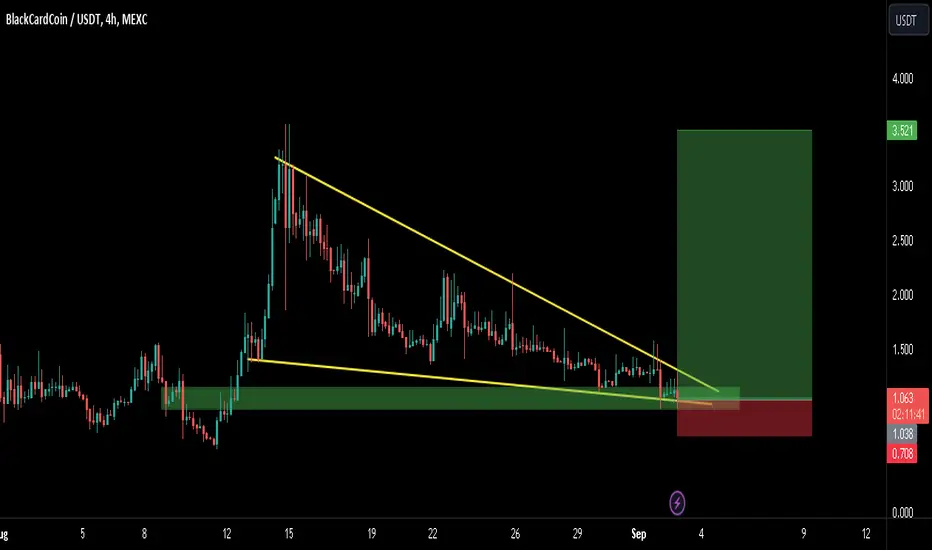
BCCOIN/USDT ANALIYSIS AND LONG TRADE SETUP. The BlackCardCoin (BCC) chart against Tether (USDT) on the 4-hour timeframe indicates a potential short scenario. Here is the analysis based on the chart:
The price is currently in a descending channel, characterized by lower highs and lower lows, indicating a bearish trend. The price has been moving steadily downwards within this channel.
Fibonacci retracement levels are plotted from the recent high around $3.559 to the current levels, with important levels such as 0.236 (around $2.855), 0.382 (around $2.420), 0.5 (around $2.068), 0.618 (around $1.716), and 0.786 (around $1.215).
The price is trading near the 0.786 retracement level, suggesting a significant pullback from the highs.
Support and Resistance Levels:
Immediate support is near $1.003 to $0.901, highlighted by the red zone, which suggests this could be a crucial area for bulls to defend. If the price breaks below this zone, further downside could be expected.
A breakout above the descending trendline and subsequent Fibonacci levels could shift the bias towards a more bullish outlook. Key resistance levels would be at each Fibonacci level on the way up.
Projected Movement:
The chart shows a shaded green area above, indicating a potential long target if the price breaks out of the descending channel and recovers above key Fibonacci levels.
However, the immediate focus remains on whether the price can hold the support zone. A failure to hold could continue the bearish momentum, while a successful defense may result in a bounce.
Overall, the setup suggests a cautious approach with a current bearish bias. The critical area to watch is the support zone between $1.003 and $0.901. A break below this could continue the bearish trend while holding above could lead to potential recovery and a possible trend reversal if the price climbs above descending resistance and Fibonacci levels.
If you enjoy this analysis, a thumbs up and follow would be greatly appreciated!
BCCOIN looks good here. Forming a falling wedge-like structure in a 4-hour time frame and currently trading near the lower trendline of the wedge. Once it breaks out from the wedge, it can easily pump 200-300%.
Buy some now and add more in the dips.
Short Term Target:- $2.5-$3.5
Mid Term Target:- $7-$8
Long Term Target:- $15-$20
What are your thoughts on BCCOIN's current price action? Share your analysis in the comments below!
Note: This is not financial advice. Stay tuned for further updates and analysis. Thank you.
BCCOIN/USDT: READY FOR ANOTHER BIG MOVE!!Hey everyone!
If you enjoy this analysis, a thumbs up and follow would be greatly appreciated!
BCCOIN looks good here. Forming a falling wedge-like structure in a 4-hour time frame and currently trading near the lower trendline of the wedge. Once it breaks out from the wedge, it can easily pump 200-300%.
Buy some now and add more in the dips.
Short Term Target:- $2.5-$3.5
Mid Term Target:- $7-$8
Long Term Target:- $15-$20
What are your thoughts on BCCOIN's current price action? Share your analysis in the comments below!
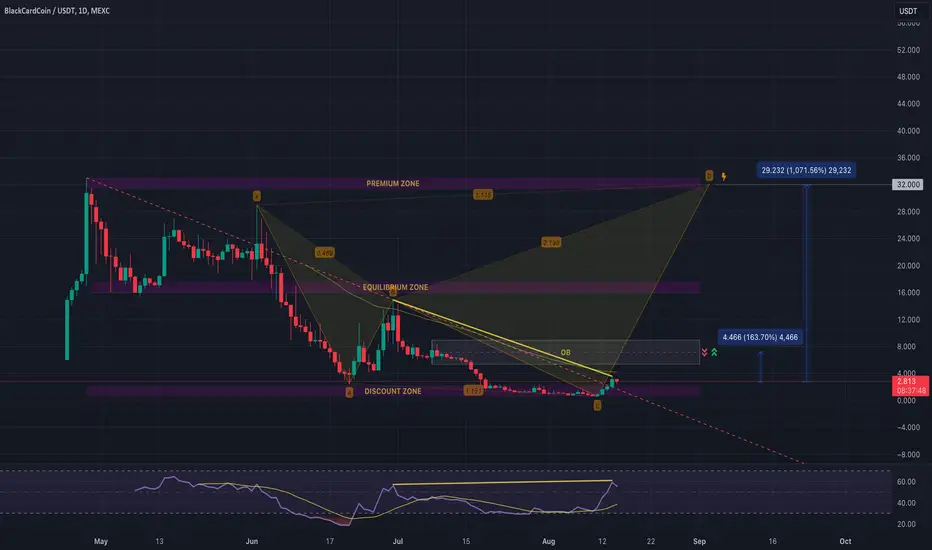
Let's try to interpret that much talked about #Bccoin chart$Bccoin 1D chart;
Let's try to interpret that much talked about #Bccoin chart;
First of all, the first thing that catches our eye is that it managed to break the downtrend line upwards.
However, since it is still below the 50 EMA (yellow line), it would not be correct to talk about a bullish trend. However, we can say that there is no negative situation.
The mismatch on the RSI side has now given an upward signal, it would not be wrong to say that it will move at the first opportunity.
In addition, we can evaluate the Ath level in a harmonic pattern and as a target point. The ratio may seem extreme, but this is crypto.
The first area marked as OB is the first strong resistance level in front of it and there is a ratio of about 160% between it and the current level.