BCHBTC
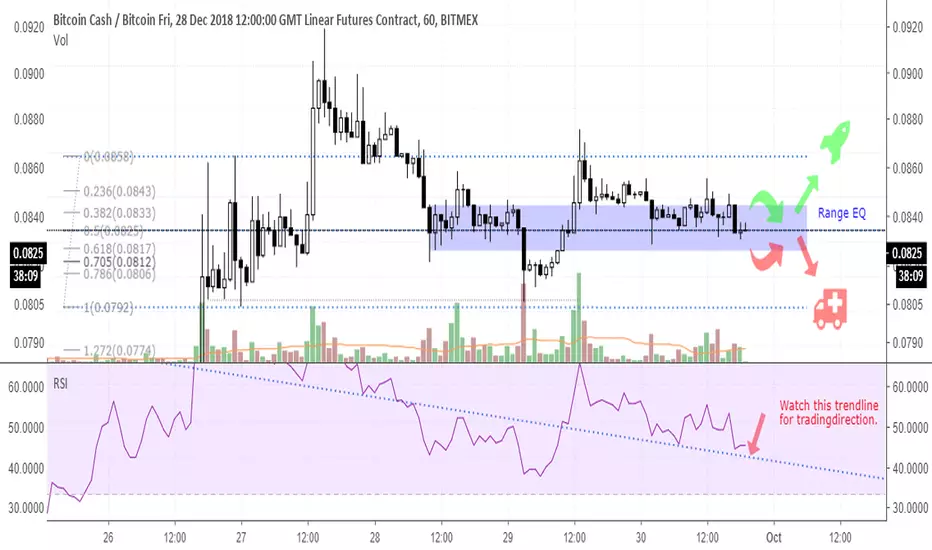
Watching BCH closely here for short- or longsetupIdeally we will see a bounce or brake of the RSI trendline soon on Bitcoin Cash. Short or long on a retest of the line.
In the end the direction of Bitcoin will decide - Personally I am biased bullish: But with this setup it should be possible to let the price action decide ;-)
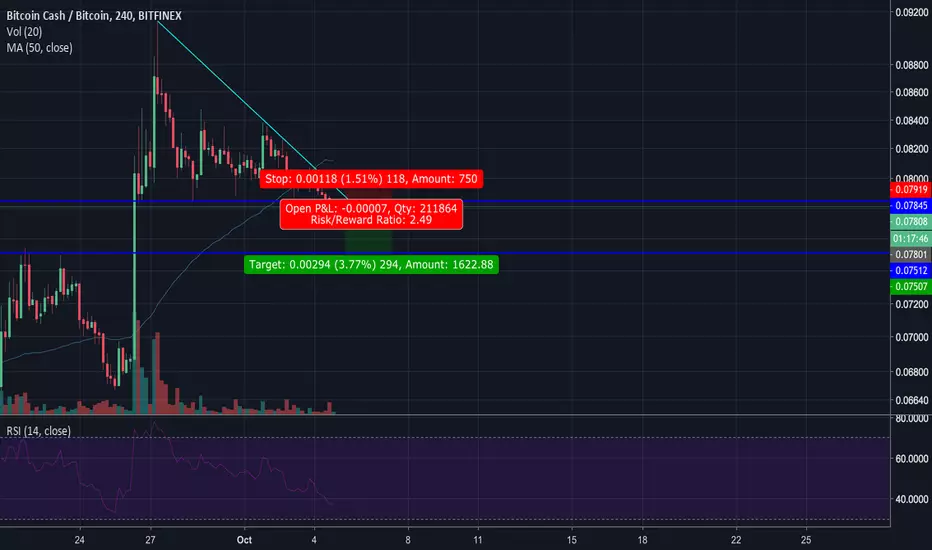
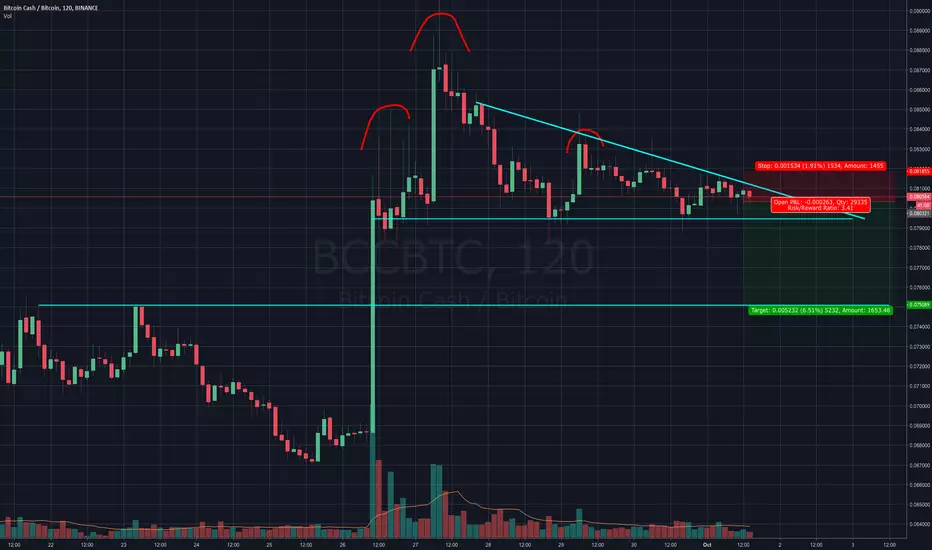
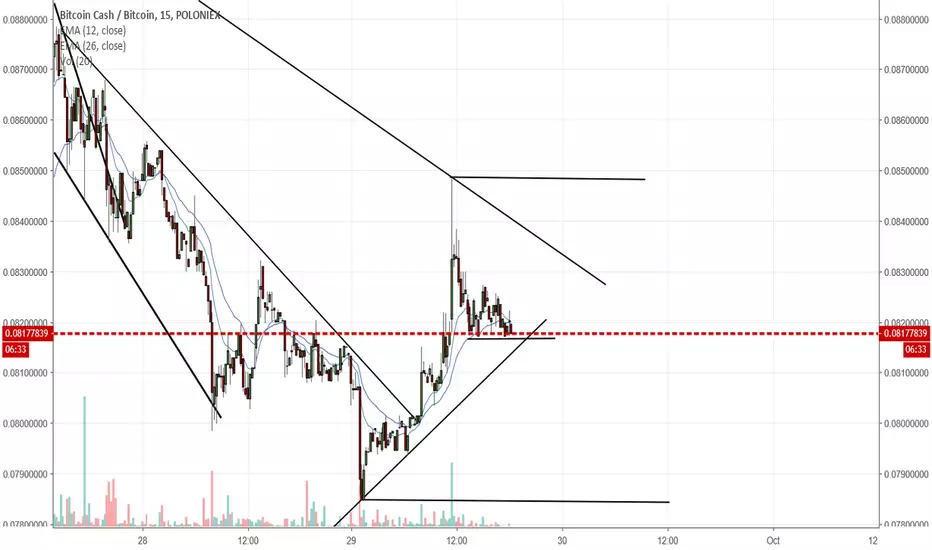
BCHBTC Descending Triangle Breakdown 2.5 R/RBCHBTC has painted a descending triangle with a backtest that has confirmed support turned resistance. There is a pretty safe 2.5 R/R short opportunity if you enter now and place a stop loss slightly above the downward sloping resistance. Entry: 0.7845, Stop Loss: 0.079, Target: 0.075.
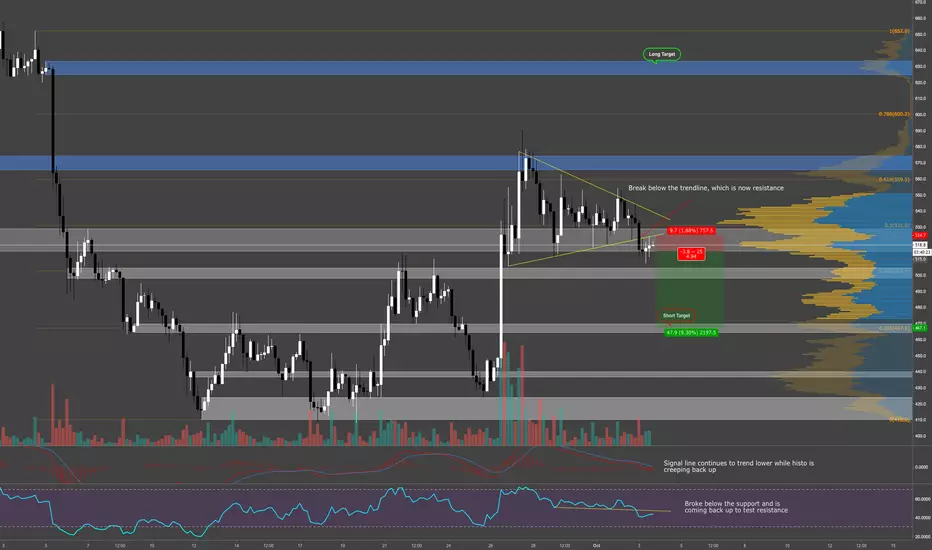
Bitcoin Cash hype dying down! Bitcoin Cash has broken below the trendline and is now finding it as resistance sitting on important support. A breakdown from this level could see us revisit the $500 level quickly with the overall target set near $460 on a Bitcoin collapse back down to $6200.
MACD continues to trend lower while RSI broke below support but is heading back up to restest the breakout, which could end up being the ideal spot where price could head back lower and RSI return to the bottom for the range.
A possible short trade would be to wait for the demand zone to break then take a short position on a retest and fail to break back above the S/R flip zone. Stops would be set above the retest of the trendline SFP and targets are outlined on the chart.
Thanks guys
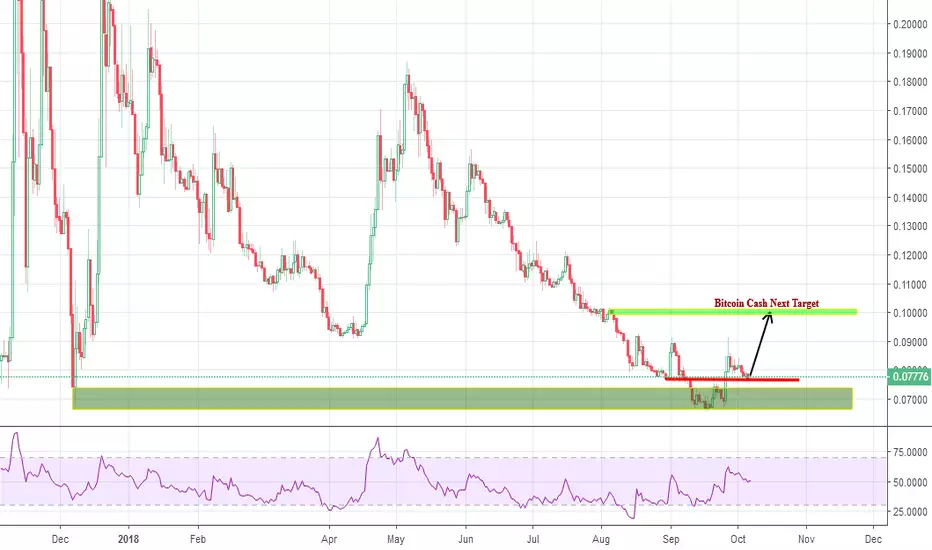
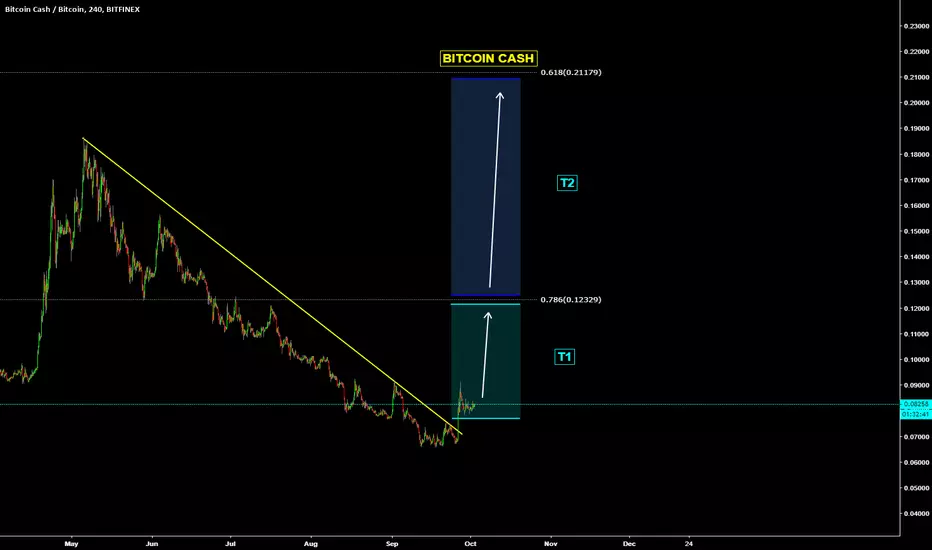
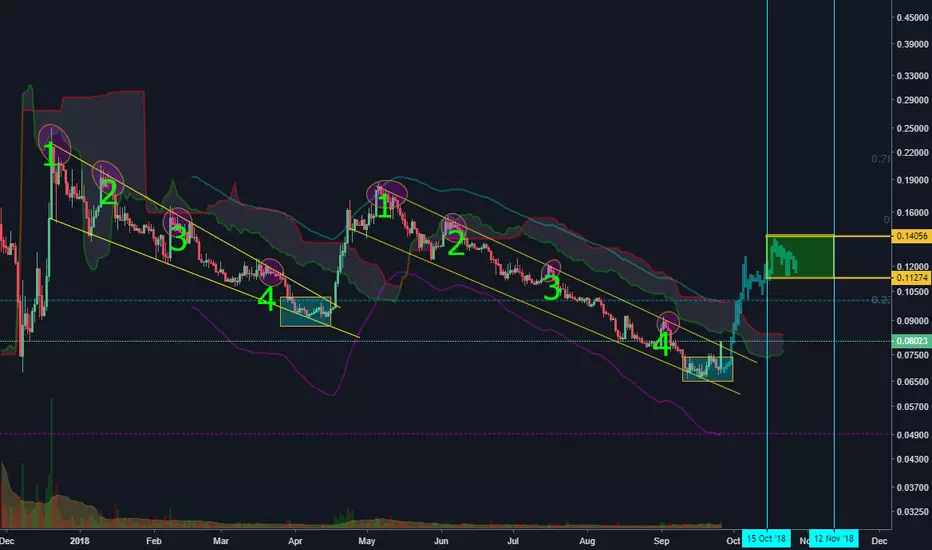
BITCOIN CASH LONG PREDICTION MIN 0.12 BTC MAX 0.20 BTC - REST5RTBCHBTC LONG
1. Breakout of yellow downtrend line
2. Impulsive upmove after breakout
3. Bull flag forming after impulsive upmove
4. Increasing volume
T1: Minimum 0.12 btc
T2: Maximum 0.20 btc

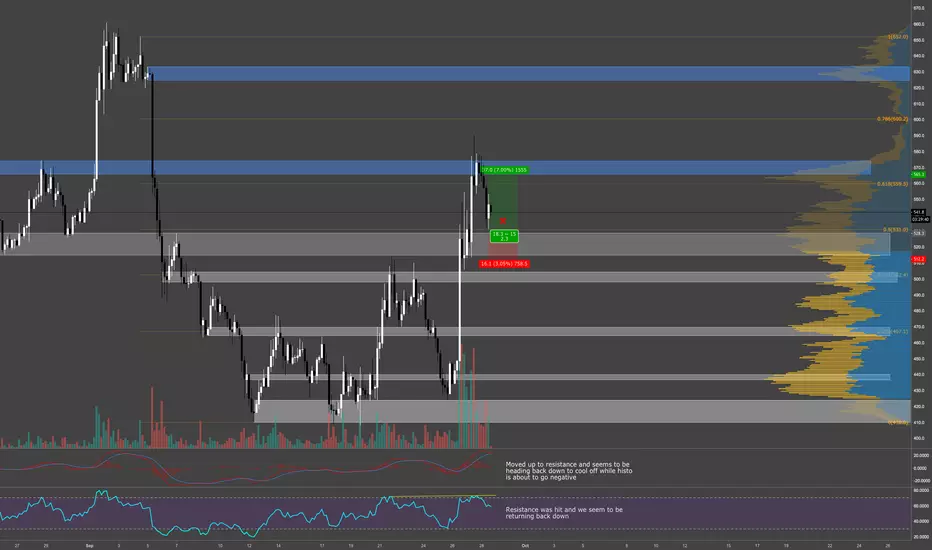
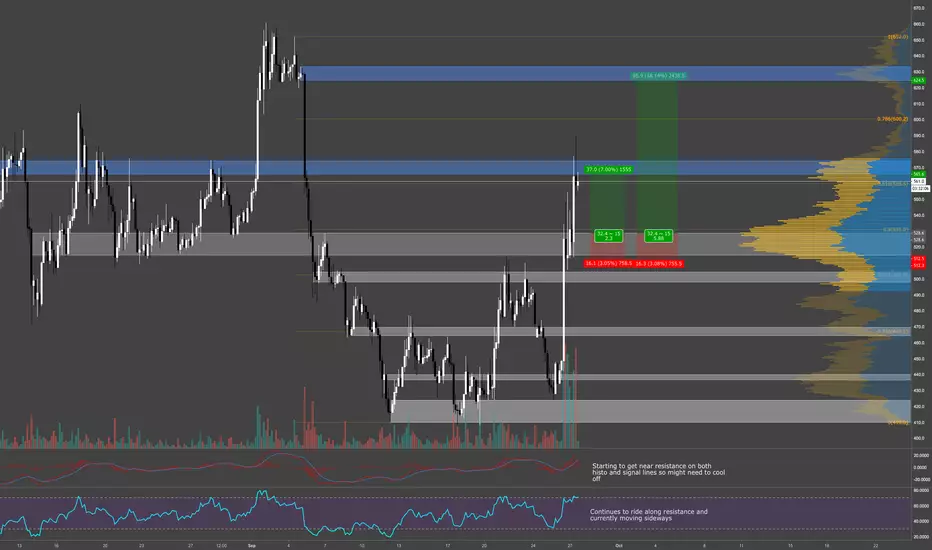
BCH - Could the run be over? Bitcoin Cash has been sitting on top of this very strong support level for over a week now and could potentially still break up higher into the supply zone above but we are seeing some bearish divergence developing. Price is currently just slightly above the 50%FIB level and needs to start moving upwards towards the top of the trendline to continue this uptrend.
MACD is still nose-diving towards the center line while the Histo is hinting at higher lows while RSI has developed bearish divergence with price, which unless we can get a higher low forming within the next few hours with a price move up could spell further downside for BCH. The short and long targets have been outlined and could take a few attempts to achieve them but they are the main support/resistance levels that we can look for if the price does break out on either side.
Bitcoin price will most likely dictate any movements at the moment so keeping a close eye there is very important.
Thanks guys!

Bitcoin Cash : what's next ?!BCHBTC : the downtrend in global, rising in local. Small bullish triangle in 4H. What we can say ? Defined the points of awaiting a clear trend.
BCHBTC: Speculative short ideaBCH doesn't look too strong following it's pump. Im seeing a descending triangle inside of a head and shoulders pattern. However, we have not broken the neckline. Therefore, this is a speculative short position that I am taking. Target is the first resistance turned support.
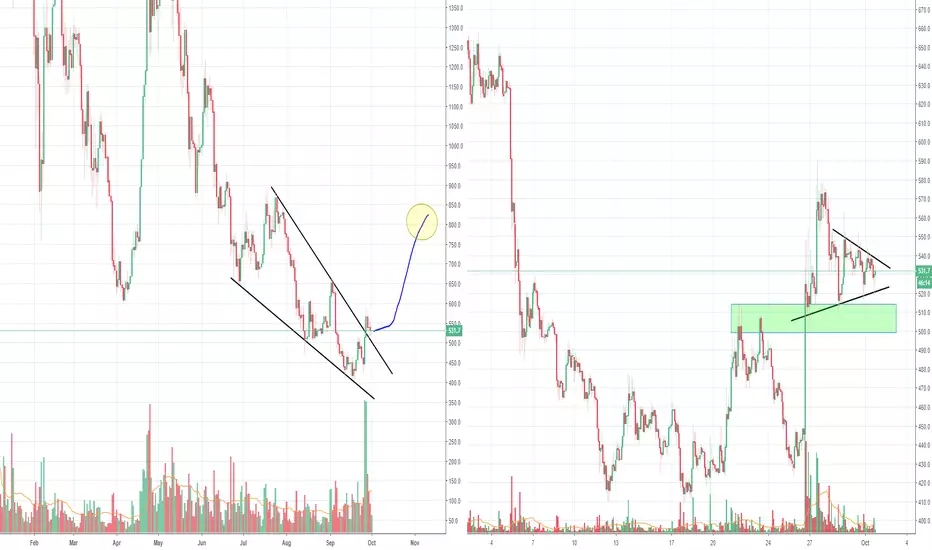
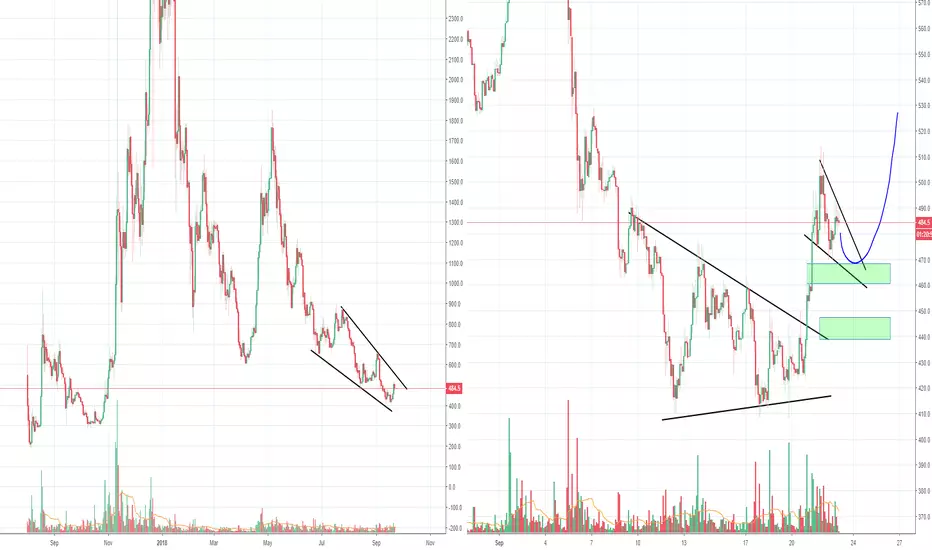
BCH bullish wedge in playAllot of people asked me to update BCH including my own members, so here it goes :)
The big rally we had the past week when we broke the wedge happened with allot of volume. Confirming this move up completely. 100% textbook, just like some other alts have shown as well. If this was not crypto and if there was no Bitcoin, i would be 100% confident on this trade. But we all know, Bitcoin is still inside a very dangerous zone, even though there are some bullish signs, the bearish signs have the upper hand. So for BCH, if this green support holds, we could expect to see a rally the coming months. That would mean Bitcoin has to break upwards from that long term triangle it's still stuck in.
On the right we can see a triangle for BCH, which could still turn into a flag as well, but it's best it stays above that support. The drop of the last few days has only been a pullback of that wedge. So things are still looking text book here.
Previous analysis:
BCH - Support must HOLD! BCH has returned to the S/R flip breakout area to retest and has so bounced right above it on the 50%FIB level. We need to see a dip into this zone hold for any hope of move upside momentum but those odds might be getting slimmer by the hour.
RSI seems to have topped out, hitting resistance and turning over at the moment while MACD hit its top and is about to crossover bearish. This is also confirmed by the histo about to turn negative again, therefore waiting for this next test is crucial. This trade setup was not executed and has been canceled as we wait and see what the next few hours bring.
Thanks guys!
BCH seems to have formed a possible bottom formationBCH is also looking more bullish lately. It has been a very weak one the past 2 months but things might be turning around now. Big chance it's inside a bull flag now, so we could see a small drop first before going up again. The first green should hold as support to keep this flag valid. The second one is important to keep momentum 50/50 in the mid-term.
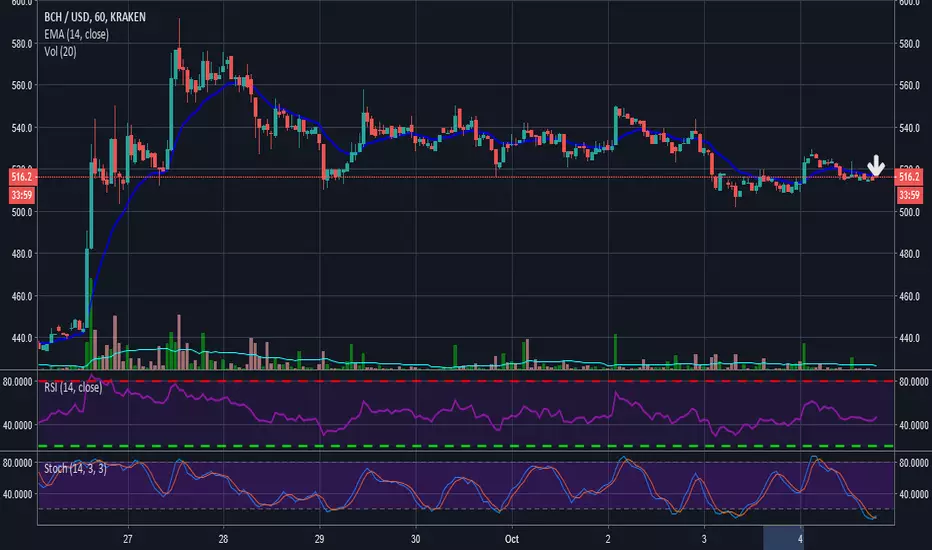
BCH - Time to cool off or do we have another leg up?BCH has been on fire since yesterday and we are currently right up against resistance trying to break above. We have found support around the 61.8%FIB level and are trying to break higher but Bitcoin is having trouble breaking out itself.
RSI seems to be topping off here and moving sideways while MACD is starting to push up into resistance but might have some juice left for another leg up. A safer play would be to wait for a retest of the breakout level around $530 and see it hold to play a long scalp position, however Bitcoin will dictate as always the price action of the entire market so any weakness in BTC should be taken seriously when trading altcoins.
Thanks guys!
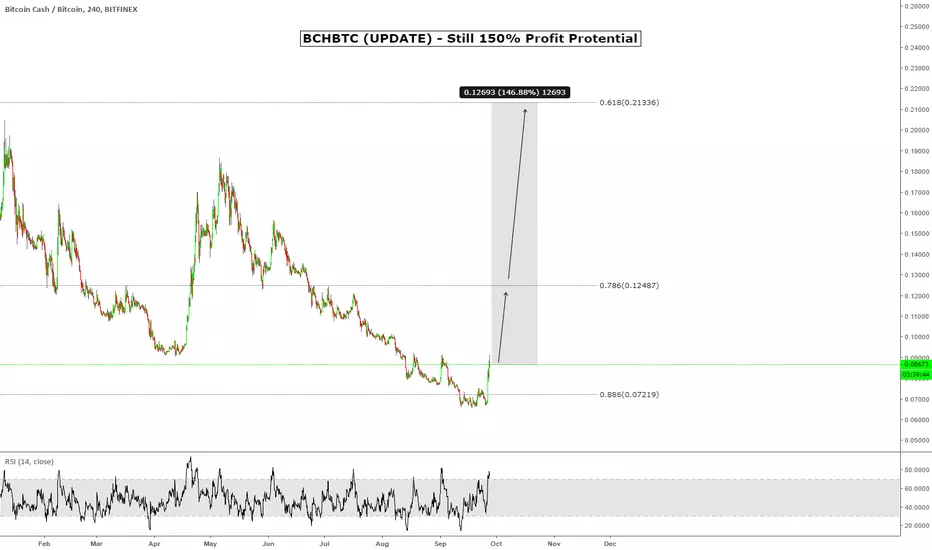
BCHBTC (UPDATE) - Still 150% Profit ProtentialBCHBTC (UPDATE) - Still 150% Profit Protential
Buy siganls:
> Top volume
> Huge breakout
> RSI very fast at oversold area (happens only with a strong momentum)
> Counter trade: People are very bearish (Shorts are increasing rapidly)
Previous idea:
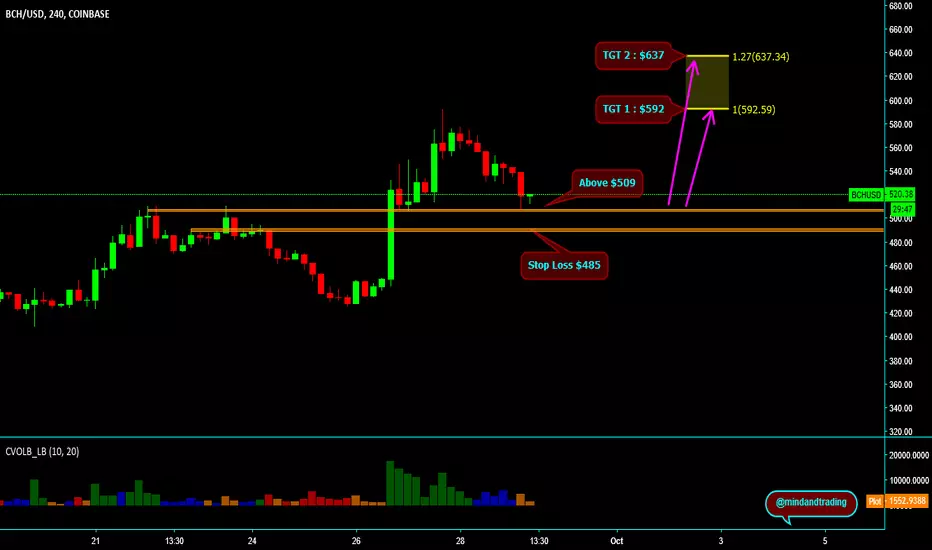
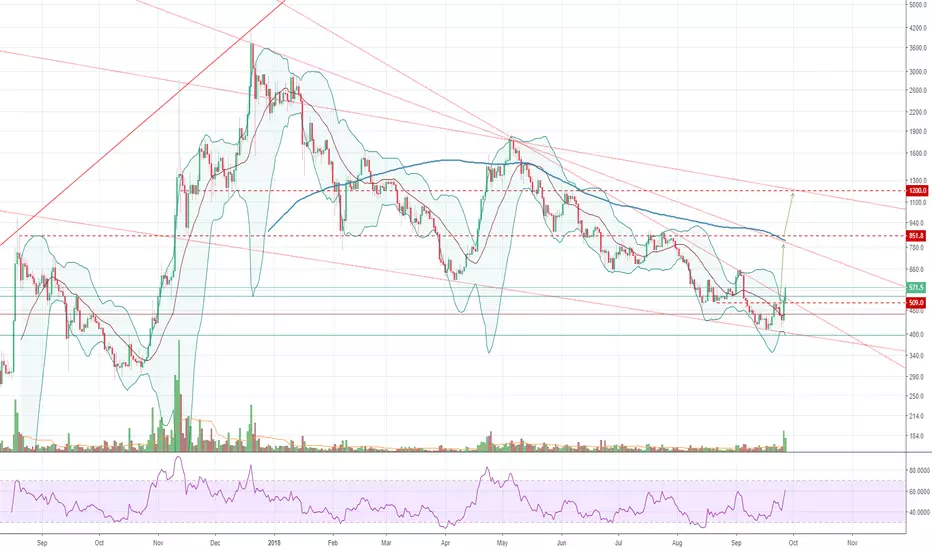
BCHUSD Breakout!Targets are 850 and 1200.
This is my personal opinion and this is not a financial advice!
Good trading!
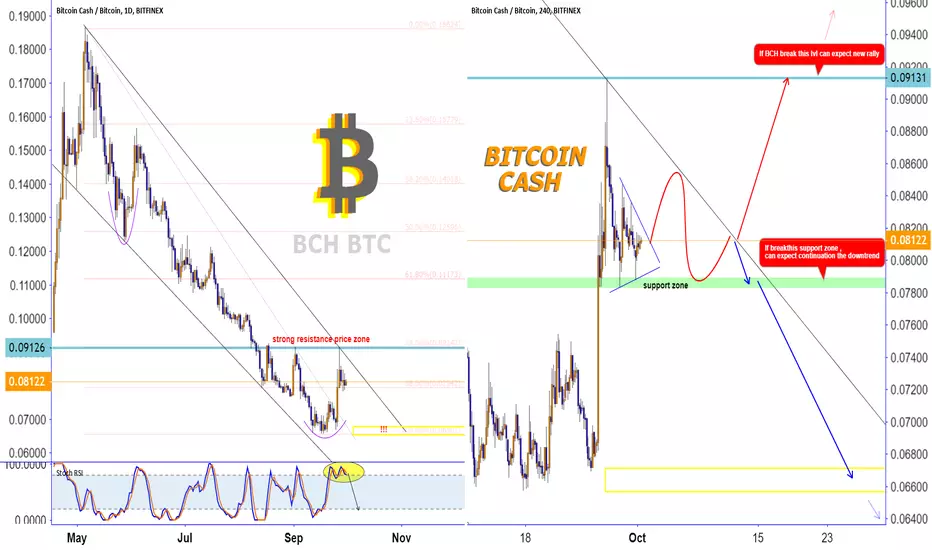
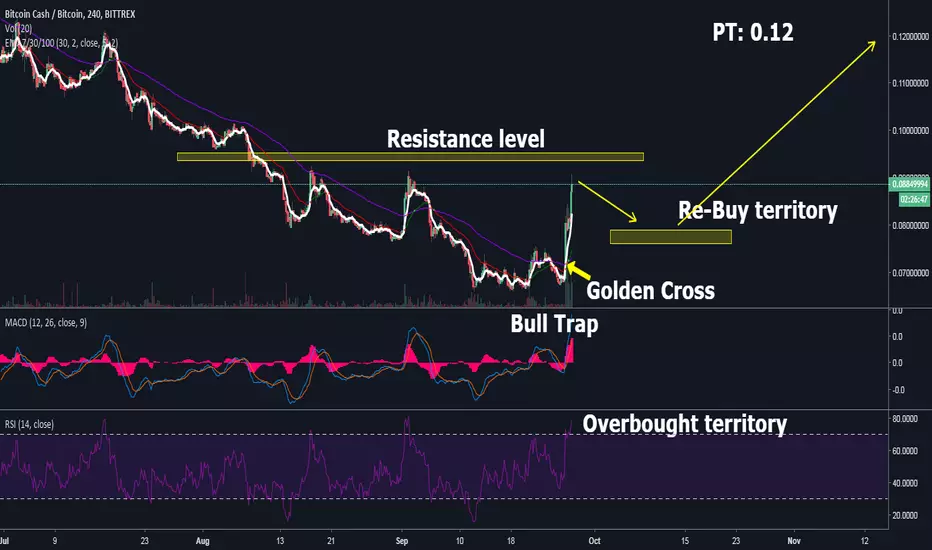
Just, just take your time and keep looking at the screen if you I think the BCH price is so hot right now, so I cannot recommend to open long-term position because if you open the 1-day TF you will see the strong resistance line (100EMA) @0.093. However, I think this action on the card is a good sign to build small position for a long-term period.
The MACD: bull trap
The RSI is at overbought zone.
The EMA lines: you see a very popular phenomenon called "Golden Cross", when it happens the price revers its trend and in this case we are looking at the emergence of the new uptrend with big potential.
TF: 4H
ENTER: 0.076-0.078
PT:0.12 and higher
GL Traders.
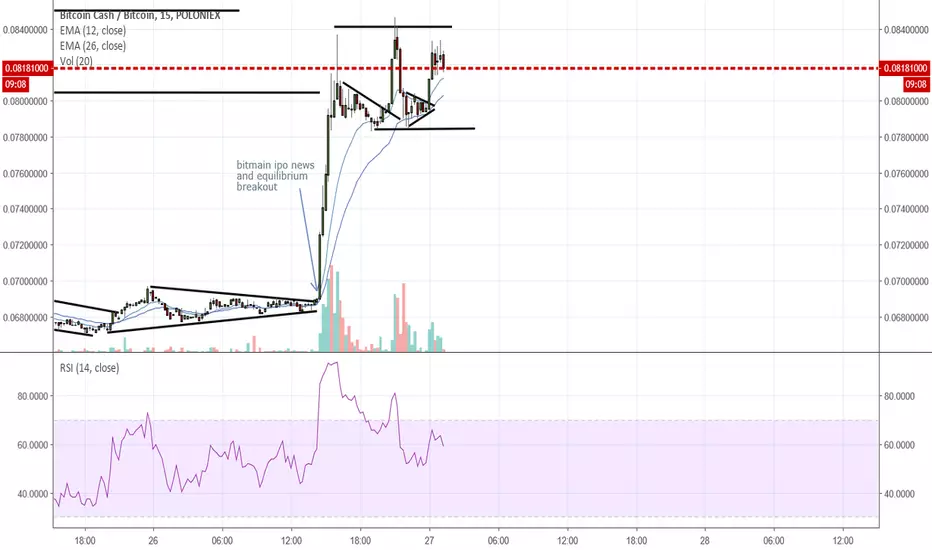
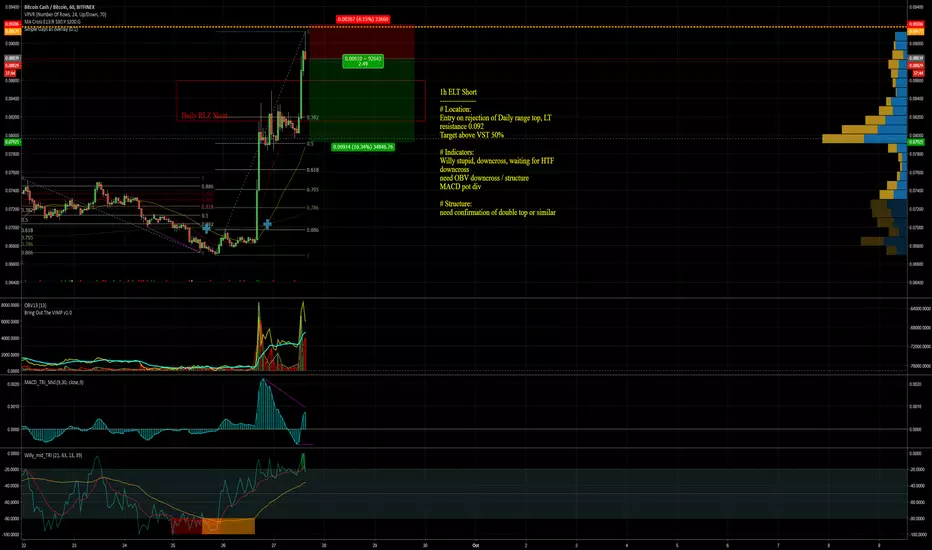
BCHBTC short on 1h time frameBCHBTC went parabolic since yesterday due to the Bitmain IPO.
But it remains a fundamentals trainwreck.
Approaching fast long term resistance at 0.092 and oscillators showing the way to a juicy short.
But some elements are still missing confirmation, will follow-up.
Same pattern repeatsLooks that BCHBTC will follow the same pattern: pump, followed by double top and big dump.
You can sell 20% at the top, add another 20% when double top is formed and the rest of 60% of the position after support is broken.
Good luck.