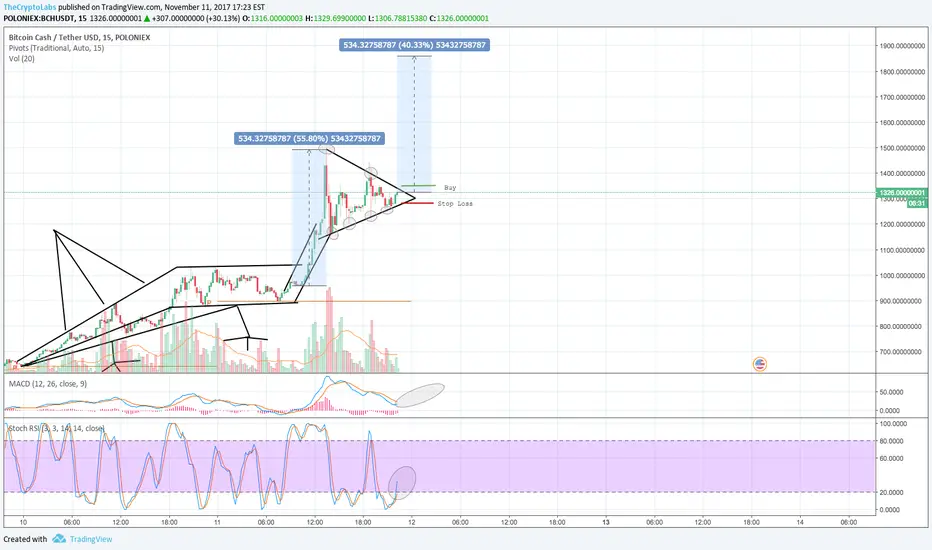
BCH Long Target Target: $2100
Stop-Loss: $1515
Bullish flag, symmetry with the pervious move up. Also Approaching mid-term trend line where it should bounce if it fails to break out of the flag beforehand. I have given 3 options on how it will play out. Target is correlated with the 1.618% fib level established from the previous all time high. Be careful of a break of this mid-term trend line. Good luck and message me with any suggestions on how i can make these charts easier to read for you.
Bchlong

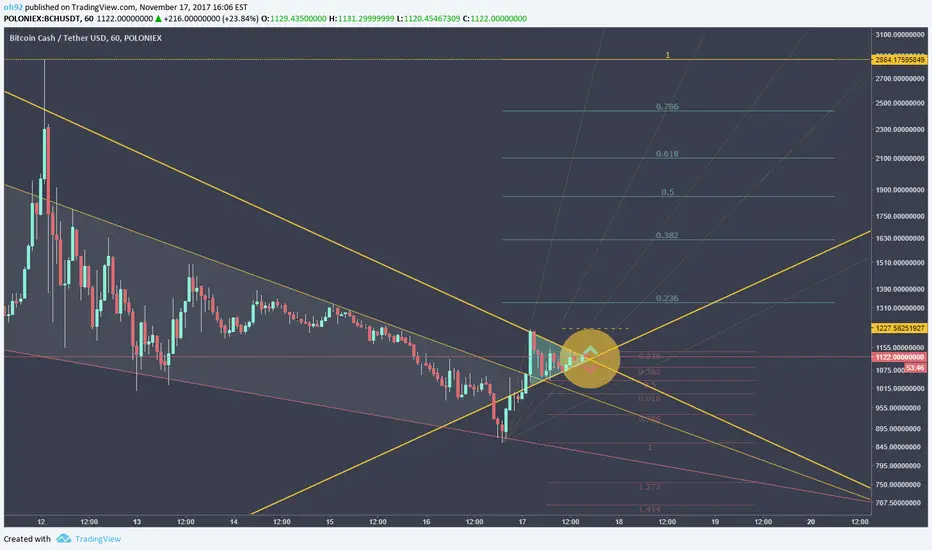
Fool Me Once, Shame On YouFool Me Twice, Shame on Me
Due to the fact that Bitcoin once again failed to break 8k, there is a solid chance that it will start a retracement.
IF BTC does in fact start this retracement, BCH may have a chance for a solid rebuttal!
Judging by the chart, BCH is attempting to cross the downward trendline that was formed from its previous high of $2800.
My plan of action:
IF BCH succeeds in crossing this line, I will place my long for a quick scalp non the less.
If we then form a new higher high above the 1224 price mark, I will likely stay in my position to see how this plays out.
IF BTC continues to rise, and BCH fails to gain momentum, I will stay out of this trade all together.
IF you are able to short BCH, I wish you luck!
Note: trendlines were drawn off 15 minute intervals
DISCLAIMER:
Please note I am only providing my own trading information for your benefit and insight to my trading techniques, you should do your own due diligence and not take this information as a trade signal.
How I've been trading BCHWe all know what's going on with BCH and BTC.
I'm not entirely sure where we stand, so there's not much I can say, unrelated to my chart.
Here is what I notice:
Bollinger bands contract when preparing to break out, this is very common with Bollinger bands.
When price starts going up, buyer volume slowly increases in a near-linear manner.
When sellers come, seller volume slowly decreases, and decrease of volume is increased as gets closer to next bull cycle.
RSI shows oversold on all 3 "correction" bounces, before it started going back up.
You can use that for a signal of potential upward movement.
We've had a few falling wedges and pennants since yesterday, you know what those do.
See how you can use this.


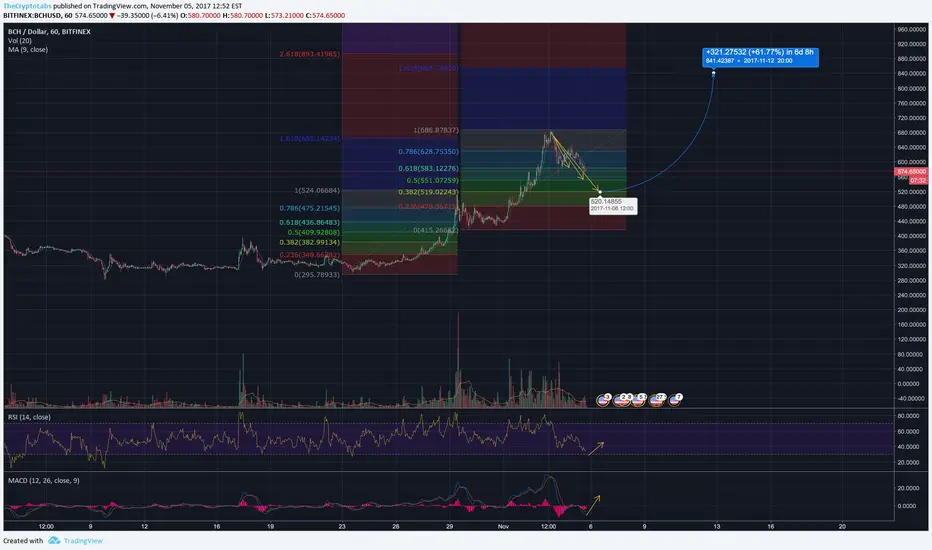
BCHUSDWatch for a replay of events.
Looks like highly likely to bounce off fib retracement levels the arrows point to.
Low Risk: High Reward
Set Stop Losses 5-10% under
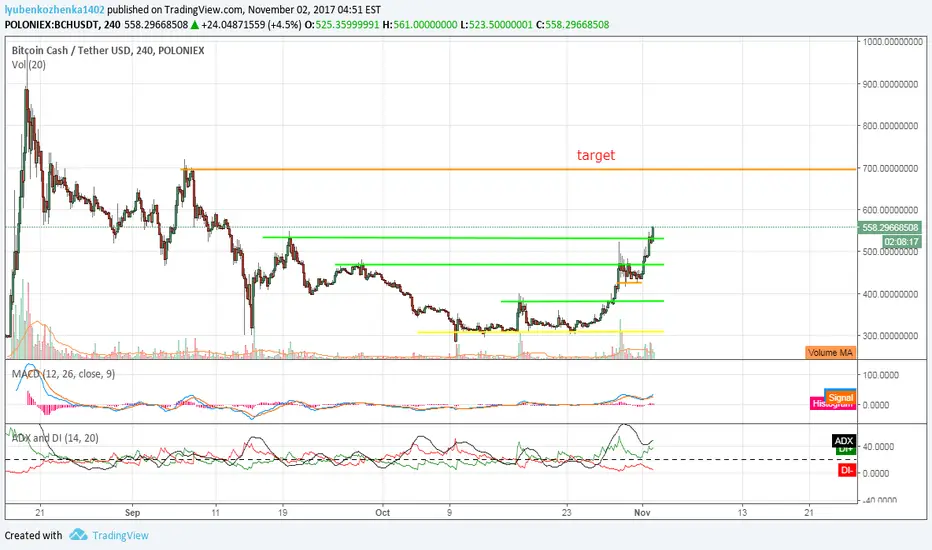
BUY BCHBTH grew by 50% per week. this is maximum ? I think no.
the ADX oscillator talks about the strength of bulls, candles on the chart also talk about bullish growth, this is also indicated by MACD.
You can buy.
Stop LOS - 515
target is 695
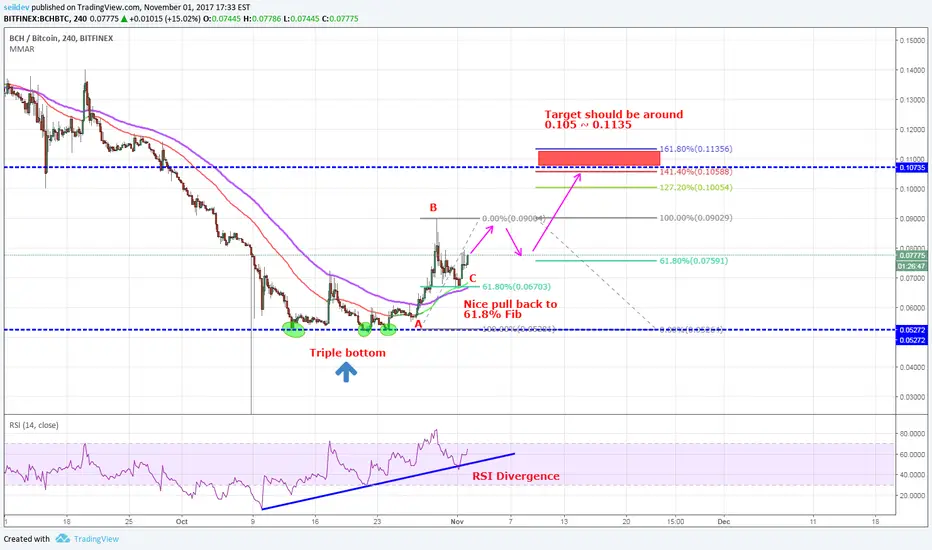
BCHBTC LONGSeildev here
We have a nice pull back for our BCH/Bitcoin on 4 hour chart.
We've had our 3 points of triple bottom 13th,
21st and 24th of October. Then we have seen a impulse leg
to point B and pull back at 61.8% Fib.
With these confirmations, if we can break through 0.09029 again
then we can look for further targets between 0.10588 ~ 0.11356
Plan your trades and safe trading.
Seildev