BCHUSDT : Potential Long Setup – Trendline Support Falling WedgeBCH has been trading in a well-defined ascending channel on the 4H chart. After multiple higher highs and higher lows, price recently corrected to the channel support and formed a falling wedge — a bullish reversal pattern.
Current Price: ~$528
Entry Zone: $520–$540
Stop Loss: Below $495 (clean invalidation below channel support)
Targets:
TP1: $560
TP2: $590
TP3: $605
TP4: $646
TP5: $693
Potential Upside: +32% from entry zone
Analysis:
The falling wedge breakout near channel support confirms buyer interest.
Volume drop during the correction phase supports bullish reversal conditions.
Risk-reward ratio favorable near the channel low.
Trade Plan:
Start building position between $520–$540 using DCA. Keep SL below $495. Expect gradual move toward the upper resistance zones if the breakout sustains.
Watch for breakout confirmation above $540–$550 for momentum entry.
DYOR | Not Financial Advice
Bchpriceprediction

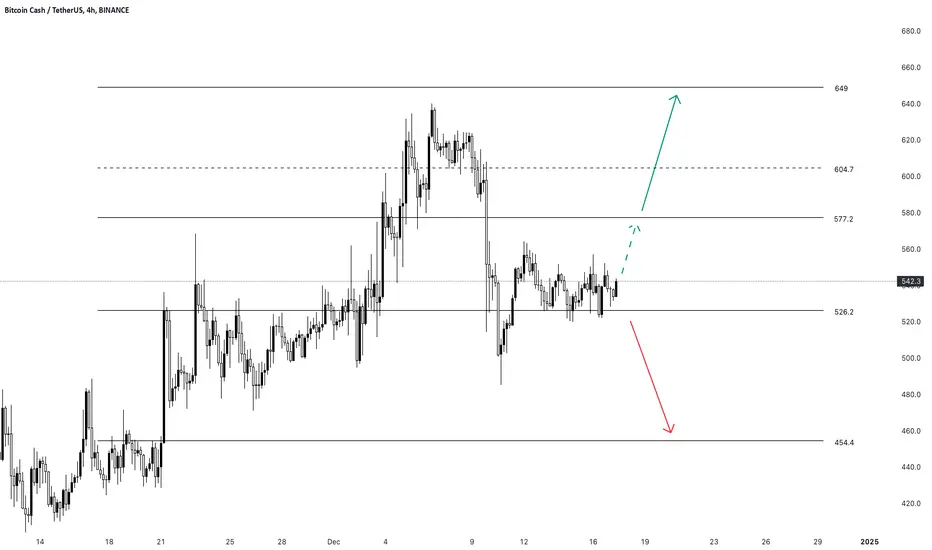
BCH Gearing Up: Ready to Sprint Higher?Bitcoin Cash BCH is pushing from $526 zone.
1. A strong push above $577.2 (Dashed Green Projection) could be the green light for bulls to charge toward the next target at $649. That’s where BCH could really start to shine for those banking on upside momentum (Solid Green Projection).
2. However, if $526 doesn’t hold the line, things might start looking dicey. A drop toward the support at $454.4 could signal a bearish short-term shift, and traders might need to buckle up and be ready to DCA (Red Projection).
In short: $526 is the battlefield and it is good to see BCH is pushing away from it. A breakout or breakdown will set the tone for BCH’s next adventure. Bulls have $649 in their sights, while bears are eyeing $454.4. Who’s got the stronger hand? Stay tuned!
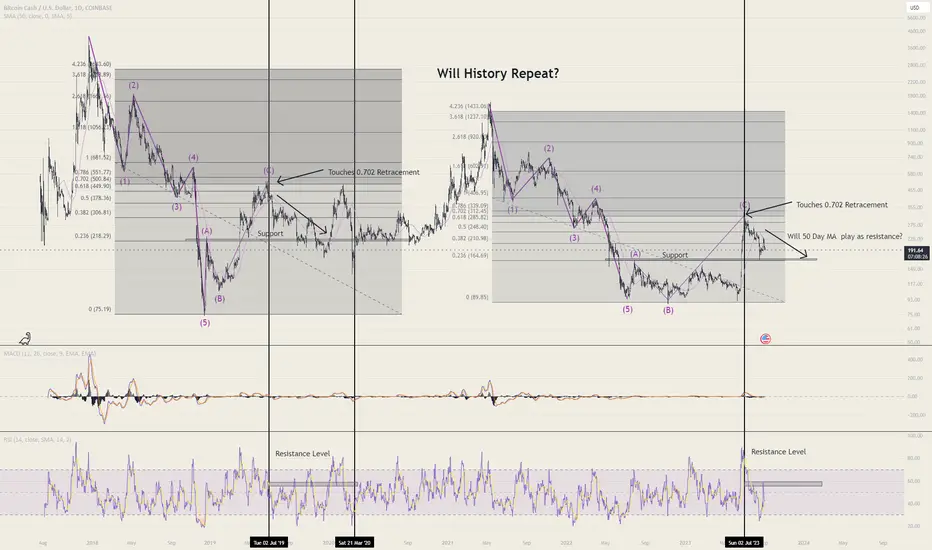
History Repeating Itself? | BCH Predicted to Hit $160Are y'all seeing the same pattern I'm seeing? We are experiencing almost the exact same moments back in 2017!!!
FIB:
-With the 0.236 placed at the top of the first major rally after the final fall, we see this play as an area of support and a correction at the 0.702 Retracement level BOTH in 2017 and now.
- Do you think the 0.236 Level will play as a support? Comment your thoughts down below!
Patterns:
- I used Elliot waves (12345) (ABC) to try to find a pattern and a correlation to the history of BCH. I'll let you be the one to decide if you see the patterns.
- Let me know if you found something better in the comments bellow!
MA:
- We want to see resistance play out for the next few weeks if we want to see this pattern play out correctly, for this will help the price reach lower.
- Do you think were in for another huge fall? Comment below!
RSI:
- RSI will hopefully show resistance levels at the .60 for accouple weeks
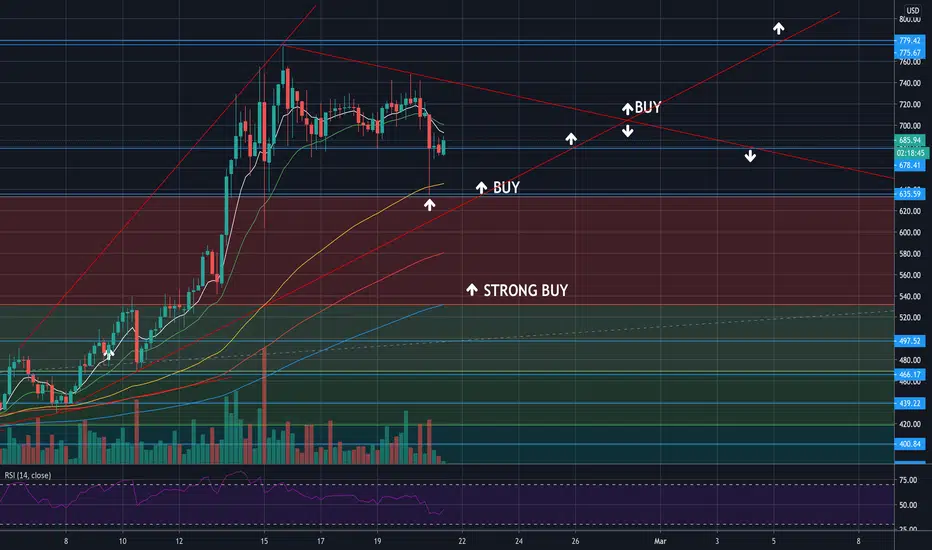
BCH/USD entry levels LONGBitcoin Cash triangle formation forces us to go higher fast. You can enter long at the price of $680 but wait for the breakout.
ENTRY LEVELS LONG
$635
$590
$540 STRONG BUY
$475 STRONG BUY