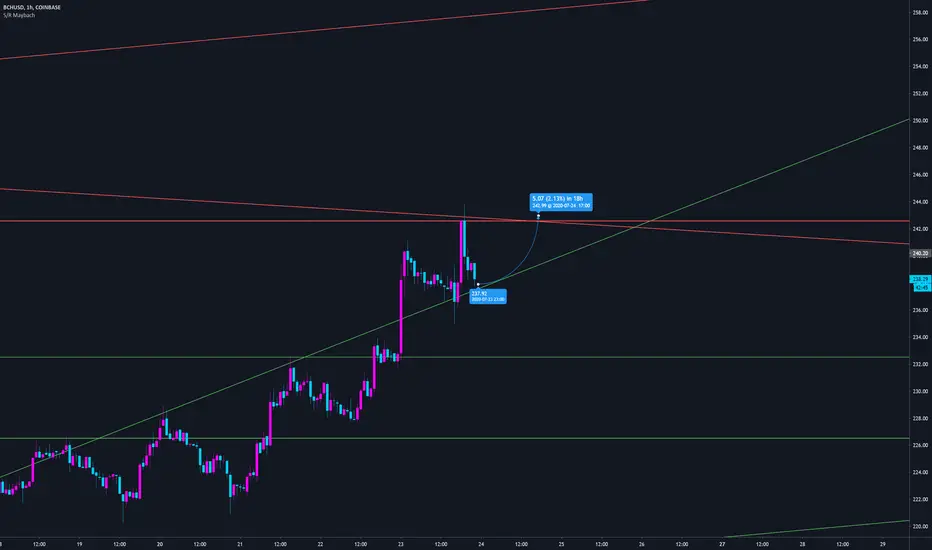
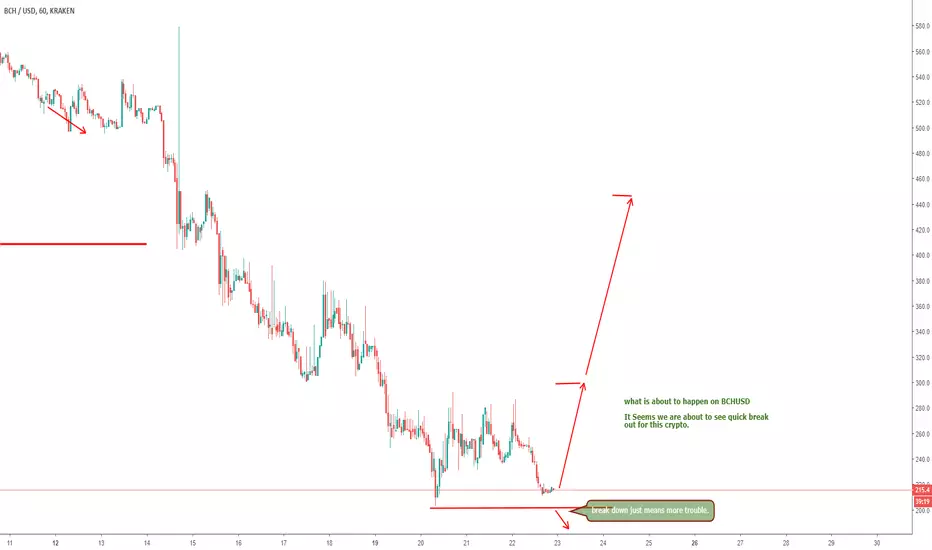
BCH/USD 60min long.
####### BCH/USD Technical Analysis - 240m - July 24 #######
#####################################################
~ Active Trend : BULLISH
~ Background Trend : STRONGLY BULLISH
~ Technical Indicators : 50% Bullish, 11% Bearish, 39% Neutral
~ Weights : RSI and CCI bearish Divergence, $5m market Sell order BTC
~ Targets : 242, 260
--------------------------------------------------------------------------------
Sentimental Analysis
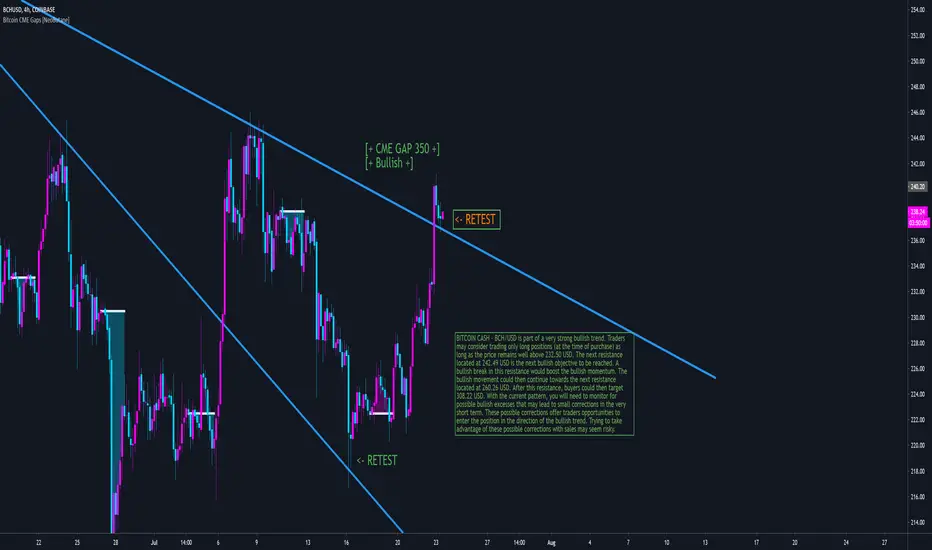
The basic bullish trend is very strong on BITCOIN CASH - BCH/USD but the short term shows some signs of running out of steam. However, a purchase could be considered as long as the price remains above 232.50 USD. Crossing the first resistance at 242.49 USD would be a sign of a potential new surge in the price. Buyers would then use the next resistance located at 260.26 USD as an objective. Crossing it would then enable buyers to target 308.22 USD. Caution, a return to below 232.50 USD would be a sign of a consolidation phase in the short-term basic trend. If this is the case, remember that trading against the trend may be riskier. It would seem more appropriate to wait for a signal indicating reversal of the trend.
Bchusdanalysis
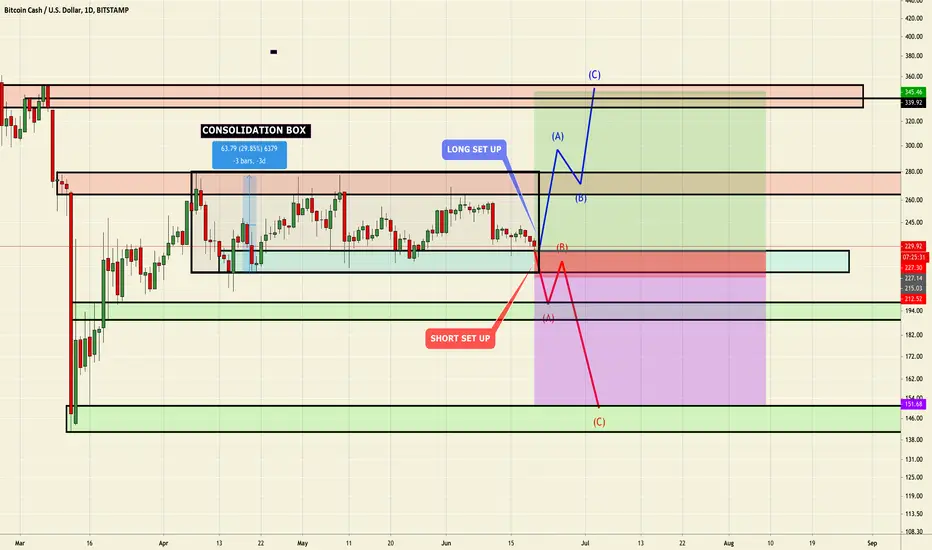
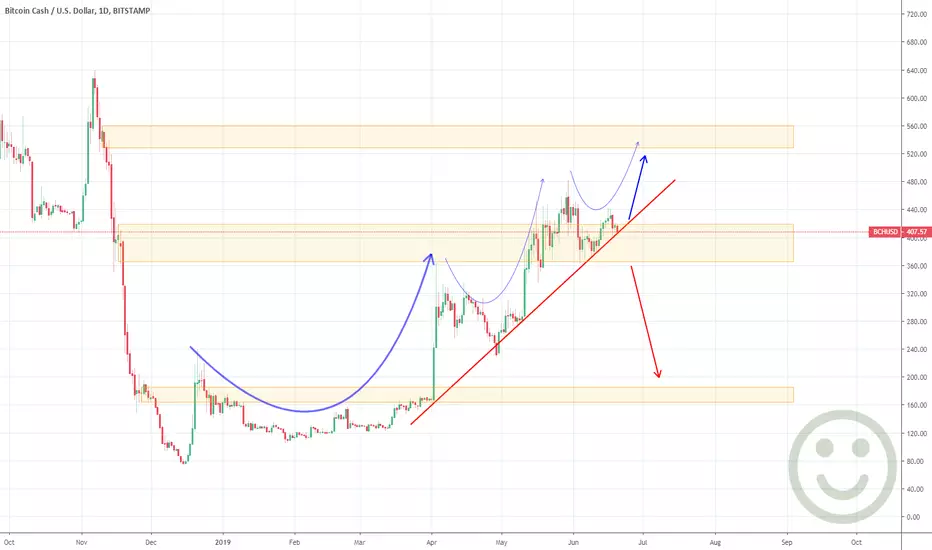
BCH/USD BREAKOUT LONG & SHORT SET UP (HODL)DROP A COMMENT IF YOUR GOING LONG OR SHORT
The analyst has drawn the price target price at $225 level. As per the idea, the cryptocurrency will turn bearish and hit the $225 mark before turning bullish. Should the fall complete, the BCHUSD pair will move to a high near the $260 level.
Title: BCH/USD BUY SIGNAL
Asset : Crypto
Type : Limit Order
Time Frame : H4
Entry 1 $230.80
Entry 2 $206.40
Sl $168
Tp.1 $268.80
Tp.2 $298.80
Tp.3 $336.80
Tp.4 $396.80
Tp.4 $460.80
Tp.5 $540.80
Tp.6 $662.80
Title: BCH/USD BUY SIGNAL
Asset : Crypto
Type : SELL STOP
Time Frame : H4
Entry 1 $206.80
Entry 2 $200.80
Sl $268
Tp.1 $190.80
Tp.2 $186.40
TP.3 $158.80
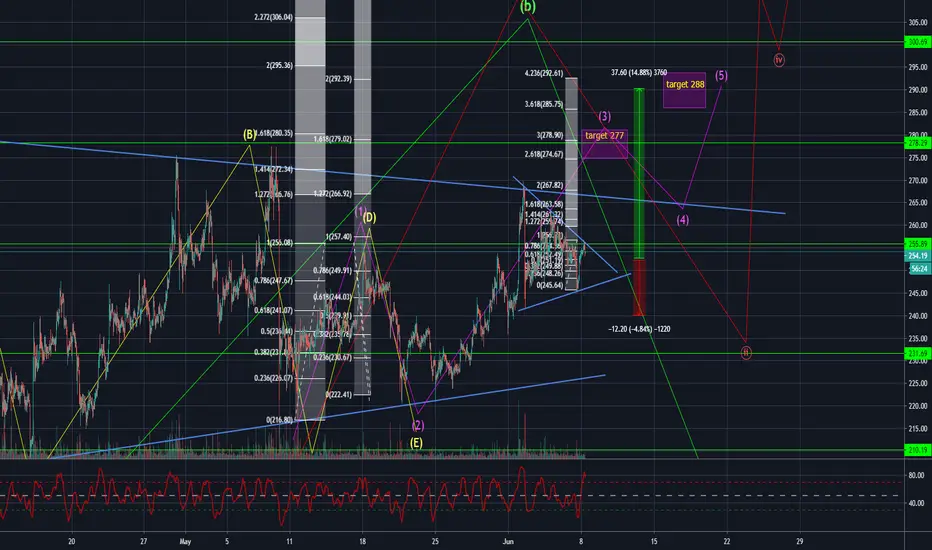
BCHUSDt locally signal (LONG)Hello friends.
Please support my work by clicking the LIKE button(If you liked).Thank you!
Everything on the chart.
open pos: market and put 1 more buy limit on 251.3
targets: 273 and 285-290
after first target reached move ur stop to breakeven
stop: 240 (depending of ur risk). ALWAYS follow ur RM .
risk profit: 1 to 3
Good luck
Follow me on TRADING View, if you don't want to miss my next analysis or signals.
It's not financial advice.
Dont Forget, always make your own research before to trade my ideas! If i help you to earn some money i will RLY VERYVERY appreciate for your donate.
Open to your questions or suggestions(PM to me).
BCH/USD - trade from levels.
I take extreme movement like a double bottom.
Target is $238-$240.
Buying at Fibonnacci level 0.61 and 0.5
This is the area where yesterday's opening price is.
$233 is a mirror level.
You can't break through it the first time.
We'll have to go for good power.
Push ❤️ if you think this is a useful idea!
Before to trade my ideas make your own analysis.
Thanks for your support!

BCH/USD - trade from levels. Last idea came up 100%.
An important level noted the orange line to which you can tie the stop loss.
Long by Fibonnacci levels.
An important level acts as a stop loss anchorage.
Push ❤️ if you think this is a useful idea!
Before to trade my ideas make your own analysis.
Thanks for your support!

Bitcoin Cash Intraday Trade 1:3 Risk/Reward!BCHUSDT Short Trade !
Risk/Reward Ratio : 1:3
Profit Target : 5%
Stop Loss : 1.5%
Do not enter Short if price crosses 248$ !

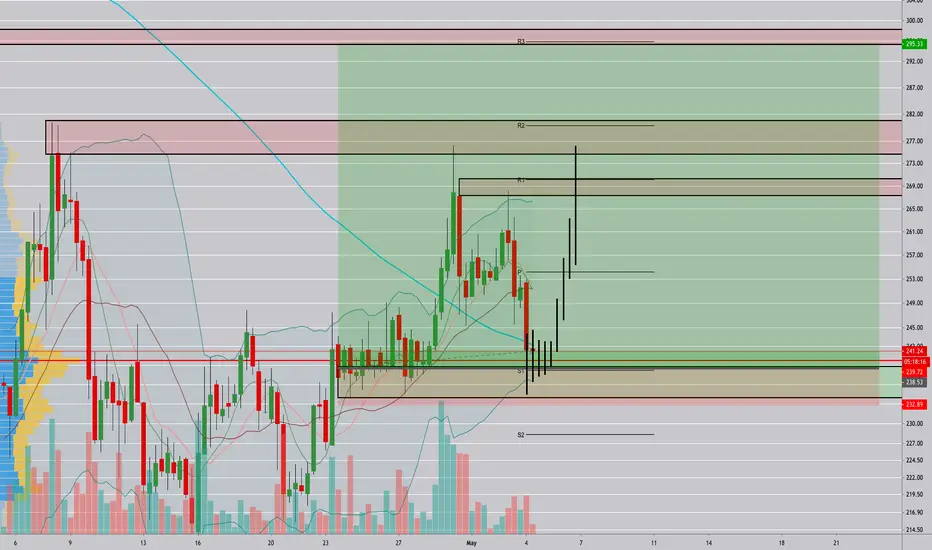
BCHUSDt AnalysisHello friends.
Please support my work by clicking the LIKE button(If you liked).Thank you!
Everything on the chart.
We are in ascendind triangle.
you can enter the market if the current stop loss is satisfactory for you.
or a safer option is to open a position on breaking through 255 with stop loss under a level
Targets: ~275 and ~290$ (after first target will reached move ur stop to breakeven)
cancellation of growth if we rollback and consolidation below 230
Follow me on TRADING View, if you don't want to miss my next analysis or signals.
Good luck.
It's not financial advice.
Dont Forget, always make your own research before to trade my ideas! If i help you to earn some money i will RLY VERYVERY appreciate for your donate.
Also open to your questions or suggestions(PM to me).Will be glad earn some money for me and you.

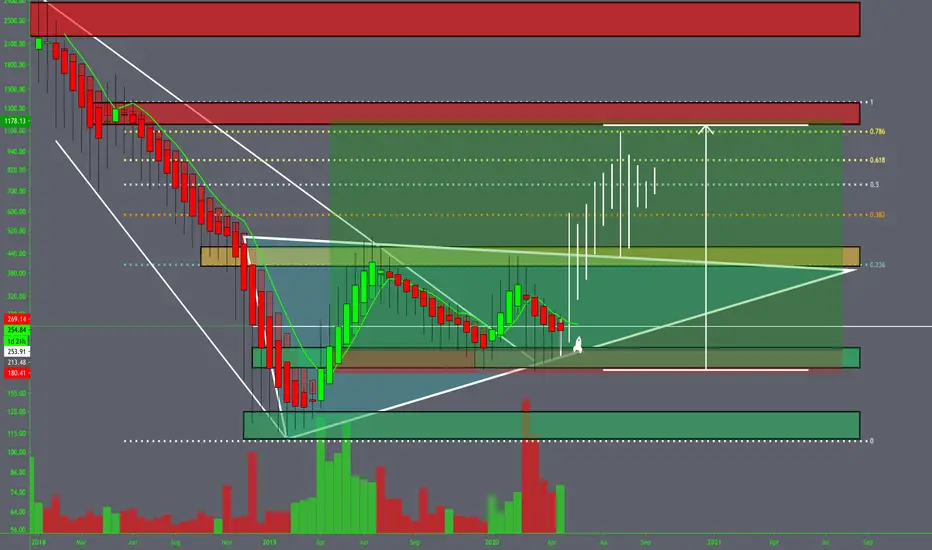
BCH/USD LONG SET UP $400Key Highlights
• BCH/USD continues to see a series of lower highs in its market valuation.
• There is a likelihood that a notable move will soon experience past an upper range line at $280.
• A break of either of the two range points at $280 or $240 will signal a definite price direction in BCH/USD market operations.
Bitcoin Cash (BCH) Price Analysis
• Major distribution territories: $320, $360, $400
• Major accumulation territories: $200, $160, $120
There has continued to be a series of lower highs in the market valuation of BCH/USD. The base-crypto has relatively risen northbound, to hit a strong distribution territory at $280 as it had earlier done on April 8. Price now hovers around $280 and $240 price values. Price now hovers around $280 and $240 price values.
The bulls’ pressures are now seemingly gathering momentum on a weak mote. And, for the second time that the $280 mark touched, there is a likelihood that a notable move will soon experience past the price line earlier mentioned.
IF YOU MISSED SIGNAL AND WANT TO GET IN! USE THIS SET UP
BUY LIMIT BCH/USD
ENTRY 1 $245.50
ENTRY 2 $238.50
SL $230
TAKE PROFIT 1 $270.50
TP.2 $306
TP.3 $336
TP.4 $360
BCH/USD LONG SET UP FOR (BULL RUN BREAKOUT)Key Highlights
• BCH/USD continues to see a series of lower highs in its market valuation.
• There is a likelihood that a notable move will soon experience past an upper range line at $280.
• A break of either of the two range points at $280 or $240 will signal a definite price direction in BCH/USD market operations.
Bitcoin Cash (BCH) Price Analysis
• Major distribution territories: $320, $360, $400
• Major accumulation territories: $200, $160, $120
There has continued to be a series of lower highs in the market valuation of BCH/USD. The base-crypto has relatively risen northbound, to hit a strong distribution territory at $280 as it had earlier done on April 8. Price now hovers around $280 and $240 price values. Price now hovers around $280 and $240 price values.
The bulls’ pressures are now seemingly gathering momentum on a weak mote. And, for the second time that the $280 mark touched, there is a likelihood that a notable move will soon experience past the price line earlier mentioned.
IF YOU MISSED SIGNAL AND WANT TO GET IN! USE THIS SET UP
BUY LIMIT BCH/USD
ENTRY 1 $245.50
ENTRY 2 $238.50
SL $230
TAKE PROFIT 1 $270.50
TP.2 $306
TP.3 $336
TP.4 $360
Tp.5 $420
Tp.6 $500
BCH Bears are taking control - next support at $189-$180Looks like bears are taking control. For long term trade next good entry would be around $189-$180. i think as soon as market recovers it would easily touch $320-$340 nearly double. please note these are my own notes for my future refernce and by no means any tradnign advise for anyone to follow. please do your own research before entrying into any trade. if you like my idea please like and comments.

Bitcoin Cash Analysis: Daily Timeframe Bearish BiasConclusion for today's Bitcoin cash analysis: Lack of a price close above ~324 that is followed by a break below 247 is bearish for Bitcoin Cash.
A log scale of BitcoinCash is presented using Japanese candlesticks on the Daily timeframe. The major bullish trend in the cryptocurrency that lasted over 8 months is highlighed on the chart. A break below the bullish trenline is bearish.
The slope of the 200 Day moving average of BitcoinCash changing from a rising to zero slope also supports the notion that prices are perhaps going to resume further movement to the downside. The 200 day moving average currently coincides with the 324 price level and suggests that the the latest bullish price swing from October 23, 2019 might run into resistance at the aforementioned price level.
382 to 356.88 also present an immediate resistance zone above the 200 Day moving average so that any price movement above the moving average can be expected to stall in the resistance zone, even if temporarily. A break above the upper boundary of resistance at 382 improves the chances of having bullish momentum sustained.
On the other hand, lack of a break above the 200 Day moving average that is followed by price closing below 247 is bearish for BitcoinCash.

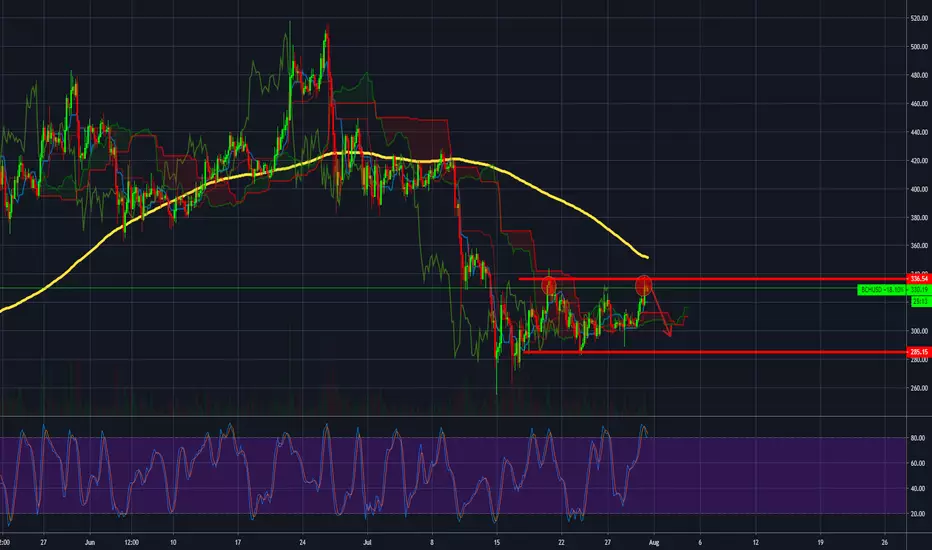
#BCHUSD#Bitcoin Cash, Short signal with low riskTechnical Analysis, H4 Time.
The BCHUSD is stuck in the $ 285 to $ 336 range, only serious news can move it away.
You can see that a double top template is created here.
It is best to sell close to the resistance especially the above case there is a lot of uncertainty.
Target: $ 290
FREE ANALYSIS ON BCHUSD - >>FREE ANALYSIS ON BCHUSD
Welcome to SiriusTrading (managed by Segunby), Check out my Free analysis on Forex and Crypto. Follow me for regular Analysis and don't forget to LIKE, LIKE, LIIIKKKEEE :)
-
15 Min
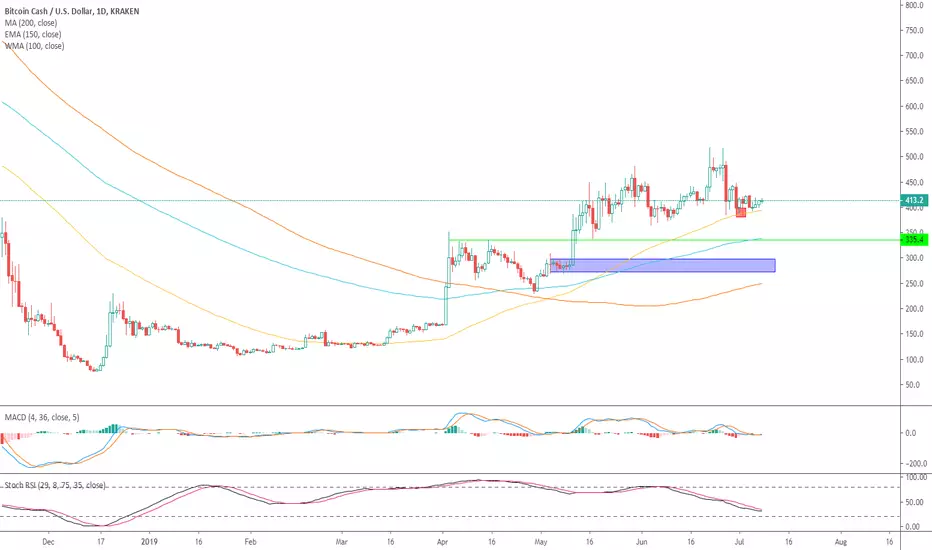
we can see a small bearish momentum forming. Currently MACD is showing bearish divergence and same on the Stoch RSI.
1 HOUR
Price broken out of the 3 MA's on the chart. Buyer interests also increasing with STOCH RSi turning up. My MA 100 and MA 200 also about to cross over so we might see some bearish move before we see the move up continue. Also a triangle is forming indicating a breakout soon.
4 HOUR
Bearish. Price below the MA's and in fact tested the MA 100 and was rejected. All MA's have converged, we should see start of another break out.
1 Day
Bullish. We are see a correction of the previous bull move up. Price tested the 100 MA. Hidden divergence found on MACD and Stoch RSI. expecting move move up.
OVERALL
bullish Outlook for BCHUSD
-
Thanks for reading
See previous analysis
Please share your thoughts and views on my analysis and don't forget to like it and share with others.
#forextrading #forextrader #forexlearning #forex #stocktrading #investor #wallstreet #motivation #investment #bitcoin #investing #cryptocurrency #stocks #passiveincome #daytrading #stockmarket #crypto #forexprofit #pips #currency #financialfreedom #workfromhome #success #money #entrepreneur #stay #achieve #wealth #luxury
BCHUSD Roger Ver Hi! BCHUSD
Deal for 1 month for ( 60%)
Bitstamp buy $1,589,677.46 sell $1,880,636.97
If you trade with leverage, determine the entry point or watch me, I will update if the situation changes.
I keep my hand on the pulse, put a pending order at a price of 277
KEEEP AN EYE OUT ON BCHUSD - WE MIGHT SEE THIS PUSH UP SOONbchusd has slowly but surely become steady. i can see this gearing up for a move up soon so, be ready
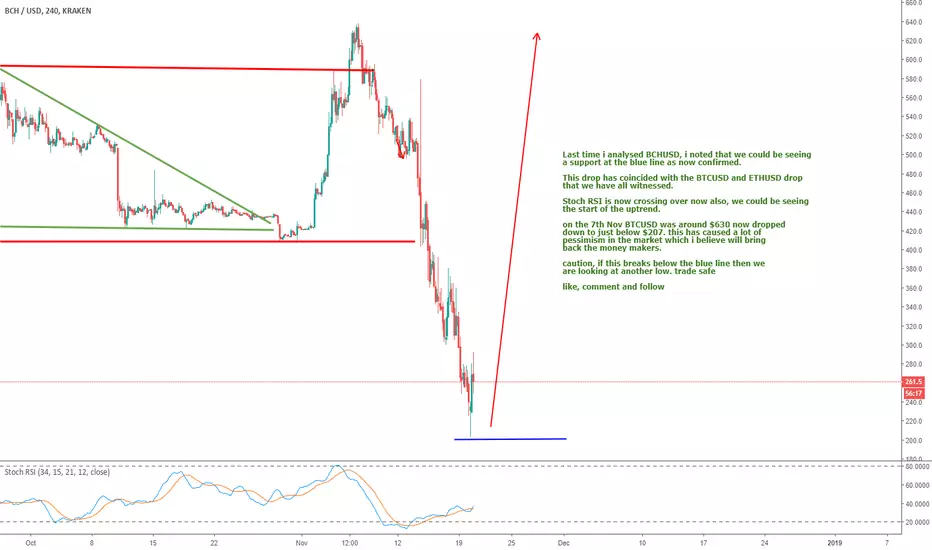
BCHUSD UPDATE - WHAT NEXT? ANY THOUGHTS?Last time i analysed BCHUSD, i noted that we could be seeing
a support at the blue line as now confirmed.
This drop has coincided with the BTCUSD and ETHUSD drop
that we have all witnessed.
Stoch RSI is now crossing over now also, we could be seeing
the start of the uptrend.
on the 7th Nov BTCUSD was around $630 now dropped
down to just below $207. this has caused a lot of
pessimism in the market which i believe will bring
back the money makers.
caution, if this breaks below the blue line then we
are looking at another low. trade safe
like, comment and follow
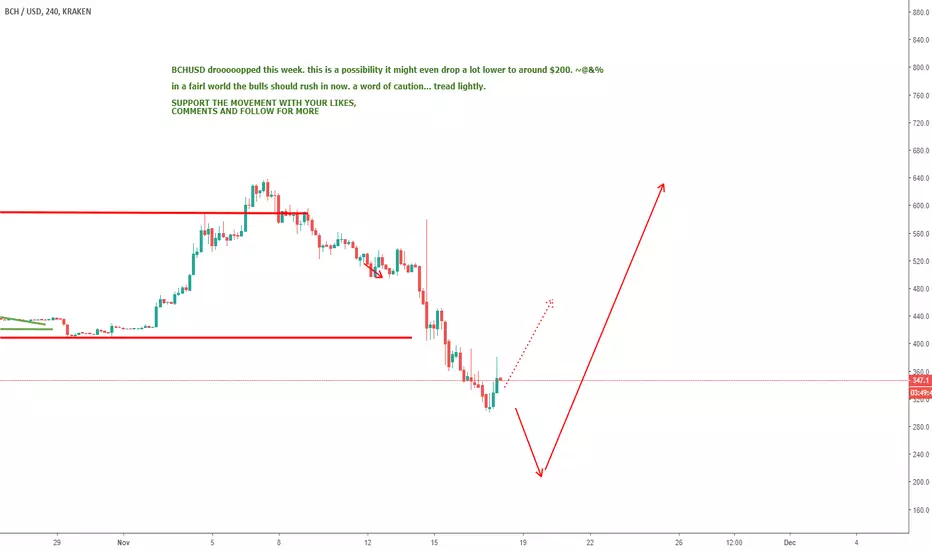
BCHUSD - UPDATE - TREAD LIGHTLYBCHUSD drooooopped this week. this is a possibility it might even drop a lot lower to around $200. ~@&%
in a fairl world the bulls should rush in now. a word of caution... tread lightly.
SUPPORT THE MOVEMENT WITH YOUR LIKES,
COMMENTS AND FOLLOW FOR MORE
BCH - MAKE $$$ SHORTING BITCOIN CASH PRIOR TO HARD FORK ON NOV15Analyzing the $BCH chart we can see a high probability of a down trend and hopeful retracement down the fibonacci level and moving averages.
My personal trade is as follows:
--open short position on 5x leverage at the .0750 level
--take profts at P1, P2
--close trade at the golden ratio .619 which also coincides with the 50 day moving average.
Gredy trade:
-- wait for a spike back to the .0766 level
--take profts at P1, P2, P3
-- close your trades at the P4, P5 ranges which is also the 100 and 200 day moving averages.
Could even monitor how the fork date goes and if a heavy drop coincides that may even be able to reach the .382 fib level.

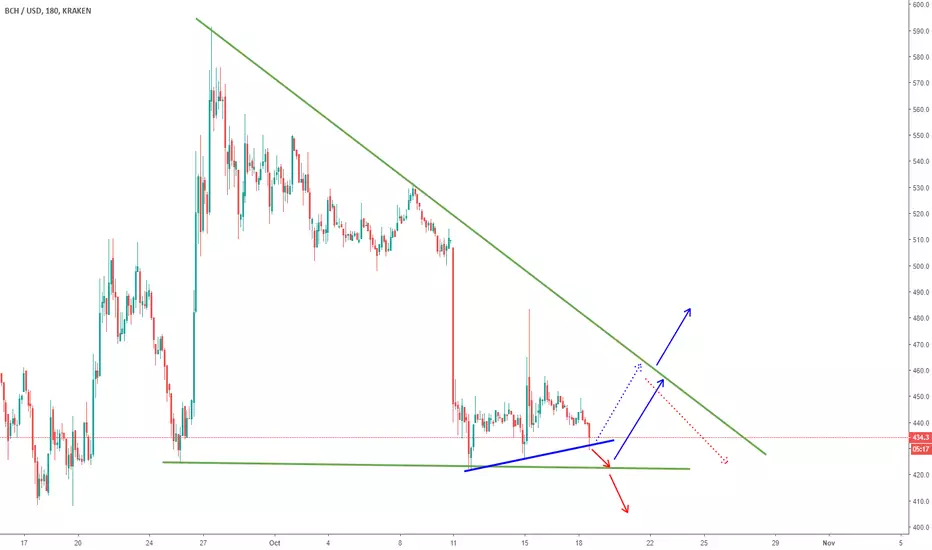
BCHUSD - POSSIBLE UPTRENDi am expecting a longer term uptrend for this crypto
like, follow and comment
