#BCH Update #3 – July 31, 2025#BCH Update #3 – July 31, 2025
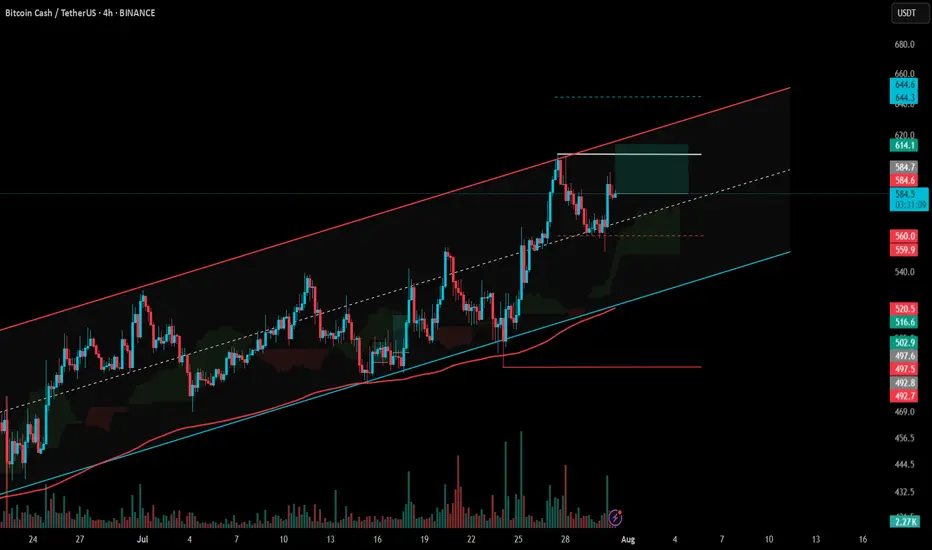
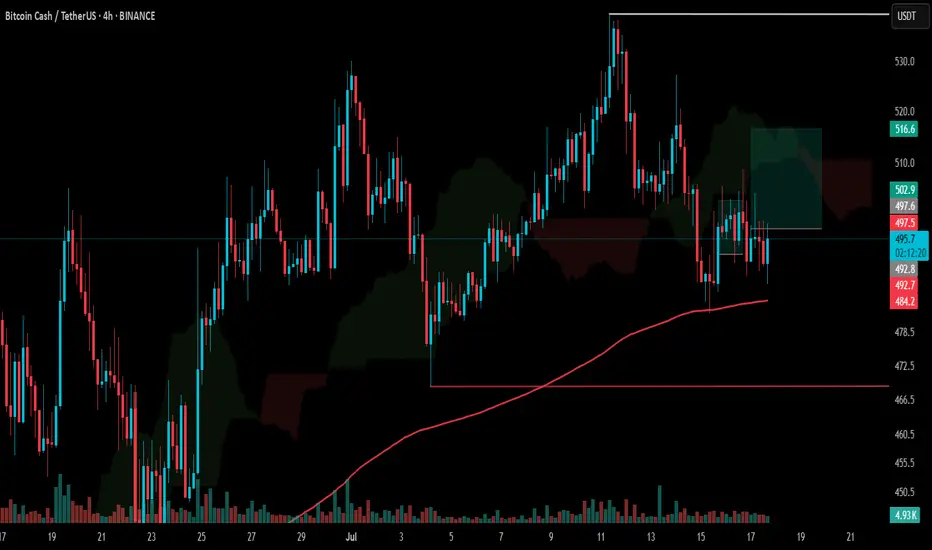
From a technical standpoint, Bitcoin Cash is currently one of the best rounding coins compared to others, and it hasn't broken its upward channel. It continues to move steadily within the trend.
It recently took support from the midline of the channel and made a move, though this move wasn’t very large — it stayed around a 4-5% profit range. It has now completed its correction, but if it drops back to the bottom of the channel and then rises again, the profit potential would be even higher. At the moment, there’s only about 4% upward space left before it meets the top resistance of the channel.
Bitcoin Cash is currently one of the most technically clean and consistent altcoins. If it pulls back slightly, it might be a better entry, but there’s no issue with entering from this level either. Therefore, I’m opening a 4.5% position here, with a profit expectation of 4.5%.
Bchusdt
Bitcoin Cash Reclaims Momentum – Explosive Move Ahead?CRYPTOCAP:BCH Weekly Breakout 🚨
Bitcoin Cash just broke above a key multi-year resistance line, and that’s a big deal.
After months of consolidation above strong support, this breakout could trigger a powerful upside move.
If momentum holds, BCH might be gearing up for a run toward $800 and beyond.
Looks like the real move is just getting started.
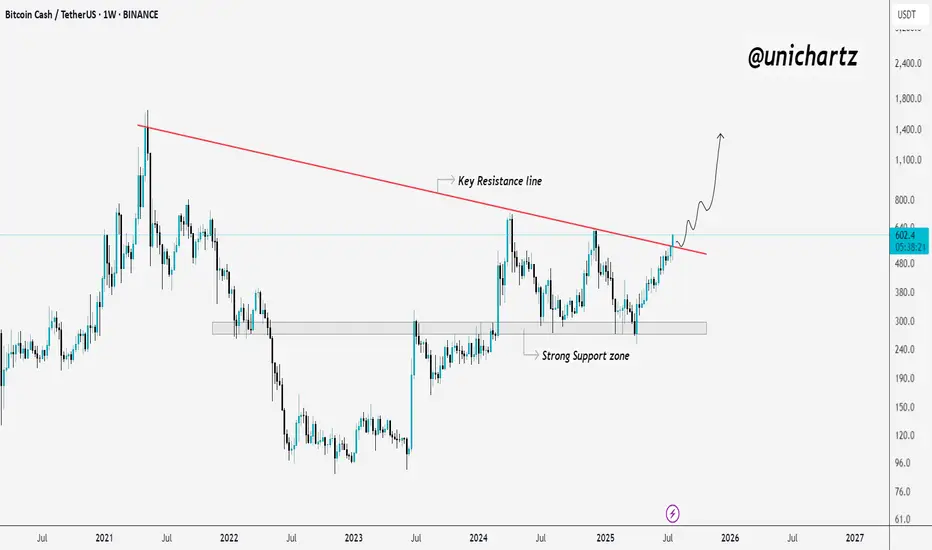
BCHUSDT Bullish ChannelBCH is currently testing the upper resistance of a long-term descending channel on the weekly timeframe, a level that has historically acted as strong resistance. After months of consolidation and a healthy recovery structure, BCH is once again knocking on the door of a major trendline breakout.
The price has steadily recovered from the lows near $250 and is now hovering around $590. A confirmed breakout above this descending trendline could trigger a larger bullish continuation, potentially propelling BCH toward the $1,600–$1,700 zone.
Cheers
Hexa🧘♀️

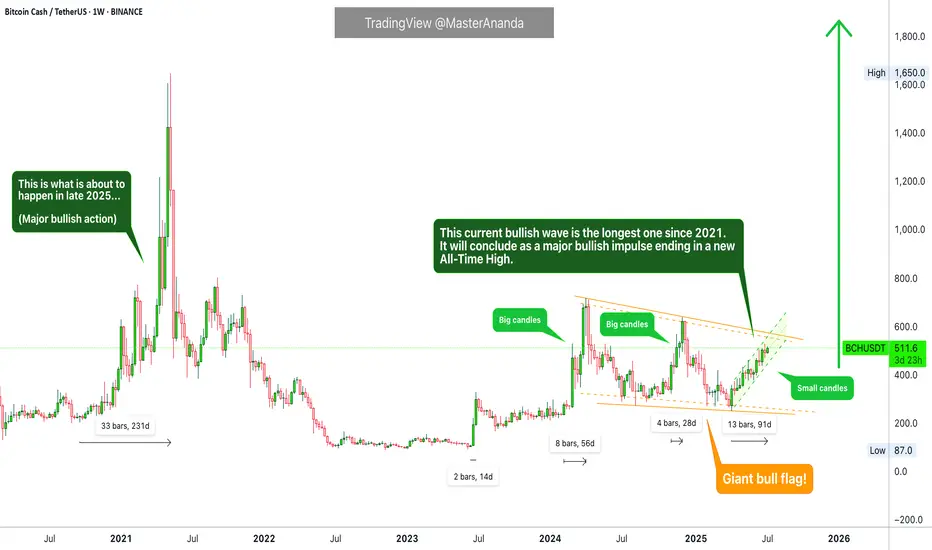
Bitcoin Cash $2,615 Minimum · $4,178 Possible · Plan Ahead105 days. This is definitely the longest stretch of bullish action since 2021. Bitcoin Cash has been growing non-stop for 105 days.
If someone told you this would be the case some months ago or a few years back you wouldn't believe it. What if someone tells you now that you've seen nothing yet? What if I told you that the best is yet to come? This is only the build-up process. Bitcoin Cash is about to shoot up really strong. It will skew the chart. People won't be able to comprehend what is happening less adapt to the market. It will be chaos, bullish chaos.
Years of consolidation. Bitcoin Cash has been on a wide trading range since February 2024. We can easily say since mid-2023 if we consider using a wider range. This is all the build-up process for this moment now. The 2025 bull market. Predicted years ago, now it cannot be denied, it is right in your face.
Let's play the other side for entertainment's sake. Bitcoin Cash stops rising, either a lower high now or a reversal at the December or April 2024 high. What would happen then? A bear market? No! Just a down-wave, more consolidation before the final advance, price jump and market bull run.
Let's go back to reality for accuracy's sake. Bitcoin Cash will grow in bullish momentum and will break all resistance one next to the other, stops will be short. If there is a correction in-between the action, it won't be long.
Look back to the 2021 bullish wave, the fifth wave; notice three weeks red, two weeks red, one week red, etc., in-between the rising wave. Straight up but obviously, there are some stops. When we are in the experience, when it is happening, these weeks feel like forever and we never know if it will continue rising or if that's it, we reached the end. I am telling you now, it will not be over until a major new all-time high hits, and the levels are being shown now. When we are more advanced in the market cycle, I will not try to predict the short-term. Instead, I will tell you to secure profits and move on. Once prices are really high, close your position and start looking for the ones still trading low near support. Of course, writing this won't change anything, people will still be attracted to the action and mistakes will be the norm. Only if you bought early when prices were low, you will be able to withstand the market pressure. If you buy late, the market will kill you and take everything from you. This is a friendly reminder. Plan ahead.
Namaste.

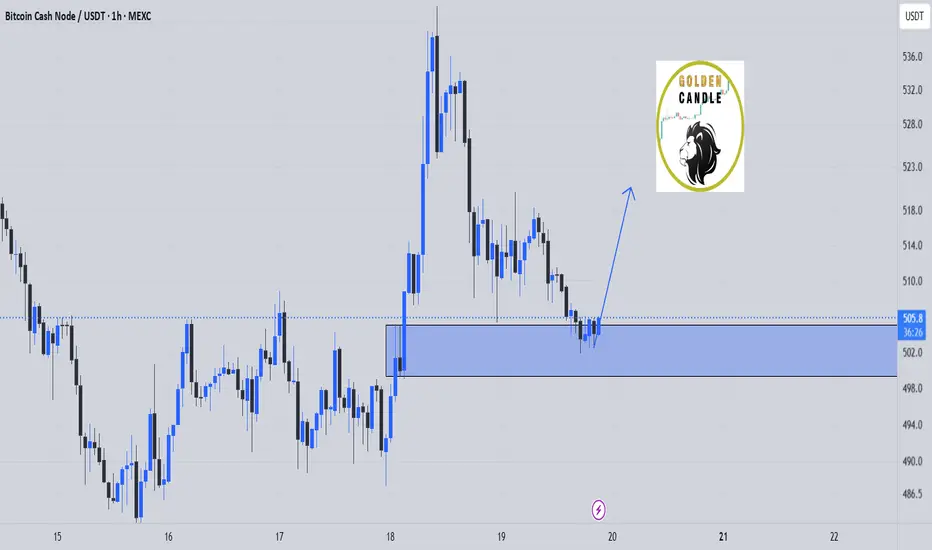
bch buy midterm"🌟 Welcome to Golden Candle! 🌟
We're a team of 📈 passionate traders 📉 who love sharing our 🔍 technical analysis insights 🔎 with the TradingView community. 🌎
Our goal is to provide 💡 valuable perspectives 💡 on market trends and patterns, but 🚫 please note that our analyses are not intended as buy or sell recommendations. 🚫
Instead, they reflect our own 💭 personal attitudes and thoughts. 💭
Follow along and 📚 learn 📚 from our analyses! 📊💡"

buy bch midterm"🌟 Welcome to Golden Candle! 🌟
We're a team of 📈 passionate traders 📉 who love sharing our 🔍 technical analysis insights 🔎 with the TradingView community. 🌎
Our goal is to provide 💡 valuable perspectives 💡 on market trends and patterns, but 🚫 please note that our analyses are not intended as buy or sell recommendations. 🚫
Instead, they reflect our own 💭 personal attitudes and thoughts. 💭
Follow along and 📚 learn 📚 from our analyses! 📊💡"
#BCH Update #2 – July 18, 2025#BCH Update #2 – July 18, 2025
Bitcoin Cash completed a correction after its previous impulsive move, but within that correction, a secondary retracement occurred. This brought the price down to the edge of the 200 MA zone. The MA200 acted as strong support and triggered a reaction.
Despite experiencing another minor pullback, the current structure still appears favorable for Long entries. As shown in the chart, a Long position is already open. I haven’t set a stop-loss because I have enough capital to average down if needed.
For those looking to enter, this could be a good opportunity.
Bull Market Action Exposed—Bitcoin Cash Growing 91 Days Non-StopWhat we are seeing now is very different compared to the past. If you look at early 2024 the rise was composed of strong big candles, always fast as if in a hurry. Very strong growth. If we go further and consider late 2024, we got a lower high but still very big candles. Fast forward to present day 2025, and we have a perfect uptrend, prices rising week after week after week with relatively small candles, some medium-sized but not as big as before. This is bull market action.
In the past, the candles were really big because the bullish action was soon to end, it wasn't expected to last a long time and thus everything needs to be accomplished fast. Things are different now. The fact that we have slow and steady growth is good news. Since the market is going to be growing for a prolonged period of time, the candles are smaller.
Don't be fooled by current price action, it all ends up in a major bull-run. While the candles are small now you can take it as bullish consolidation. Prices are growing but this is still a sort of accumulation/build-up phase. Everything is building up to a very strong climax with new all-time highs all-across and then some more.
Bitcoin Cash has been growing straight up for 91 days. In June 2023, Bitcoin Cash produced only two weeks green. Back in late 2024 all the growth happened in 28 days. Early 2024 56 days was all that was needed and then the market turned red. This is the longest stretch of continued growth since 2021... Yes, the previous bull market. You are witnessing bull market action.
Thanks a lot for your continued support.
Namaste.
Bitcoin Cash: Altcoins Market Bullish Continuation Confirmed!The rise in late 2024, Nov-Dec, lasted only one month. This time the situation is much more different, it confirms what we already know, a major altcoins bull market.
Bitcoin Cash (BCHUSDT) has been growing for 85 days. No strong upthrust with high volatility, but steady growth, the type that exudes strength. At one point there will be a major impulse and this one will be followed by additional growth. What you are seeing is only the start.
Bitcoin Cash helped us predict a continuation of a bullish move for the altcoins several weeks ago. You can reach the same conclusion again. The fact that Bitcoin Cash is bullish now, confirms that the entire altcoins market will continue to grow.
Thank you for reading.
Namaste.
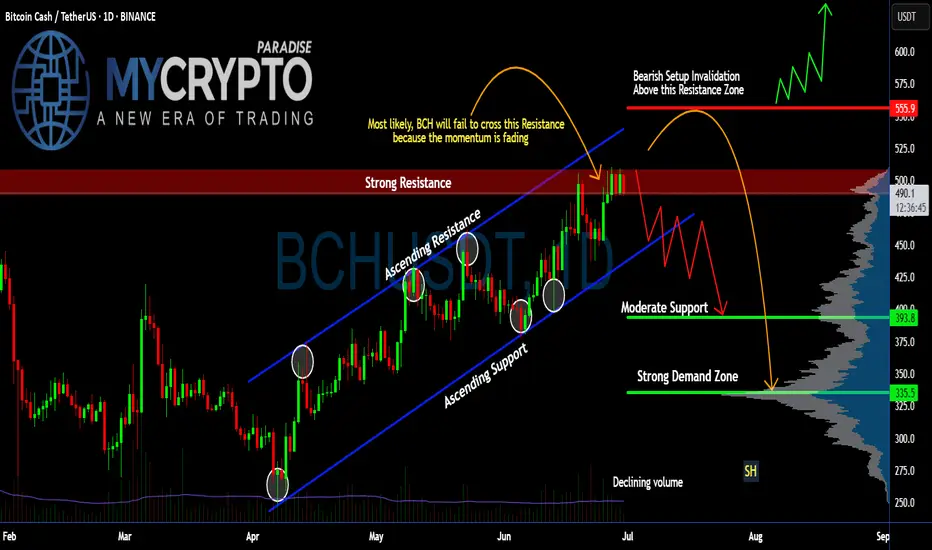
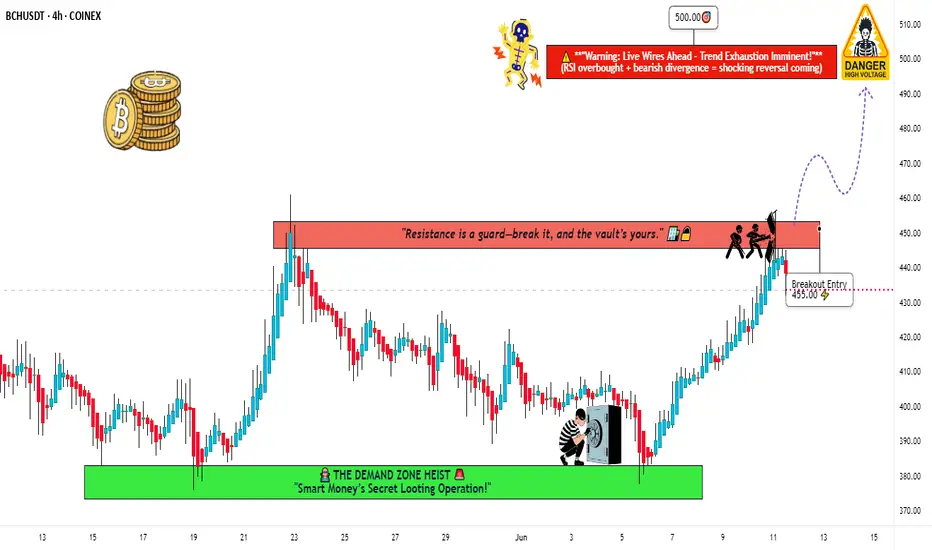
Is #BCH About to Fall or Will it Continue to Rise? Key LevelsYello Paradisers! Have you seen what’s cooking on #BCHUSDT lately? Let’s dive into the latest structure on #BitcoinCash and what may unfold next:
💎#BCH has been trading within a well-respected ascending channel since early April, consistently bouncing between dynamic ascending support and resistance levels. However, the current move into the $500–$505 resistance zone is showing clear signs of momentum exhaustion, as price stalls and volume fades.
💎The strong resistance area between $500 and $505 has rejected price multiple times, and this recent rejection aligns with both the channel resistance and a bearish momentum divergence in volume. Unless #BCHUSD can break and hold above this zone, bulls are fighting a losing battle.
💎The invalidation of the bearish setup lies above $555. Only a confirmed breakout and sustained hold above this level would negate the current bearish structure and open room for a larger bullish expansion. Until then, the risk of a deeper retracement is very real.
💎Currently trading around $490, #BCH looks vulnerable to a drop toward the moderate support zone near $393, with the strong demand zone between $335 and $340 being the high-probability area for a smart-money reaccumulation—if the market flushes weak hands first. This zone also lines up with previous high-volume nodes on the VRVP.
Trade smart, Paradisers. This setup will reward only the disciplined.
MyCryptoParadise
iFeel the success🌴
BCH/USDT Robbery Blueprint | Bullish Breakout Swing Trade Setup🚨 BCH/USDT Robbery Blueprint: The "Breakout Bandits" Bullish Heist Plan! 🚨
(Thief Trading Style – Swing Trade Setup)
🌟Hi! Hola! Ola! Bonjour! Hallo! Marhaba!🌟
Dear Money Makers & Market Robbers, 🤑💰💸✈️
We're about to pull off a high-stakes breakout heist on the BCH/USDT “BitcoinCash vs Tether” crypto market using the legendary 🔥Thief Trading Style🔥 — powered by technical + fundamental recon.
🎯 Mission Objective: Long Entry
"The vault is cracking open... our move starts above the 455.00 MA breakout level. Set your traps smart!"
✅ Buy Stop: Above MA @ 455.00 – The breakout point to initiate the heist.
✅ Buy Limit: Look for pullbacks on 15m or 30m swings for a sneaky entry at key levels.
📌 Set an alarm – don’t blink or you’ll miss the breach!
🛑 Escape Plan – Stop Loss
🔊 Yo crew, hear this:
If you're rolling with a buy stop, don’t drop your stop loss too early – wait till we’re inside!
📍 Ideal SL @ 425.00 on 4H swing lows — keep it smart, based on risk + lot sizing.
You’re the captain of this getaway — protect the loot!
🏴☠️ Target Zone
💰Profit Point: 500.00
(or escape earlier if heat increases 🔥)
Get out before the cops (bearish robbers) regroup!
📊 Heist Intelligence:
Market’s flashing bullish vibes, driven by:
🧠 Fundamentals | 📈 Macros | 🧾 COT Report | 🔗 On-chain Data | 🌀 Sentiment | 🔄 Intermarket Forces
👉 Check our bi0 link for the full briefcase of intel 🔍🧠
⚠️ Trading Alert – News & Volatility Risk
📢 Avoid entries during high-impact news
🔒 Use trailing SLs to protect profits + survive crossfire
💖 Show love to the crew! 💥 Hit that Boost Button 💥
Support our robbery squad – grow stronger, smarter, richer!
Trade like a thief. Rob the markets daily. 🎯💪🏆🚀💸
I'll be back soon with another crypto vault raid – stay tuned, legends! 🐱👤🤑🤩
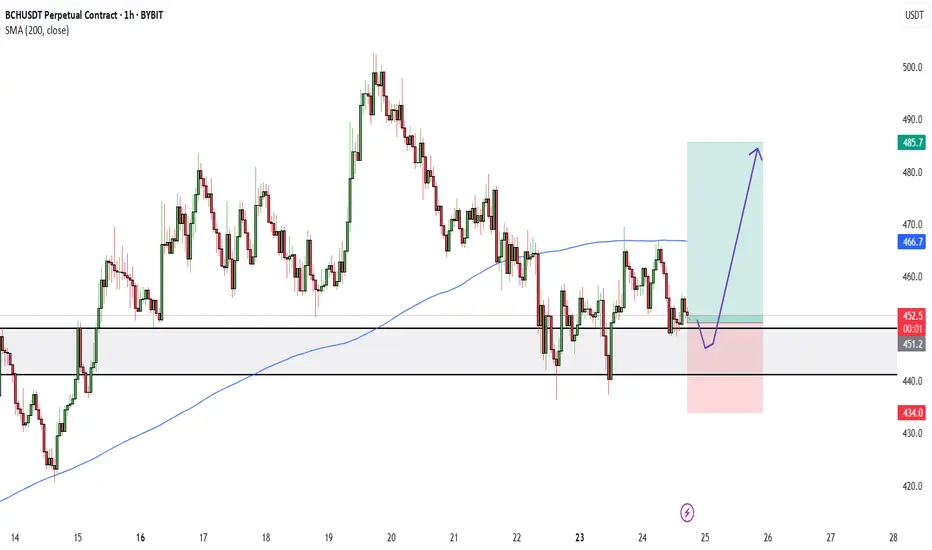
SCREAMING BULLISHBCH/USDT has nicely rejected the 440 support level. Price is currently consolidating below the 200SMA but i think we will see it break it and continue higher as it did last week.
My target is 485.7
SL is 434.0
Bitcoin Cash, Anomaly or Predictive Signal?Some people can say that Bitcoin Cash right now is simply an anomaly, nothing to see here. But a closer look reveals nothing abnormal, more likely a very strong predictive signal that supports what we saw happening with the COIN stock and what was predicted recently to happen with ETHUSDT (Ethereum), that is, a very strong bullish breakout is the next main major market move.
Good morning my fellow Cryptocurrency trader, I hope this day finds you well.
How are you feeling?
Introduction —The market is one
In isolation, the market is tricky and hard to predict. Within a bigger context, we can easily predict what will happen next. Just look at Bitcoin Cash, it shows exactly what will happen because it has been being in perfect syntony with the rest of the market.
Many pairs are consolidating or retracing. My view is that a bullish move comes next.
Let's see how Bitcoin Cash has been behaving lately and compare this to the rest of the market. The fact that it is bullish now predicts that also the other pairs will be bullish because they are moving in the exact same way.
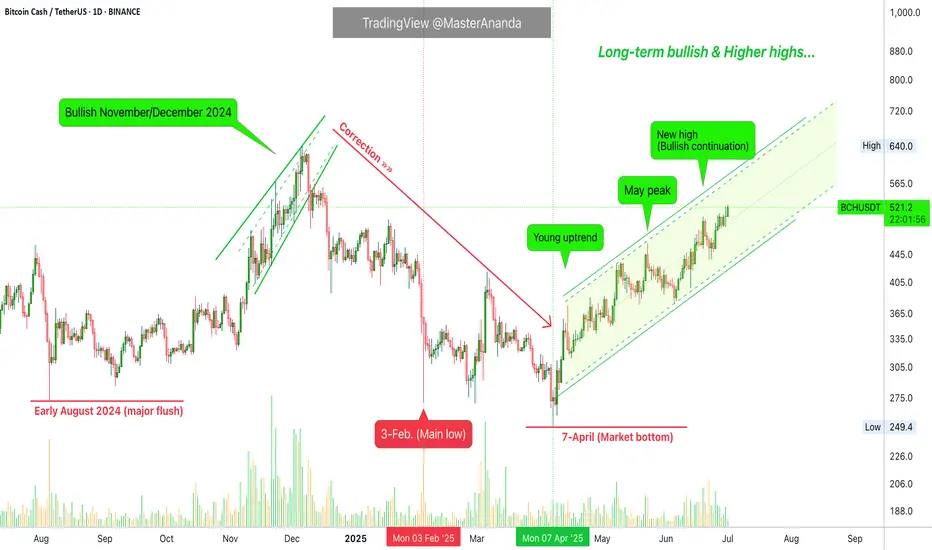
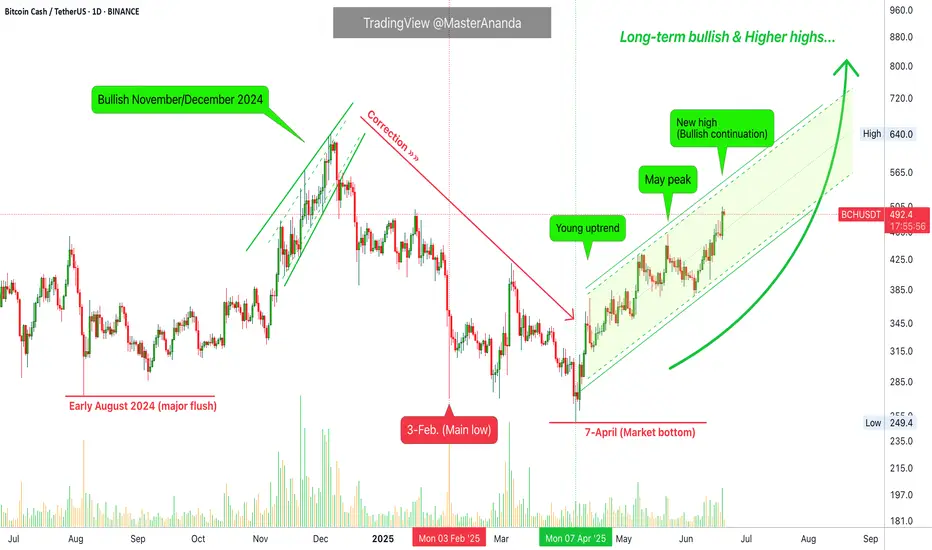
Price action —Past history
A crash ends in early August 2024. By late 2024 the action goes bullish. November 2024 marks the start of a month long advance that ends December 2024. This is true for most of the altcoins market.
The December 2024 peak leads to a correction with the main low happening 3-February. Another low and market bottom happens 7-April 2025. From this point on, we have a recovery and after a high in late May, the market goes into retrace.
Present day
This retrace is where we are today for most of the pairs. 100% of these are trading within a higher low compared to 7-April. Here BCHUSDT ended its retrace and moved ahead of the pack to hit a higher high compared to May. It also produced the highest price since January 2025.
The future
This is not an anomaly. Bitcoin Cash's price action simply reveals what is coming to the rest of the market. As it moved in perfect synchrony with other projects for months or even years, it will continue to do the same. The fact that it is trading higher now, means the other pairs will follow, in fact, some other pairs are already there; a bullish continuation.
Soon everything will grow.
Thank you for reading.
Namaste.
Bitcoin Cash BCH price analysisMore than 3 months have passed since the publication of the previous idea for #BCH, and the price itself has shown an increase of +40%
◆ Slowly but surely growing
◆ Does not react to the price fall CRYPTOCAP:BTC (for those who don't know, #BCH is the first CRYPTOCAP:BTC fork and probably the only one that survived. Then there were 8-10 more of them in 2017-2018... but hey...)
◆ It has been moving in its own direction for more than a year, when OKX:BCHUSDT is cheaper than $300, it is actively bought back by someone.
We have slightly revised the growth target for #BitcoinCash, but why not consider this asset as a long-term investment from $350-400 to $900 and $1250
_____________________
Did you like our analysis? Leave a comment, like, and follow to get more

#BCH/USDT#BCH
The price is moving within a descending channel on the 1-hour frame, adhering well to it, and is heading for a strong breakout and retest.
We are experiencing a rebound from the lower boundary of the descending channel. This support is at 456.
We are experiencing a downtrend on the RSI indicator, which is about to break and retest, supporting the upward trend.
We are heading for stability above the 100 moving average.
Entry price: 471
First target: 480
Second target: 489
Third target: 500

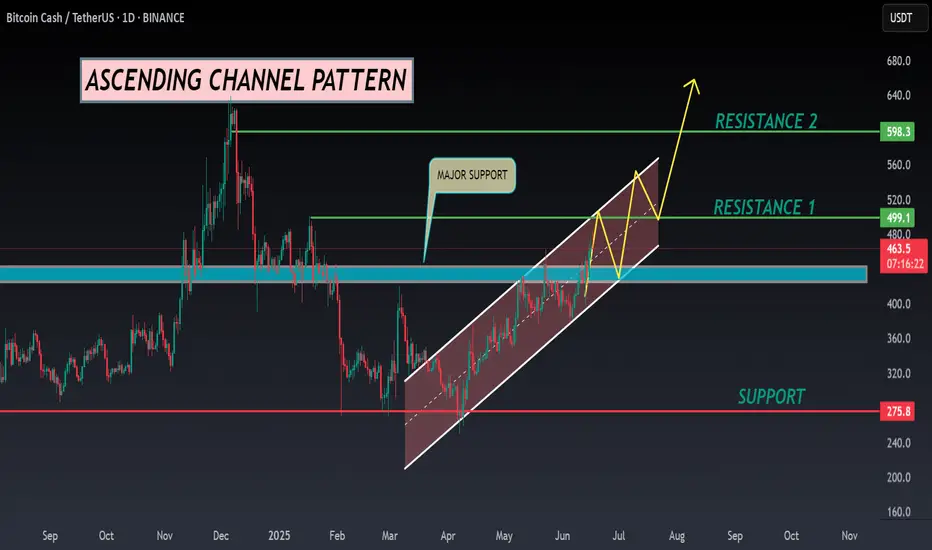
BCH ANALYSIS🔆#BCH Analysis : Channel Following ⛔️⛔️
As we can see that #BCH is following ascending channel on daily time frame. Also there is an instant resistance area. We can see a bullish formation here. And if it trade with good volume then we can see a proper bullish move in #BCH
🔖 Current Price: $463
⏳ Target Price: $598
⁉️ What to do?
- Keep your eyes on the chart, observe trading volume and stay accustom to market moves.🚀💸
#BCH #Cryptocurrency #ChartPattern #DYOR
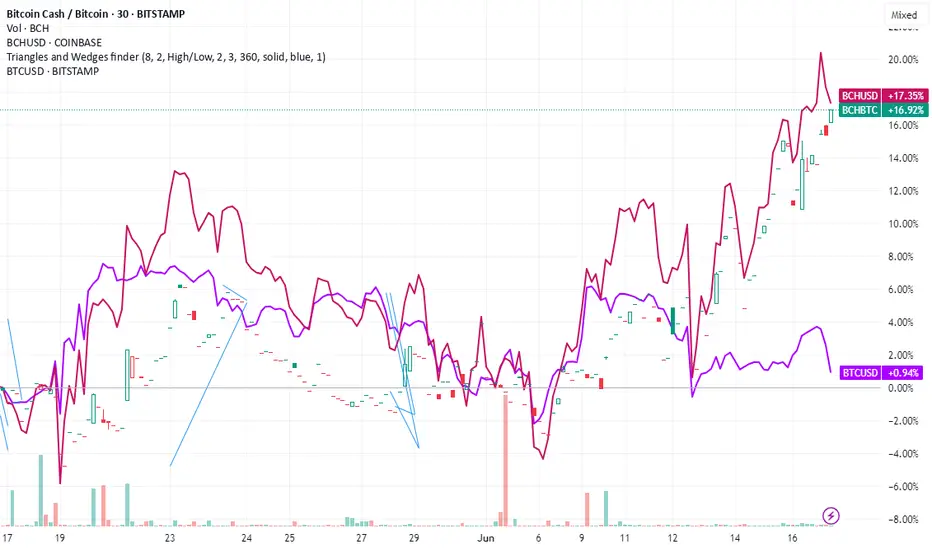
Is the Bitcoin Cash Hype Over? BCH/BTC Ratio Flashes WarningThe Great Divergence: Why the Bitcoin Cash-Bitcoin Ratio Breakdown Signals More Than Just a Price Drop
In the unforgiving arena of the cryptocurrency markets, every chart tells a story. Some whisper of quiet accumulation, others scream of speculative frenzy. But few charts tell a story as profound and historically charged as the Bitcoin Cash to Bitcoin (BCH/BTC) ratio. For years, this ratio has been the ultimate barometer of a digital civil war, a measure of the hopes and failures of a project born from a contentious schism. Recently, that barometer has given its clearest signal in months: a decisive and powerful breakdown from a multi-month triangle pattern.
This technical event is far more than a simple squiggle on a screen for traders. It represents the potential end of a speculative, hype-driven rally and the forceful reassertion of a brutal, long-term trend. It signals that the fundamental chasm between Bitcoin, the undisputed king of digital assets, and Bitcoin Cash, its most famous and ambitious offshoot, may be widening once again. The breakdown suggests that the brief period of optimism for Bitcoin Cash, fueled by its own halving event and a broader market updraft, may be conclusively over. To understand the gravity of this moment, one must dissect not only the technical pattern itself but also the deep-seated historical and fundamental weaknesses that made this breakdown almost inevitable.
The Anatomy of a Technical Collapse: Smashing the Triangle
For much of 2024, the BCH/BTC ratio was trapped in a state of compression. On the chart, this appeared as a classic symmetrical triangle pattern. This pattern is defined by a series of lower highs and higher lows, creating two converging trendlines that form the shape of a triangle. In market terms, it represents a period of intense equilibrium and indecision. Buyers and sellers are locked in a fierce battle, with neither side able to gain a definitive edge. The price coils tighter and tighter, like a compressed spring, building up energy for an explosive move. The only question is which direction it will break.
In the case of the BCH/BTC ratio, that question has been answered with a resounding crash. The price has decisively broken below the lower trendline of the triangle. This is known as a "breakdown," and it is a powerfully bearish signal. It signifies that the sellers have overwhelmed the buyers, the equilibrium has been shattered, and the path of least resistance is now firmly downwards.
Traders often measure the potential target of such a breakdown by taking the height of the triangle at its widest point and projecting that distance downwards from the point of the breakdown. Given the scale of this particular pattern, this technical measurement points to a significant further decline in the ratio, potentially revisiting and even surpassing its all-time lows. This isn't just a minor dip; it's a structural failure on the chart that suggests a new, sustained leg down in Bitcoin Cash's performance relative to Bitcoin. The "hype rally" that saw the ratio climb in the lead-up to the Bitcoin Cash halving has been effectively erased, and the market is signaling that the fundamental gravity of the long-term downtrend is taking hold once more.
A Ghost in the Machine: The Lingering Shadow of the 2017 Fork
This technical breakdown did not occur in a vacuum. It is a single chapter in a long and bitter saga that began in 2017. To grasp its significance, we must revisit the great "Block Size War" that tore the Bitcoin community apart. At its heart was a philosophical disagreement about how to scale Bitcoin to accommodate more users.
One camp, which included many of the earliest adopters and evangelists, argued for a simple solution: increase the block size. By allowing more transactions to fit into each block, the network could process more volume and keep fees low, preserving what they saw as Bitcoin's original vision of a "peer-to-peer electronic cash system."
The other camp, which ultimately retained control of the Bitcoin protocol, argued for a more cautious approach. They feared that large blocks would lead to centralization, making it too expensive for ordinary users to run a full node and validate the blockchain. Their solution was to keep the base layer small and secure, and to build scaling solutions on top of it, such as the Lightning Network.
This ideological impasse led to a "hard fork" in August 2017, creating Bitcoin Cash. For a brief, euphoric period, BCH was seen as a legitimate contender. Fueled by a powerful narrative and influential backers, its price soared, and the BCH/BTC ratio hit an all-time high of over 0.5 in late 2017, sparking serious talk of a "flippening"—the moment BCH would overtake BTC in market capitalization.
That moment never came. Since that peak, the BCH/BTC ratio has been locked in a devastating, multi-year downtrend. The recent triangle pattern was merely a pause, a brief consolidation within this much larger waterfall decline. The breakdown from the triangle is therefore not a new event, but a continuation of a historical trend. It is the market's brutal verdict on the outcome of that civil war.
The Fundamental Chasm: Why Bitcoin Cash Keeps Losing Ground
A chart pattern is ultimately a reflection of underlying fundamentals. The relentless decline of the BCH/BTC ratio is a direct consequence of the widening gap between the two networks across every meaningful metric.
1. Narrative and Brand Identity: Bitcoin has successfully cultivated a simple, powerful, and globally understood narrative: it is digital gold. It is a store of value, a hedge against inflation, and a pristine, unconfiscatable asset. This narrative has attracted institutions, nation-states, and trillions of dollars in potential capital. Bitcoin Cash, meanwhile, has struggled to define itself. Its narrative as "peer-to-peer electronic cash" is less compelling in a world with countless low-fee payment options, including stablecoins and Bitcoin's own Lightning Network. Without a clear and unique value proposition, it has failed to capture the market's imagination.
2. Security and Hash Rate: The most critical measure of a proof-of-work blockchain's health is its hash rate—the total computational power dedicated to securing the network. Here, the difference is staggering. Bitcoin's hash rate is orders of magnitude higher than Bitcoin Cash's. This makes Bitcoin exponentially more secure and resistant to a 51% attack, where a malicious actor could gain control of the network. Bitcoin Cash, with its comparatively minuscule hash rate, remains theoretically vulnerable, a fundamental flaw that deters serious institutional capital.
3. Developer Activity and Innovation: The heart of any technology is its developer community. The most innovative and exciting developments in the Bitcoin ecosystem are happening on the main chain. The activation of Taproot, the explosion of Ordinals and Inscriptions, and the continued growth of the Lightning Network all demonstrate a vibrant and evolving protocol. In contrast, the developer ecosystem for Bitcoin Cash has been far less dynamic. While it has its dedicated builders, it has not produced the kind of groundbreaking innovation needed to attract new users and capital.
3. Adoption and Network Effects: Bitcoin's network effect is its ultimate moat. It has spot ETFs trading on major stock exchanges, granting it unparalleled access to traditional finance. It is held on the balance sheets of public companies and is recognized as legal tender in some countries. Bitcoin Cash has none of these things. Merchant adoption has stalled, and institutional interest is virtually non-existent. In the world of networks, winners tend to take all, and Bitcoin's lead has become seemingly insurmountable.
The Aftermath: What Comes Next for the BCH/BTC Ratio?
With the triangle pattern now shattered, the path forward for the BCH/BTC ratio looks precarious. The most likely scenario is a continuation of the bearish trend that has been in place for over six years. The breakdown has released the coiled energy to the downside, and the ratio will likely seek out lower levels of support, potentially bleeding towards its all-time lows. For investors, this serves as a stark reminder of the risks of holding assets that are fundamentally and technically weaker than the market leader.
Is there any hope for a reversal? A bull case for Bitcoin Cash would require a monumental shift. It would need to carve out a sustainable niche that Bitcoin cannot serve, perhaps in ultra-low-fee microtransactions. It would require a renaissance in developer activity, producing a "killer app" that draws in millions of users. More likely, any significant bounce in the BCH/BTC ratio would probably be a result of a massive, indiscriminate altcoin rally that lifts all boats, rather than a specific vote of confidence in Bitcoin Cash itself. Even then, history suggests such bounces are temporary and ultimately present better opportunities to sell than to buy for the long term.
Conclusion: The Market Has Spoken
The breakdown of the BCH/BTC ratio from its multi-month triangle is a technically significant event with profound fundamental implications. It is the market's latest verdict in the long-running war for the "real Bitcoin" title. The verdict is clear: the hype is over. The dream of a "flippening" is a distant memory, a ghost from 2017.
The story of the BCH/BTC chart is a powerful lesson in market dynamics. It shows that in the brutal competition of open-source protocols, a superior narrative, impenetrable security, and a powerful network effect are the ultimate weapons. Bitcoin Cash began its life as a legitimate contender with a compelling vision. But over time, it has been outmaneuvered, out-developed, and out-adopted. The chart does not lie. It simply reflects this divergent reality, and its latest signal suggests that the great divergence between Bitcoin and its most famous offspring is set to continue.
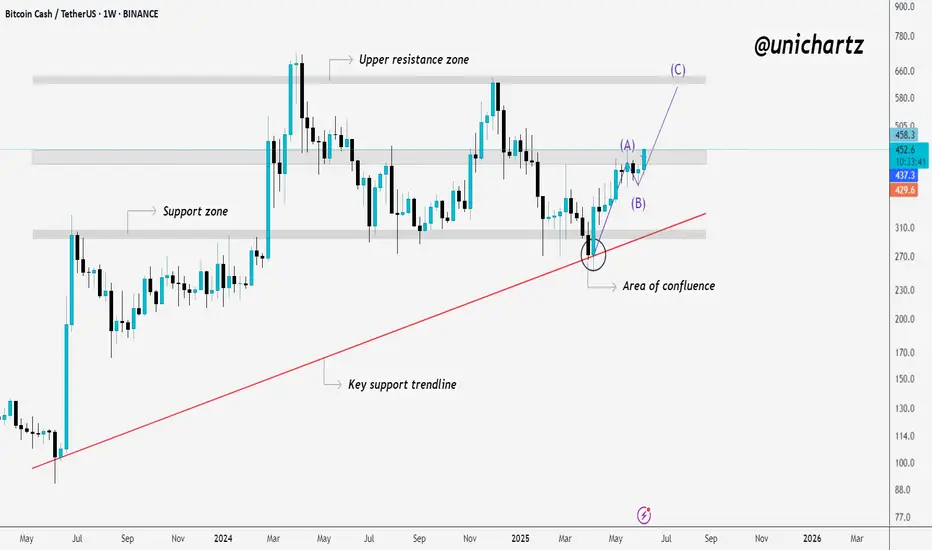
BCH Breaks Structure – Wave C Target in Sight?BCHUSDT Update:
After weeks of slow movement, BCH is finally breaking above the key resistance zone—a level that has acted as a strong barrier multiple times in the past.
This breakout is significant because it aligns with multiple technical confirmations. The support trendline has held firmly, a higher low has been established, and the price has pushed upward from a well-defined area of confluence.
If this breakout sustains, there is a strong possibility of continuation toward the upper resistance zone, completing the projected wave structure. It’s important to monitor this closely, as a successful retest and follow-through could confirm the beginning of the next bullish phase.
Thank you for your precious time.
Bitcoin Cash Weekly Update, Moving Averages & Bullish PotentialI already looked at Bitcoin Cash recently, this time I want to see how the moving averages are doing here to compare with the other Crypto-projects. Good news for one pair is good news for other projects as well specially when they are in the same category. Bitcoin Cash is one of the big projects.
Here we can see BCHUSDT trading weekly above EMA34, EMA89 and MA200, while rising.
Resistance was found at $453, a fib. extension level. Once this level is broken as resistance you can expect a swift advance toward $680. It will be nice and easy. This is the last barrier and current price action is kind of mix.
It is good because this week trades at the highest since November 2024 coming from a low. It is bad because it is lower compared to 19-May on the wick but the week is yet to close.
A weekly close above $420 is highly desirable and favors the bulls, anything lower and we continue with a mixed situation. Make no mistake, the situation is mixed only short-term. The chart shows a clear bullish bias and there will be additional growth in the coming weeks and months. Only the short-term is questionable.
Bitcoin Cash, Bitcoin and the entire Cryptocurrency market is set to grow.
Thanks a lot for your continued support.
Namaste.
Bitcoin Cash Early Recovery & Bullish ContinuationToday's candle says it all. Bitcoin Cash moved to hit a low of $397, today, and the same session now trades at $449, the highest price since 23-May which was the date that produced the highest price since January 2025. This is an early recovery signal.
This signal is good and great but it needs one final bit to be confirmed, and that is a continuation tomorrow. The week is about to end and the close is what determines the next move. If the action closes above the 23-May high, $462, then ultra-bullish confirmed. If the session closes below then there is still room for some more shakeouts, retraces and corrections. But the early recovery signal is in. What one does, the rest follows.
Now, not all pairs will move in the same way. Some will continue lower, retrace, while some others produce an early recovery and move ahead.
Today's session is just too strong, we can easily say that Bitcoin Cash is ready to resume its bullish wave of growth. $684 next target, followed by additional growth.
Thanks a lot for your continued support.
Namaste.

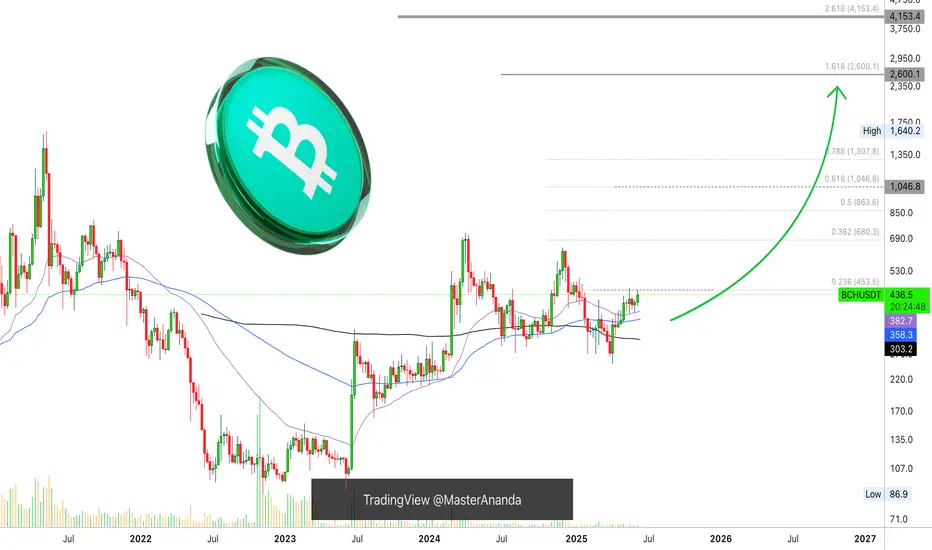
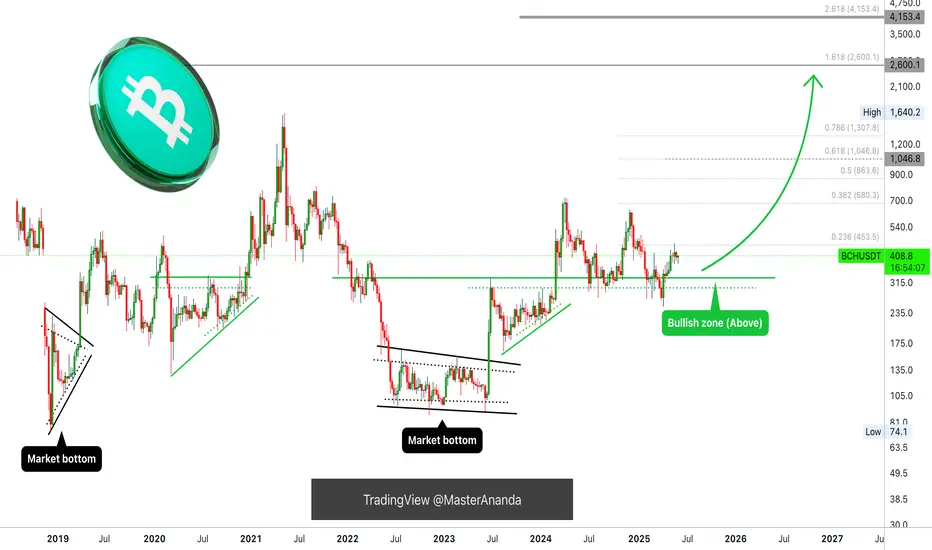
Everything Bitcoin Cash Points To a New ATH; $2,600 or $4,150?Bitcoin Cash is bullish, ready to grow within the bullish zone. There is zero doubt. I think it will be hard to know if the peak will happen around $2,600 or $4,150. There is a huge difference.
Knowing how erratic BCH has been in the past, we have to go with the second higher target; what do you think?
It is hard to say but we have two targets mainly for late 2025. There is no doubt that we will get a new all-time high we just don't know how high.
I will go with the second one just in case. Say this bull market top for Bitcoin Cash will reach somewhere around $4,000. Can be more or less.
You can leave a comment with your number.
How far up do you think Bitcoin Cash will go?
And remember, the bullish bias is already confirmed. Everything points up. The chart, the indicators, the patterns, the signals, the overall market, everything... Thank you for your continued support.
If you enjoy the content make sure to follow.
Namaste.
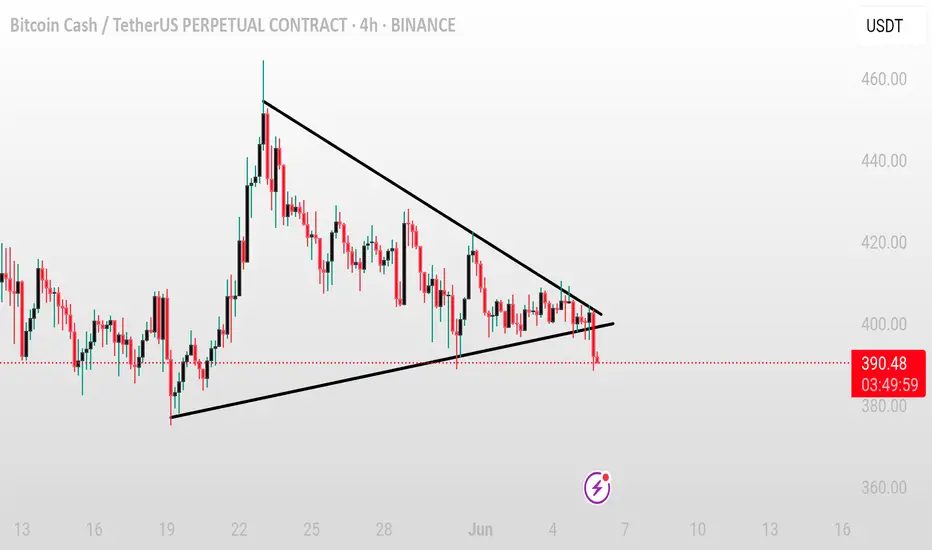
BCH/USDT – Symmetrical triangle breakdown confirmedBCH/USDT – Symmetrical triangle breakdown confirmed
BCH has broken down from the symmetrical triangle pattern, signaling a bearish shift in momentum. If the price continues to trade below the breakdown level with increased volume, further downside can be expected.
Key levels to watch:
* Breakdown resistance zone
* Retest confirmation
* Next support levels below
Monitor closely — staying below the triangle support may lead to extended bearish movement.
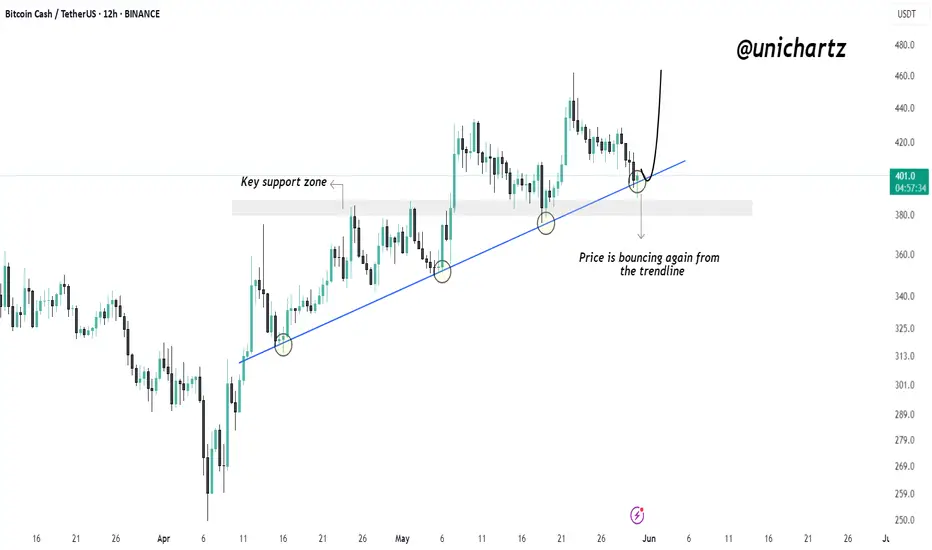
Bitcoin Cash Respects Trendline Again – Is Another Rally LoadingBitcoin Cash is showing strong trendline respect, with multiple successful bounces from the ascending support.
Price is once again bouncing off this trendline, signaling bullish intent. As long as this structure holds, the uptrend remains intact and a potential move toward higher levels looks likely.
Key support and trendline confluence continues to act as a launchpad.