BEAM/USDT Weekly Analysis – Major Accumulation Zone Formed📌 Pattern Description:
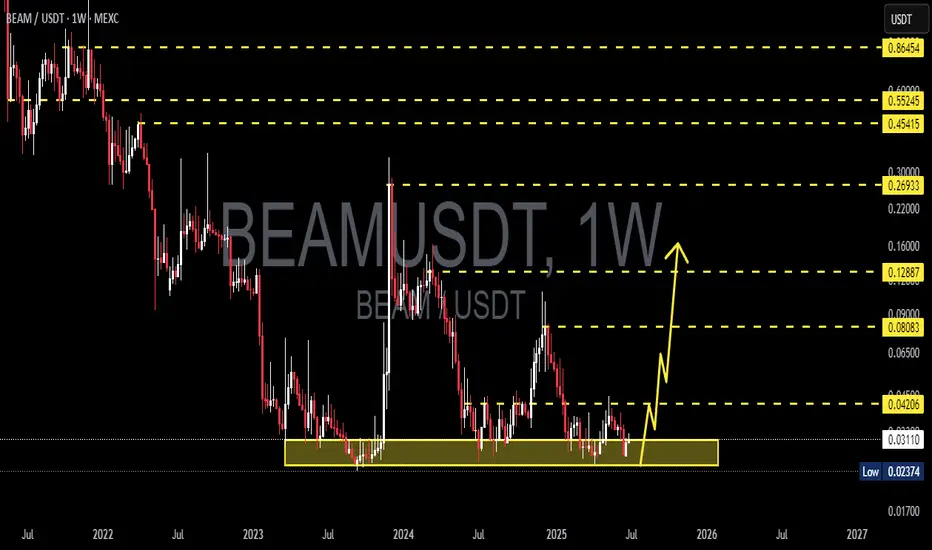
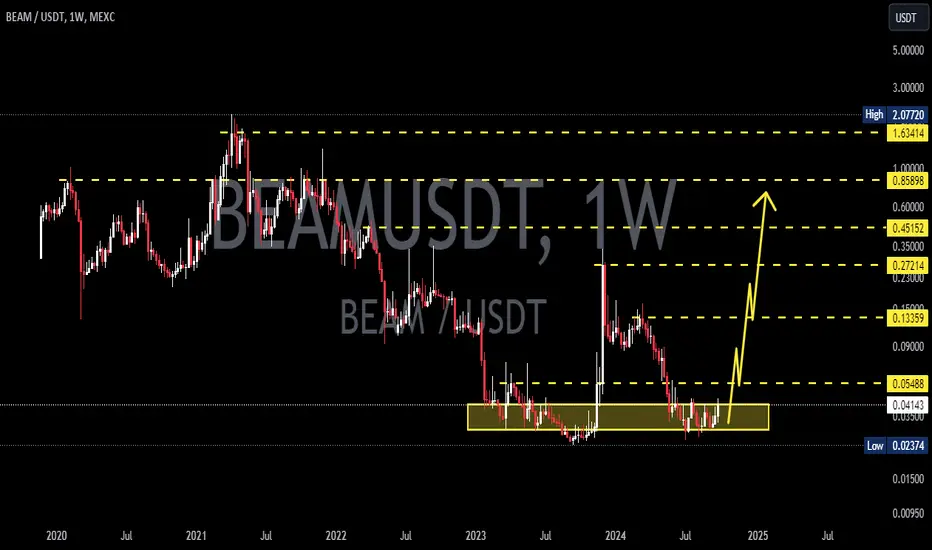
The chart shows a base accumulation pattern where the price is consolidating within a tight range between $0.023 and $0.031, forming a strong demand/support zone. This range has been tested multiple times since early 2023 and has held consistently through 2025.
> This suggests long-term accumulation by institutional players or “smart money.”
🟢 Bullish Scenario:
If BEAM continues to hold above the critical support zone (yellow box: $0.023 - $0.031), it opens the possibility for a bullish breakout. The next resistance levels and upside targets are:
1. $0.04206 – First key resistance and breakout confirmation.
2. $0.08083 – Mid-level resistance.
3. $0.12887 – A major psychological resistance.
4. $0.26933, $0.45415, $0.55245, and up to $0.86454 – Long-term resistance zones based on historical structure and Fibonacci levels.
> A strong breakout from this accumulation range with high volume could initiate a powerful rally in the mid-to-long term.
🔴 Bearish Scenario:
If price breaks below the key support at $0.02374, the bullish structure will be invalidated. This would indicate weakness and potential distribution, possibly leading to further downside below $0.020.
> A breakdown from this range signals that buyers have lost control and the trend may continue downward.
📐 Strategic Summary:
The yellow zone ($0.023 - $0.031) is a critical accumulation area.
Ideal for buy-on-support strategy with tight stop-loss.
Huge upside potential if breakout occurs; suitable for medium- to long-term investors.
#BEAMUSDT #CryptoAnalysis #AltcoinSetup #TechnicalAnalysis #BreakoutIncoming #CryptoTrading #SupportResistance #AccumulationZone #BullishCrypto
Beamusdsignals
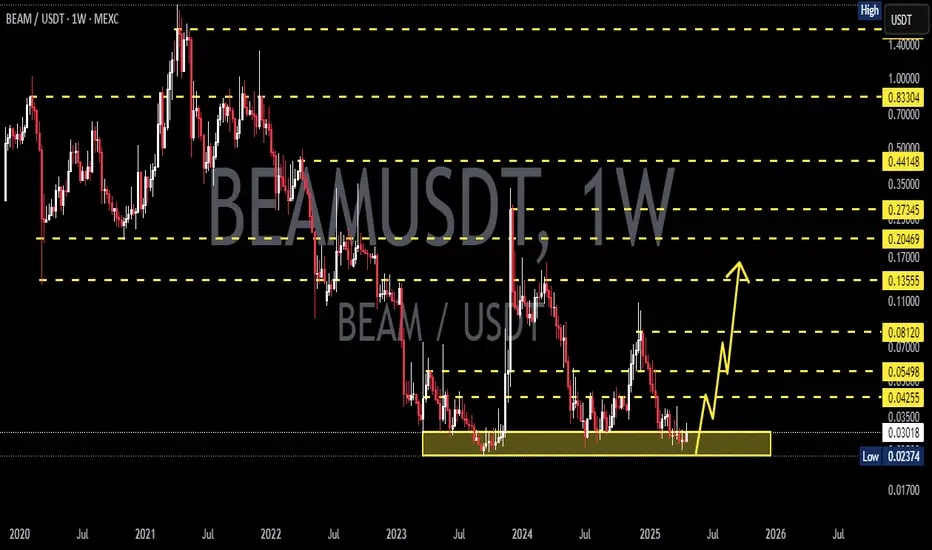
BEAMUSDT 1W AnalysisBEAM ~ 1W Analysis
#BEAM Buy gradually from here if you still have a Conviction on this Coin with a short -term target of at least 20%+
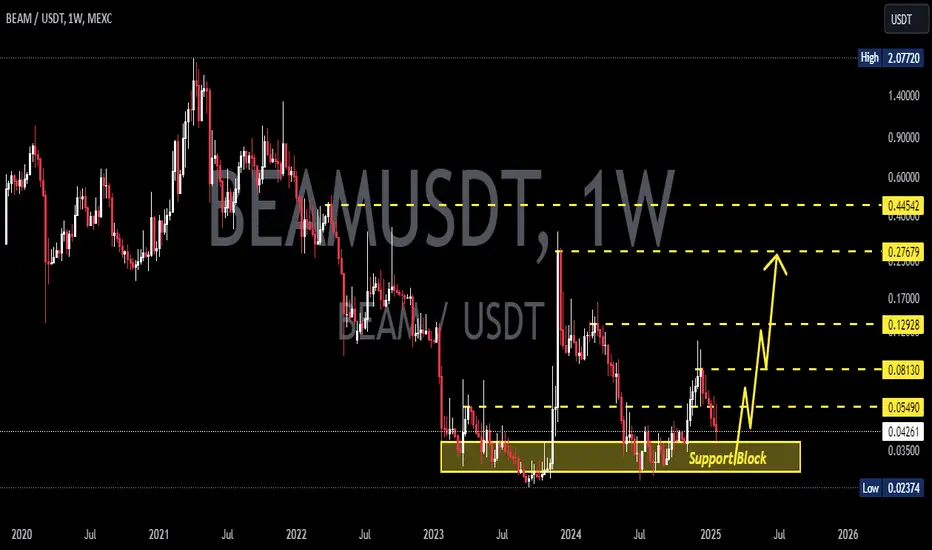
BEAMUSDT 1WBEAM ~ 1W Analysis
#BEAM If you still have Conviction on this coin,. This is a very good support block for now, buy from here with a target of 20%++
BEAMUSDTBEAM ~ 1W
#BEAM If you have Conviction on this Coin,. Maybe this is the right time to start buying.

BEAMUSDTBEAM ~ 1W ✅
#BEAM If you have Conviction on this Coin,. Maybe this is the right time to start buying.
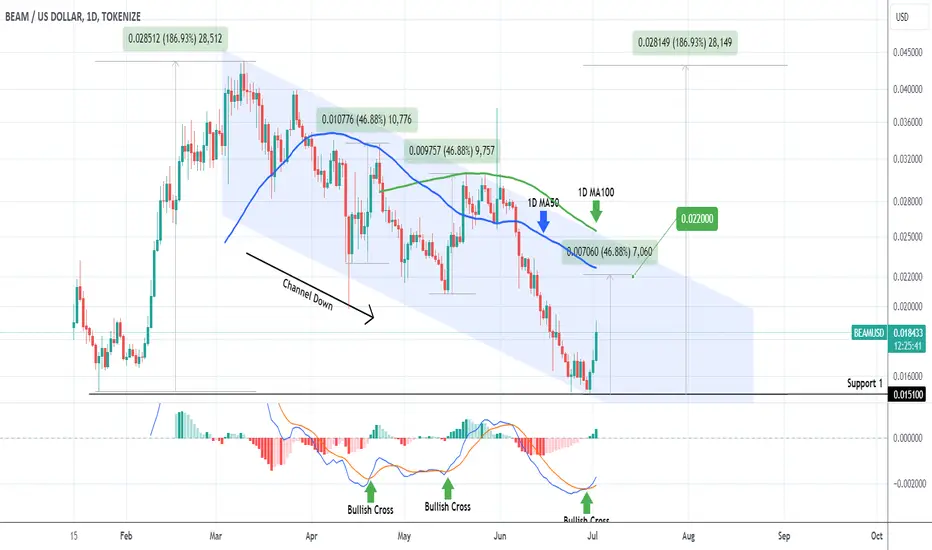
BEAMUSD Bullish Cross aiming for at least 0.2200 short-term.BEAMUSD has been trading within a Channel Down pattern since the March 10 High and today is on the 3rd straight green 1D candle, following a 1D MACD Bullish Cross. That took place on the 0.015100 Support (almost January 23 Low), which makes the buy signal even stronger.
Each Bullish Leg of the Channel Down has been at least +46.88%, so we are targeting 0.02200 for our next Lower High.
If BEAM manages to close a 1D candle above the Channel Down, then we expect an aggressive bullish break-out to complete at least a +186.93% rise, similar to the one that led to the March 10 High.
-------------------------------------------------------------------------------
** Please LIKE 👍, FOLLOW ✅, SHARE 🙌 and COMMENT ✍ if you enjoy this idea! Also share your ideas and charts in the comments section below! This is best way to keep it relevant, support us, keep the content here free and allow the idea to reach as many people as possible. **
-------------------------------------------------------------------------------
💸💸💸💸💸💸
👇 👇 👇 👇 👇 👇