GBPNZD on a bear flag 🦐GBPNZD on the daily chart is creating a bear flag.
The price has tested the 0.382 Fibonacci with a spike and according to Plancton's strategy if the market will break the support trendline we will set a nice short order.
-––
Follow the Shrimp 🦐
Keep in mind.
🟣 Purple structure -> Monthly structure.
🔴 Red structure -> Weekly structure.
🔵 Blue structure -> Daily structure.
🟡 Yellow structure -> 4h structure.
⚫️ Black structure -> <4h structure.
Here is the Plancton0618 technical analysis , please comment below if you have any question.
The ENTRY in the market will be taken only if the condition of the Plancton0618 strategy will trigger.
Bearflags

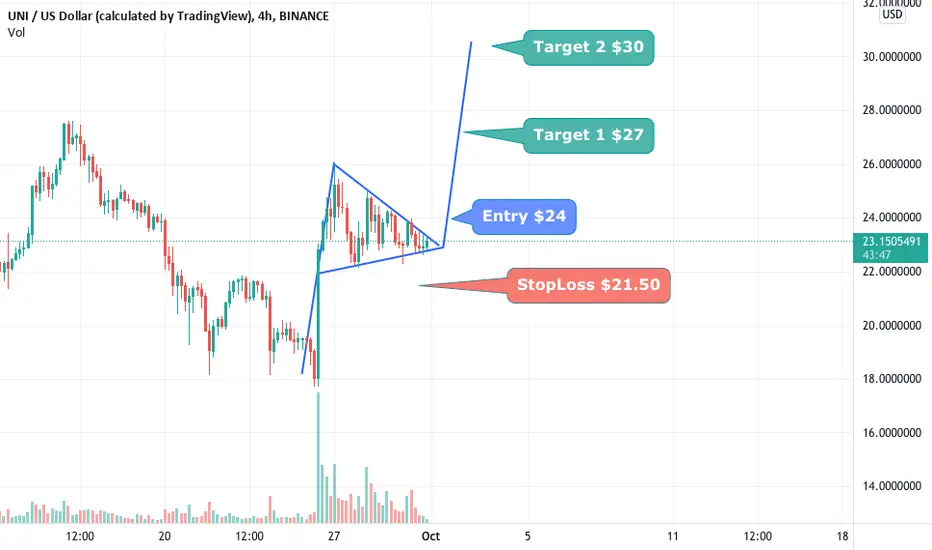
Bull Flag Trading on UNIUSD #BTC #UNIThe bull flag pattern is a continuation chart pattern that facilitates an extension of the uptrend.
In this scenario we have a Bull Flag as well as a Symmetrical triangle in which in a uptrend momentum as we see a huge spike in volume forming the Flag Pole, this pattern has a 67% probability of succeeding to the upside.
Entry Possibilities for a Bull Flag are:
At the Bottom of the Flag
At the Breakout of the Flag
Take Profit i always like to take at 50% of the measure move and at the 90%. This is a momentum pattern and more often than not, at the measured move, price will likely retrace a good amount.
Please support our work with like & comment!
#BTC #CRYPTO #BULLFLAG #BEARFLAG #TRADINGIDEA
SILVER on the break of the channel 🦐SILVER on the daily chart broke the retracement channel.
The market tested the 0.618 level below the resistance structure and currently is trading above a support area.
According to Plancton's strategy if the price will break below we will set a nice short order.
–––––
Follow the Shrimp 🦐
Keep in mind.
🟣 Purple structure -> Monthly structure.
🔴 Red structure -> Weekly structure.
🔵 Blue structure -> Daily structure.
🟡 Yellow structure -> 4h structure.
⚫️ Black structure -> <4h structure.
Here is the Plancton0618 technical analysis , please comment below if you have any question.
The ENTRY in the market will be taken only if the condition of the Plancton0618 strategy will trigger.

Dark Cloud Cover within Bear flag ConsolidationWe have a Bear Flag here and within that Bear Flag we have a Dark Cloud Cover on the daily signaling that Bearish Continuation is more likely. I will be interested to see if the RSI can break below the 50 line as the downtrend continues.
My Take Profit Target will be between the 0.786 and 0.886 retraces below.

BTC - Four Hour Bear FlagSupported by the .382 of the 64.9-28.8K retracement zone; this is the classic bear flag look. The red line is the eight period exponential moving average (8 being a fib number) and the blue line as the the 50 period simple moving average. The Bollinger Bands are based on a 20 period median with 2 standard deviations as the upper (UBB) and lower (LBB) boundaries.

BTC in 3D - Bear PennantPrice found a second Pivot at the Diamond Break Target .618. Currently supported by the 4 hour LBB.

Bear flag formed. Targets to 37k Bear flag formed. Targets to 37k. I plan to hold short to 37k as that seems like the most obvious place for a decent bounce.

Bearish Engulfing On Daily Under An Important LevelWe are under support and the RSI is under 50 and looks to be ready to go down lower i think we will see $200-$180 again.

October and November OTM Put Options Looking Pretty Good HereI will be getting the monthly put options at strike 24 dollars from here in anticipation of a bearflag breakout as i think btc and riot will see the 200 week moving average again.


BTC will dump all the wayA bear flag is forming on Bitcoin. The $43700 support is a strong one, so were consolidating a bit to eventually go down even further. I'm sure we'll see $42000 but I'm expecting that we go even lower.

Despite everything - bearish case is still active!Despite all the fundamental things - my technical look on silver keeps still being bearish.
IF the XAG/USD manages it to make daily close above 24.82 USD and overcomes the 50's SMA, the 38.2 % Fibonacci retracement, and the channel I would see more upside and this could be the end of the bearish case in silver.
Otherwise, it's IMO more likely that silver will resolve the bearish flag by breaking to the downside and will reach some price quotes around 22.40-23.00 USD.

It Looks Like A Double Bottom But Very Likely Could Be A TrapI was looking at this earlier as a potential double bottom with bullish divergence and was looking to take a position after the sessions opened but after a few hours of waiting and letting the trading of this asset go on during the sessions i have not seen anything that would signal immediate bullishness.
I think that this "Double Bottom" Has potential to trap many bulls and instead send the price down to around $9.
The signal i will be using to enter short is once the MACD breaks the trendline and crosses bearishly i think we will see a nice move down to the $9s

BTC - Bear Flag at 35% of Break TargetBTC continues consolidation in a channel with Lower Highs in controlled descent.

BTC - Testing Lower Bound of Larger FlagCoinciding with the release of the Fed July Notes, risk off is the move so far today. This flag was composed of two smaller flags.

Bear Flag Breaking Down Below SupportWe could see a retrace down to 42400 upon bearishly breaking this consolidation.

NAS - Bear Flag - in 3DNAS is attempting to recover the larger wedge with a back test. Resistance a the 2 hour 8 EMA with the MBB and 50 SMA above in parallels. Fed notes at 2 PM EST; watching for compressed range until then.

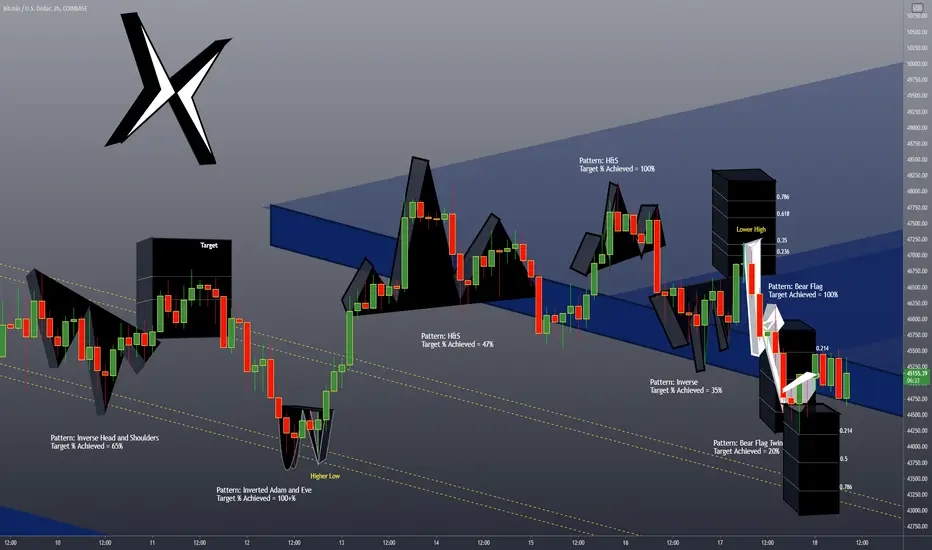
BTC - The Game of Patterns - Bear Flag Target AchievedThe twin flag break to 20% of the target resulted in the original flag achieving 100% of it's target.
PLTR Gap Fill after bear flag trapPLTR escaped a bear flag pattern, and a new short term pattern formed a bull pennant. Looking for an upward breakout to fill a gap at $26.40

Bearish Consolidation Beneath ResistanceWe will probably see a move down to around 26 cents to attempt to test that as support and if 26 cents breaks and fails to be support then we will go much lower than that.

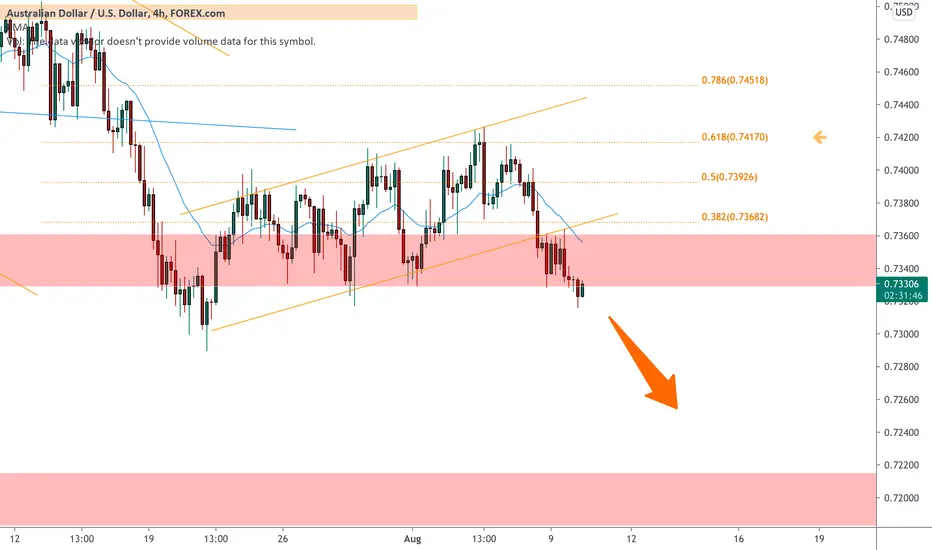
AUDUSD on a bear flag 🦐AUDUSD on the 4h chart has recently break the bear flag,
The price after the test of the 0.618 Fibonacci level is breaking below the weekly support.
According to Plancton's strategy if the market will satisfy the Academy condition we will set a nice short order.
–––––
Follow the Shrimp 🦐
Keep in mind.
🟣 Purple structure -> Monthly structure.
🔴 Red structure -> Weekly structure.
🔵 Blue structure -> Daily structure.
🟡 Yellow structure -> 4h structure.
⚫️ Black structure -> <4h structure.
Here is the Plancton0618 technical analysis , please comment below if you have any question.
The ENTRY in the market will be taken only if the condition of the Plancton0618 strategy will trigger
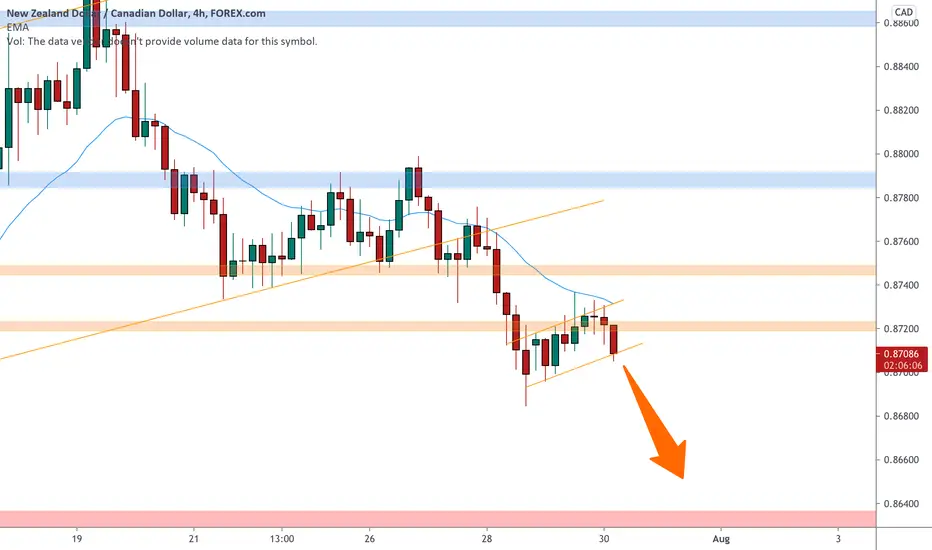
NZDCAD on a bear flag 🦐NZDCAD on the 4h chart has broke as expected the ascending channel.
The price is now moving in a bear flag and according to Plancton's strategy if the market will break below we will set a nice short order.
----
Follow the Shrimp 🦐
Keep in mind.
🟣 Purple structure -> Monthly structure.
🔴 Red structure -> Weekly structure.
🔵 Blue structure -> Daily structure.
🟡 Yellow structure -> 4h structure.
⚫️ Black structure -> >4h structure.
Here is the Plancton0618 technical analysis , please comment below if you have any question.
The ENTRY in the market will be taken only if the condition of the Plancton0618 strategy will trigger
BTC Bear Flag on 4HBTC is forming a BEAR FLAG where I have highlighted in white. This suggests a move LOWER in price. The trend is BELOW the RED SUPER TREND RESISTANCE LINE and also BELOW the YELLOW 200 MA RESISTANCE LINE. This indicates a BEARISH forecast as long as the trend stays BELOW these RESISTANCE LINES.
