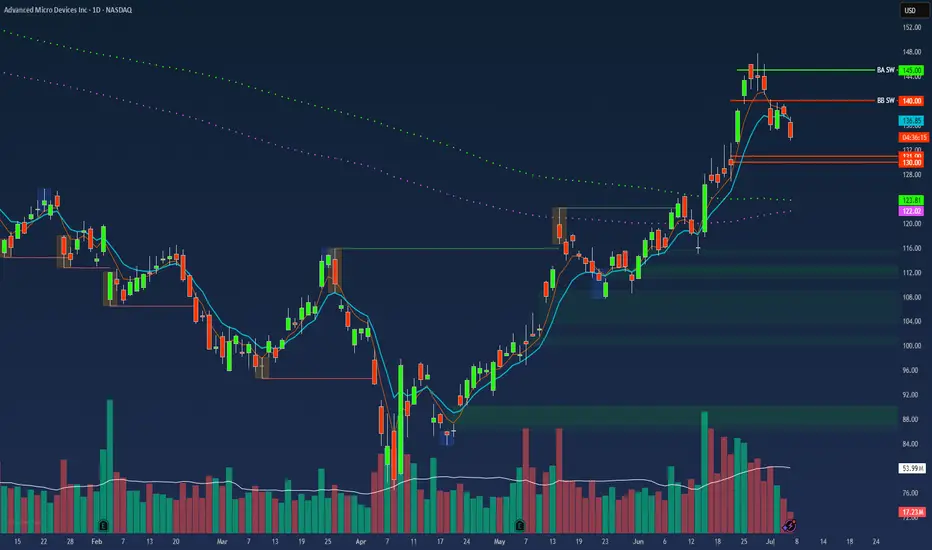
$AMD Swing Trade – Put Debit Spread Setup🔻 NASDAQ:AMD Swing Trade – Put Debit Spread Setup (Jul 18 Exp)
📅 Trade Opened: July 3, 2025
🛠 Strategy: Buy to Open (BTO) Put Debit Spread
📉 Strikes: $31 / $30 (Jul 18 Expiration)
💵 Cost (Premium Paid): $0.21
🎯 Trade Thesis
This setup aims to capture short-term downside in NASDAQ:AMD via a low-cost, defined-risk spread. The trade fits within my broader portfolio of OTM spreads under $0.25.
Key Drivers:
🔻 Semi sector under pressure – NASDAQ:AMD showing relative weakness.
📉 Breakdown below key support near $31 and rejection at VWAP.
🧾 Weak momentum – MACD trending down, RSI near 44.
🔄 Trade enters into earnings season volatility.
📊 Technical Setup (Daily)
EMA(4) < EMA(8) < EMA(15): Bearish structure fully intact.
VWAP: Price rejected from 30-day VWAP zone.
MACD/RSI: Momentum still fading, no signs of bullish divergence.
⏳ Strategy Notes
Max loss: $0.21
Max gain: $0.79
Risk/reward structured for a drop into or below $30
Expiration: July 18
🧠 Journal Note
Most of my trades are swing-based using OTM debit spreads with tight risk control. No same-day entries — setups must have defined technical compression and short-term catalysts.
Bearish-options
BEARS in controlTSLA was not able to rally enough momentum to the upside.
Friday March 11,22
TSLA expected to reach and break 780 to the downside.
With possible targets @ 767.76 and 729.44 do not want to leave the possibility of it reaching 690
What can happen before this?
A bounce from current position to 814.44
or a complete retest of the contended 850.

AAPL -very near term trade Idea I expect some very short term downside to finish this week. As can be seen on the four hour chart, rising wedge within a downward bearish channel. For short term I expect it to fall to position 5, finding a bottom and then reversing.
Looking at the day chart I think its possible with the TTM squeeze turning positive as well as a possible cross on MACD we break out of the bearish channel and push higher permitting that there isn't any significant bad news market wide and for AAPL.
Always do your own analysis before taking any position.
share your thoughts.

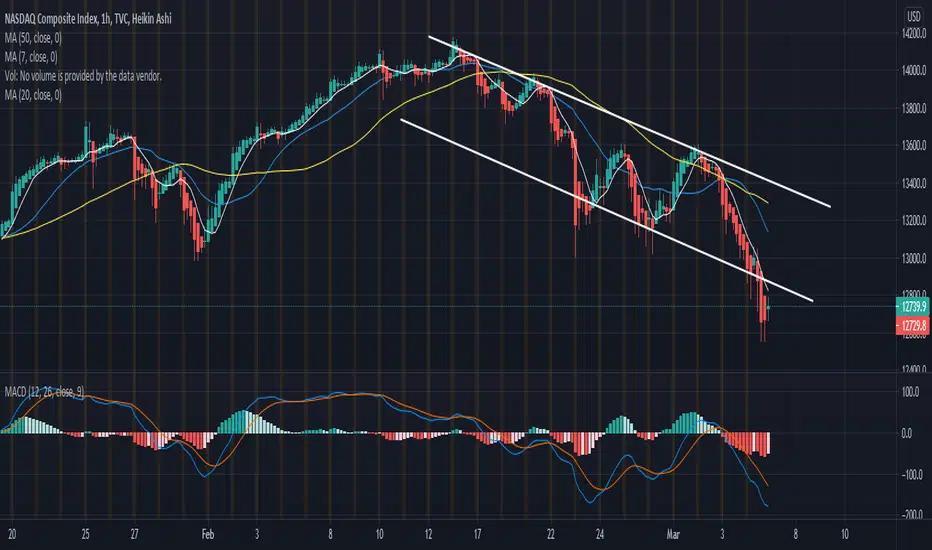
Bear SeasonIXIC
I went Bear today and going Big Bear tomorrow - Purchasing a variety of puts and couple calls on inverse ETFs.
Example: QQQJ $31p 19Mar
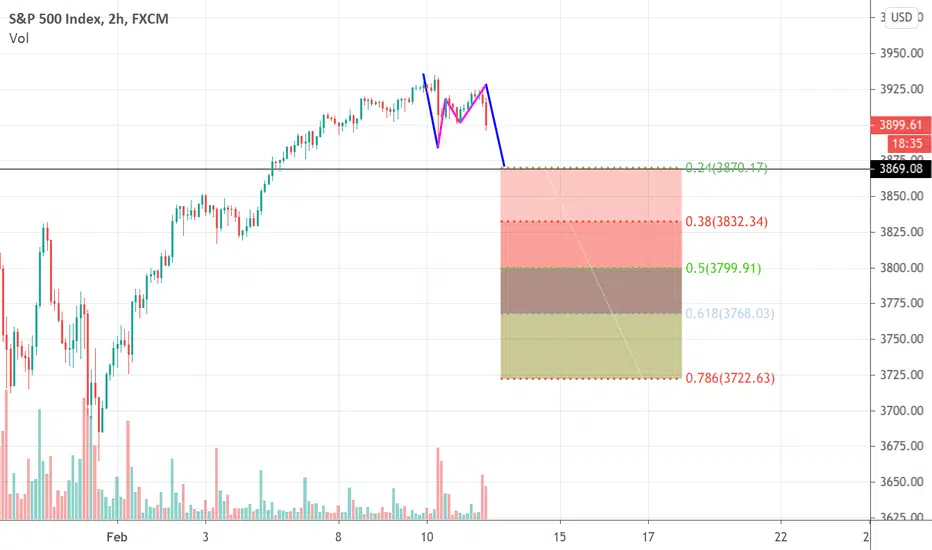
SPX500-Bear Setup (Update)This is an updated trade plan based on my last published trade setup (SPX500-Bear Setup)-posted yesterday. Just reading price structure and making some adjustments on where I think this correction might end. 3870 is going to be descent support and would complete a measured abc move from the local top. This would give us the correction we need to proceed to 4k+....nothing has changed with my longterm view on sp. We are still in a very strong uptrend and have key fib extensions at 3960 & 4k+. Please let me know if you have any questions but for now im leaning towards taking most of my profit @387 may lets some ride just depends. Thanks, and Happy Trading!
BYND to $150BYND has been in a range since november 20th. over $145,70 and i'll be looking to take this up to $150 to fill gap and possibly to $152.

$FB Facebook - Head & Shoulders, Bearish Options Activity$FB Facebook - Not the cleanest looking Head & Shoulders and this would definitely be a risky short, but I could see this closing the gap from July 31st at $235.00 in the near term. Given the current trajectory of the 200d ema line, that would likely provide additional support at that level to prevent any further decline.
Bearish Unusual Options Activity Today:
$13.4M of $280.00 strike (deep ITM) December'20 puts traded today
Near term target: $235.00 by early November
Note: This is NOT investment advice.

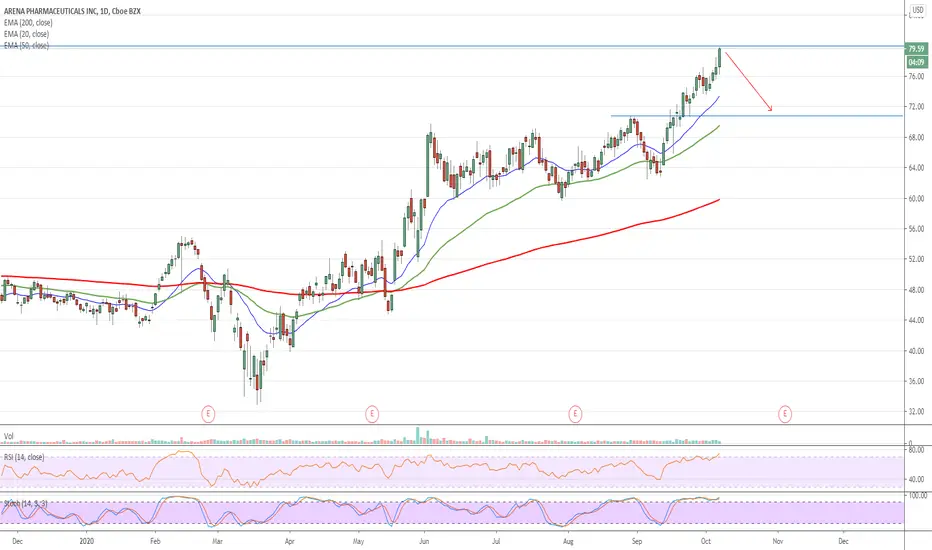
$ARNA Arena Pharma - Bearish Options Activity$ARNA Arena Pharma - Approaching a long term resistance level today at $80.00 - anticipating a near term retrace.
Unusual Bearish Options Activity -
5k $70.00 strike (OTM) Dec'20 puts traded yesterday vs open interest <250 or 23x OI for over $4M
Near term target: $70-$72 range by early November
Note: This is NOT investment advice.
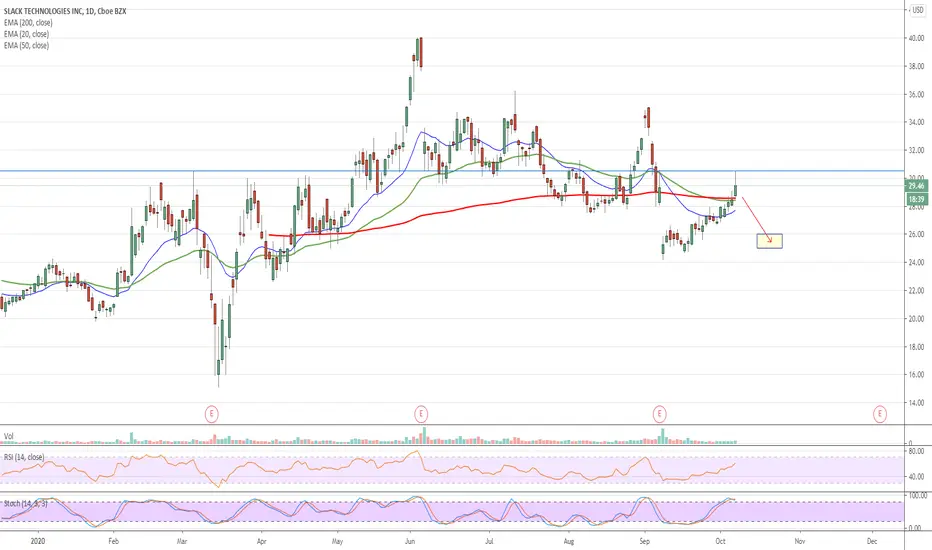
$WORK Slack - Overbought, Bearish Options Activity$WORK Slack - Hitting resistance today at $30.50 and beginning to retrace.
Unusual Bearish Options Activity Yesterday -
12k $30.00 strike (ITM) Dec'20 puts traded vs open interest <2k or 6x OI for a total premium outlay of $5M
Near term target: $25.00-$26.00 range by late October
Note: This is NOT investment advice.
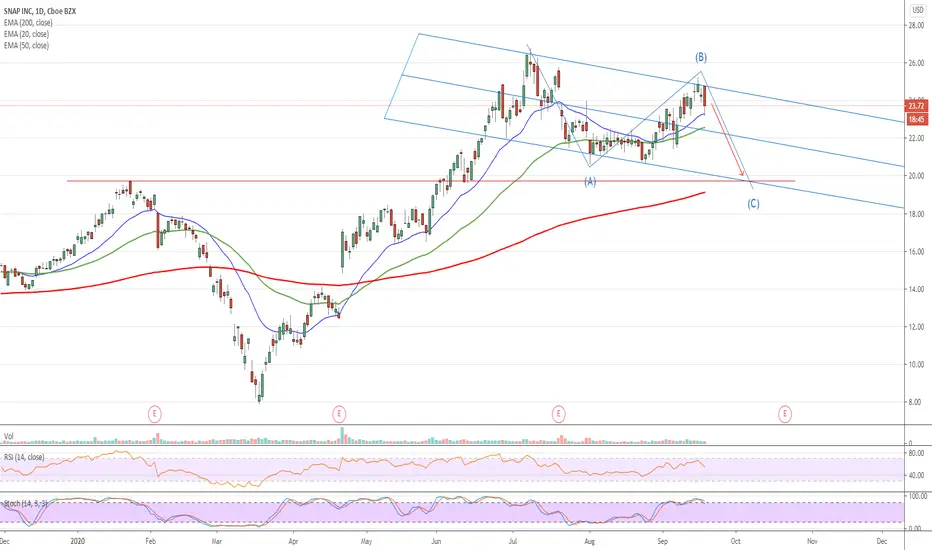
$SNAP Downtrend Continues - Bearish Options Activity$SNAP Downtrend Continues - Unusual Bearish Options Activity
Expecting one more leg down in this recent downtrend.
Unusual Bearish Options Activity Today:
30k $21.00 strike (OTM) November 20th puts traded today vs open interest <200 for a total premium outlay of $4.1M
Near term target: $20.00 by mid October
Stop loss: $25.00
ES!1 Higher or Lower?S&P 500 Futures
With Quad witching this week, the market has been on a downtrend but reaching weekly demand zone. This could mean that we break lower next week if this does not hold but overall it looks like this will bounce from here. Moving into the hourly chart, ES1! Has repeatedly tested and failed to breach below demand. This could mean that investors are selling their monthly contracts and re-upping or rolling contracts in preparation for next week.
What does that mean for Traders next week?
With AMZN announcing the anticipated date for Prime Day, as well as hitting weekly demand zone, next week could be a ride back up as investors buy stocks at a discount. With elections and other political news to come surrounding the newly proposed stimulus check, we should see a bounce, whether we hit new ATH before elections is unclear but I would expect not to.
This week has been very volatile and red, IMO options traders have invaded the market, and it would take one swift move to knock a lot out, which is what I believed happened this week. Softbank hiked us past $3530 resistance as they bought up $4bil in tech call options, this made investors think someone knew something, therefore buying and making us go higher than anticipated. This last week has been investors taking profits and trading more cautiously until everything calms down.
Tomorrow should be very volatile either way, if you are trading options, I would say be cautious as big money is going to be moving around a lot trying to sell or roll their monthly contracts before they expire. My personal recommendation would be to wait until next week for a clear direction, whether we head back up or dip down lower.

NVDA PT $495Looking for a retest of $494. over $494 we are looking at $505 and then $512. if we can't break $494 then I see price falling down to $475

ETSY over $121 i'm looking at $128price should retest $121 over $121 i'm seeing $128 break below $117 and i'm seeing $113 (gap)

AMD has gone parabolic, good shorting opportunityShort idea is summarized as follows
1. stock has gone parabolic and these typically have aggressive corrections
2. robintrack shows sentiment is extremely optimistic so would like to make a contrarian bet
3. assuming a SZ 84-88 so taking a $4 risk and executing the trade via November PUTS. 80 strike

AAPL Trend & Volatility Likely Unsustainable - Sell SignalThe ADX indicator measures the strength of a trend, not its direction. The mid part of last week AAPL was in "full bull" mode printing 23 consecutive bullish 30m candles in our paintbar study. We've included a legend on the chart indicating bars colors and the corresponding strength of a trend.
The Extreme Turn Sell Signal that our strategy generated on Thursday was confirmed for a short entry at 453 when the color rotated from full bull to bull neutral (lime to gray).
Given the strength in AAPL and rich premiums, we chose to express the trade using a Bear Call Credit and even entered an ITM spread which is unusual for our models.
Aug 14 250/255 Bear Call 2.25cr
Underlying target will be the visible range POC at 437, but will manage exits to 50% of premium received.

Intersting straddle www.thedailybeast.com
Although the left-wing US media uses inconclusive data to make anti-trump electoral propaganda, it is interesting to operate a straddle ratio in this situation.
Personally I think a fall is more likely; When sensational news appears pointing in one direction, it makes everyone go after like mosquitoes to the light, and buy. It is somewhat predictable. In this type of situation it is precisely where the price usually falls.

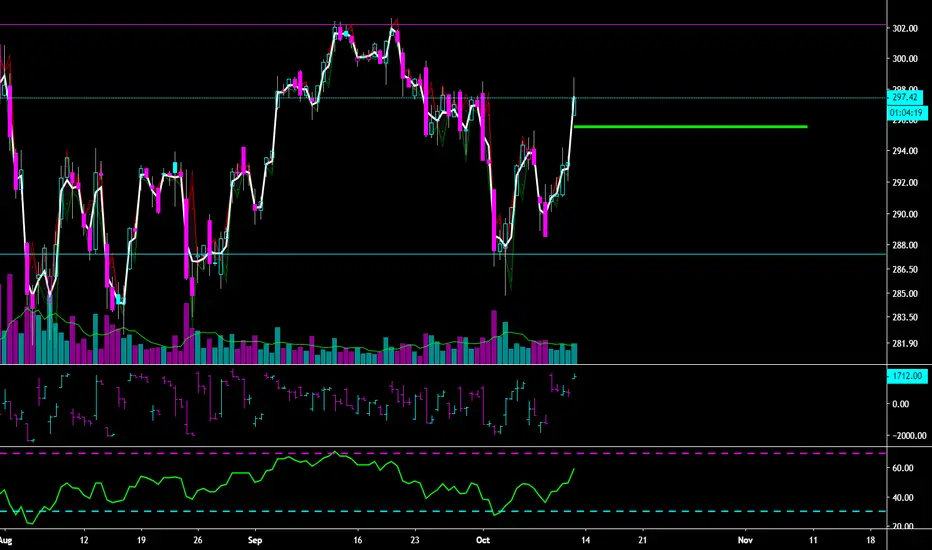
$SPY Put Debit Spread$SPY Put Spread
Buy: 11/08 297p for 4.56
Sell: 11/08 292p for 3.11
Net Debit: $1.45
Max Profit: $3.55
45% POP
Do not like debit spreads in general but taking my chances on a dip below $295.55 (break even at expiration) at some point in the next 28 days. SPY has seen a massive run in the last two days and we know how Trump tweets and China trade deal cycle work out by now. I prefer neutral strats but taking a bearish position here.
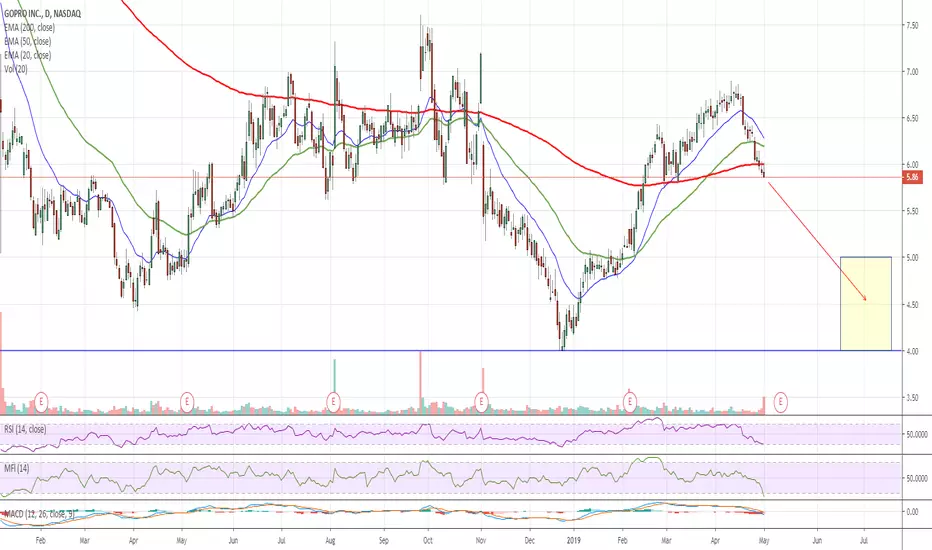
$GPRO Back Below 200d - $5M Bearish Options Bet$GPRO Back below 200d ema line, headed lower near term.
Bearish options bet today - 25k $8.00 strike (deep ITM) July puts traded today for total premium of $5.6M vs OI of less than 150
Medium term target - $4.00-$5.00 range by early July
$PLNT Planet Fitness - Overbought at Resistance$PLNT Planet Fitness - Overbought at Resistance
Expecting a near term retrace - targeting $60-$62 range within 1 month (depending on overall market conditions we could dip sub-$60)
A nice way to play it might be a bear put spread, buying the Apr 18th $65.00 strike puts going for around $1.50 and selling the Apr 18th $60.00 strike puts going for about $0.45 for a total cost of about $1.00-$1.05 with a max profit of $5.00 per spread. (possible 5 to 1 return)
Note: Informational analysis, not investment advice.

$NVDA Shooting Star on Daily - HUGE Put Options Activity$NVDA Bearish signs on the daily chart
- Closed gap from late Jan near $156 then retraced
- Rejected by the 50d ema on the daily chart
- Formed shooting star candlestick marking possible near term top
On top of all this, we saw some enormous put options activity today with upwards of $700M of March and June expiration puts traded at varying strikes all deep-in-the-money for big per contract premiums. Combined we're talking around 70k contracts vs OI of only 14k coming into the day.
With earnings coming up late next week, someone is betting very big on a sell off in the very near future. See chart for two possible near term targets.
Note: Informational analysis, not investment advice.

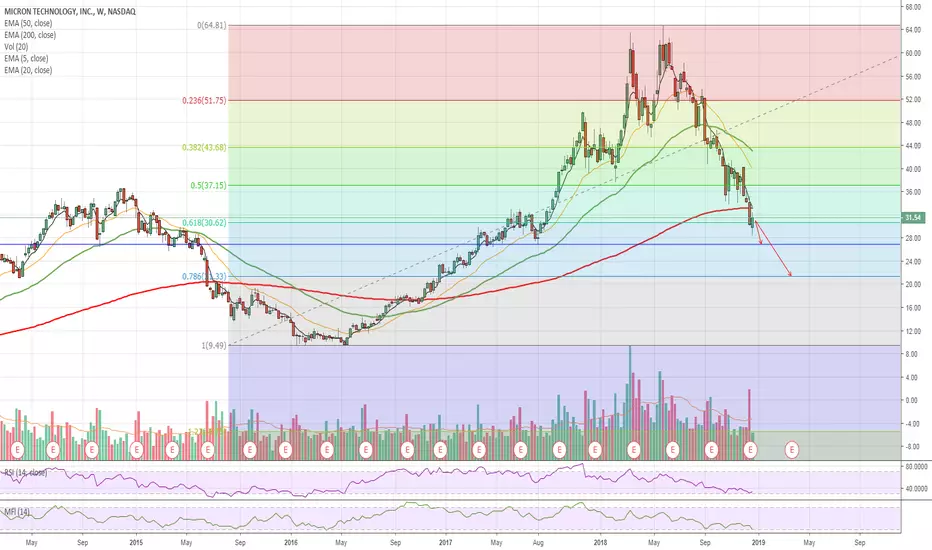
$MU Further to Fall - Bearish Options Activity$MU Micron - Some significant bearish put options activity yesterday far out in time contracts deep in the money.
- 15k $40.00 strike June'2020 put options traded vs OI under 2k for $18M in premium
- 10k $45.00 strike January'2021 put options traded vs OI of 4.1k for $16M in premium
If both trades were the same fund it's possible this was another diagonal calendar put spread similar to some others we've seen this week, buying the 2021 puts at the higher strike with higher delta and selling the 2020 puts at lower strike with lower delta. These creative variations of options strategies can be very interesting.
Looking at the long term weekly chart I see two possible targets assuming current downtrend continues:
Near term - $27.00 (by mid January)
Medium term - $21.50 (by next ER late March)
Note: Informational analysis, not investment advice.
$AAPL Short Covering Rally - Unusual Options Activity$AAPL Viewing today's bounce as a temporary short covering rally, as we were extremely oversold coming into today. As long as Apple has not broken through the downtrend line it's been riding since early November, I'm still bearish for the near term. See chart for a couple possible near term targets.
Adding to the bearish near term sentiment, we saw some significant January expiration put buying today with around 37k deep ITM contracts traded at varying strikes for total premium outlay of about $180M.
Note: Informational analysis, not investment advice.

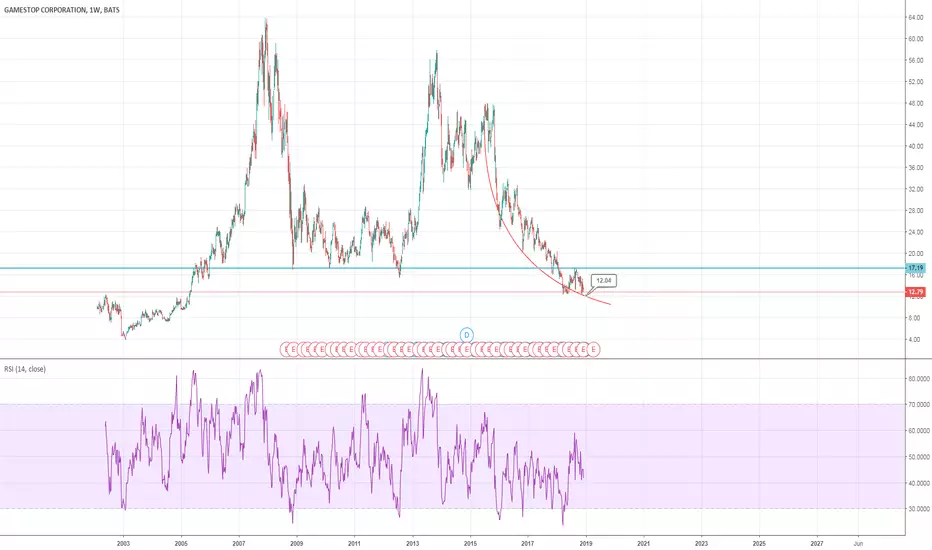
GME short opportunityThe brick and mortar video game model is becoming obsolete. GameStop now competes with titans like Microsoft, Sony, WalMart, Amazon, and online marketplaces offered by Steam and Nintendo. To further support the continuation of this trend is the recent decay of fundamentals. They have spun off their telecoms branch, removing a source of revenue diversification and have invested heavily into doubling their physical locations over the past year. Their guidance continues to disappoint and while they've maintained a decent D/E ratio compared to the industry they are taking on more long term debt in a rising rate environment. I believe the dividend will be impacted within the next 12 months unless a profound new strategy is deployed. There are rumors of a private equity buyout but no real developments have materialized since September 2018. RSI is far from oversold and previous support has recently become resistance. I would not short common as the borrowing rates are relatively high. Instead, I would structure options strategies to sell premium with a bearish bias.