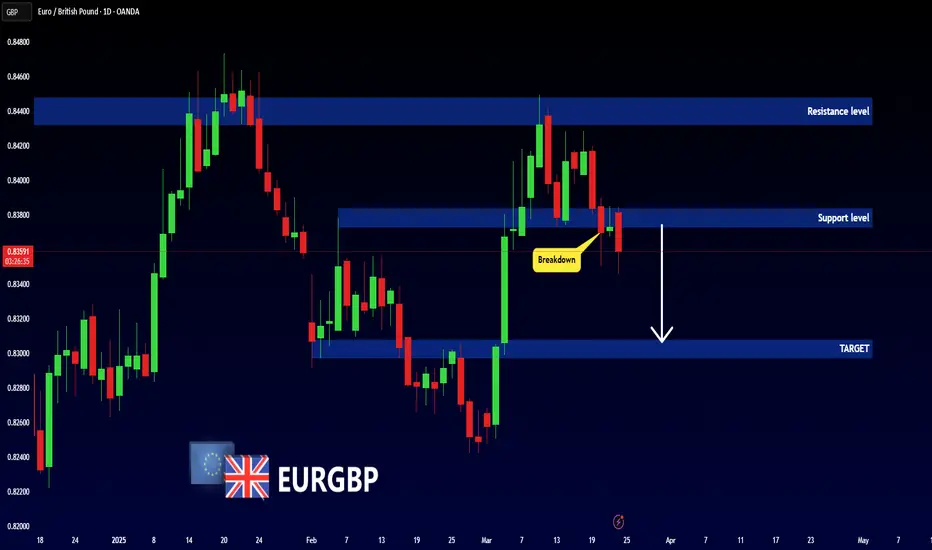
EURGBP - BEARISH MOVEHello Traders !
On Tuesday 11 March, The EURGBP reached the resistance level (0.84480 - 0.84322).
The price broke the support level (0.83732 - 0.83840).
This key level becomes new resistance !
So, I predict a bearish move📉
____________
TARGET: 0.83080🎯
Bearish Patterns
Bearish Outlook for ENA: Potential Downward TrendHello everyone! 👋
I hope you're all doing well. I wanted to share my thoughts on ENA and provide my perspective on the current market situation. Here's my outlook:
The price of this coin is exhibiting signs of weakness, suggesting it may face further downward pressure. Recent price action has broken through key support levels, while momentum indicators are pointing to a continuation of the prevailing downtrend.
If the broader market sentiment remains negative, we could see further declines toward the next major support zones. While potential rebounds are always a possibility, the overall trend currently appears to favor the bears.
Stay vigilant and manage your risk accordingly.
Best regards! BINANCE:ENAUSDT

NATGAS - NEW BREAKDOWNHello Traders !
On Monday 10 March, The NATGAS reached the resistance level (4.730 - 4.986).
Currently, The support level (4.368 - 4.218) is broken !
This key level becomes new resistance.
So, I expect a bearish move📉
______________
TARGET: 3.885🎯

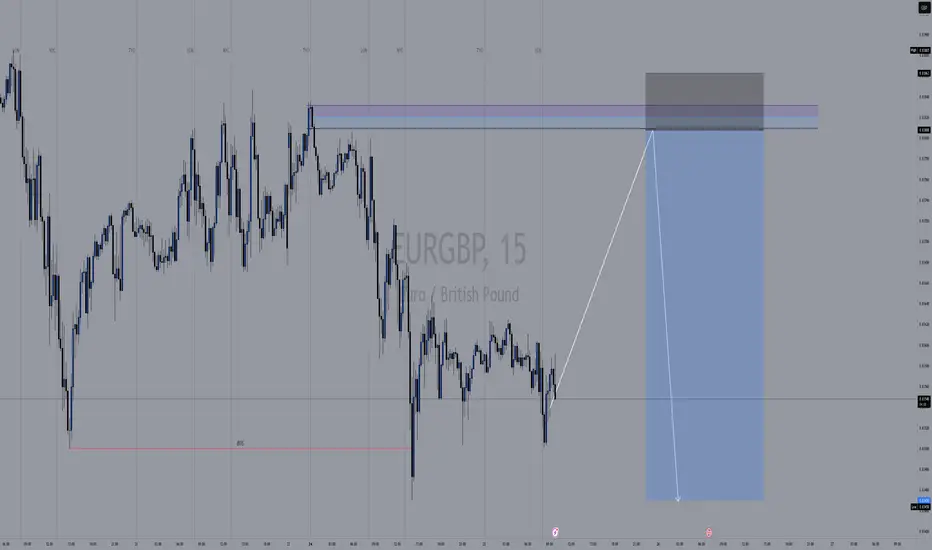
EURGBP SELLTracking EUR/GBP on the 15-minute timeframe, we see a potential short opportunity from a key supply zone.
Key Zones & Setup:
🟣 Bearish Order Block (Supply Zone): 0.83800 - 0.83830
This area acted as strong resistance, where institutional traders likely positioned sell orders.
Expecting price to push into this zone before reversing lower.
Break of Structure (BOS) on lower timeframes (M5/M1) is needed for confirmation.
🔵 Target Area (Demand Zone): 0.83450
If the supply zone holds, price could drop toward this key demand level.
This zone aligns with previous BOS levels and price reactions.
Trade Plan:
📈 Waiting for price to push into the supply zone (0.83800 - 0.83830).
🔎 Looking for BOS on lower timeframes (M5/M1) before shorting.
✅ Entering a sell position upon confirmation.
🎯 Targeting the 0.83450 demand zone.
⚠️ Stop-loss above 0.83830 to manage risk.
Market Outlook:
If price fails to break structure, we avoid shorts and reassess.
This setup follows smart money concepts (SMC) with a focus on BOS and order blocks.
💬 What do you think? Are you seeing the same setup? 🚀🔥
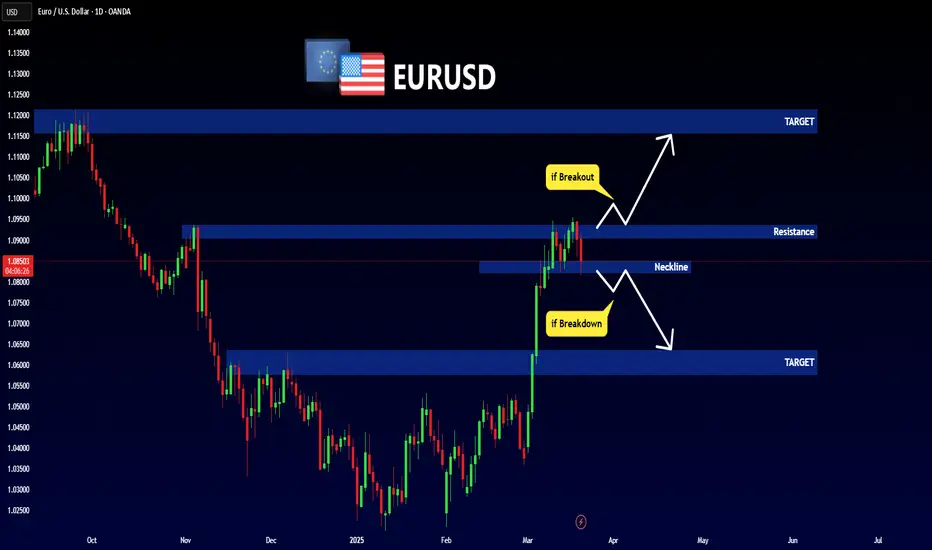
EURUSD - 2 ScenariosHello Traders !
On Tuesday 11 March, Th EURUSD reached the resistance level (1.09374 - 1.09058).
So, We have 2 Scenarios:
BULLISH SCENARIO:
If the market breaks above the resistance level and closes above that,
We will see a bullish move📈
TARGET: 1.11580🎯
BEARISH SCENARIO:
If the price breaks and closes below the neckline,
We will see a huge bearish move📉
TARGET: 1.06350🎯
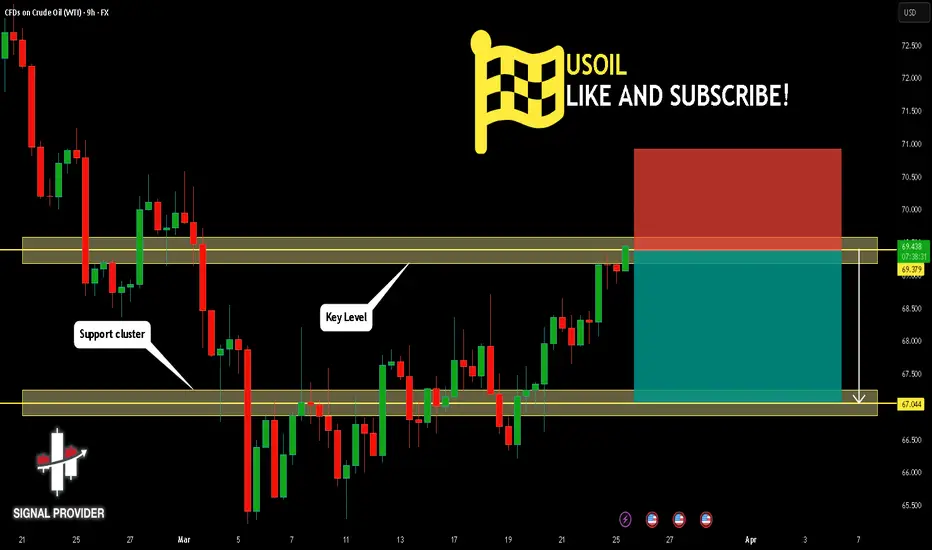
USOIL Is Very Bearish! Short!
Take a look at our analysis for USOIL.
Time Frame: 9h
Current Trend: Bearish
Sentiment: Overbought (based on 7-period RSI)
Forecast: Bearish
The market is on a crucial zone of supply 69.379.
The above-mentioned technicals clearly indicate the dominance of sellers on the market. I recommend shorting the instrument, aiming at 67.044 level.
P.S
Please, note that an oversold/overbought condition can last for a long time, and therefore being oversold/overbought doesn't mean a price rally will come soon, or at all.
Disclosure: I am part of Trade Nation's Influencer program and receive a monthly fee for using their TradingView charts in my analysis.
Like and subscribe and comment my ideas if you enjoy them!
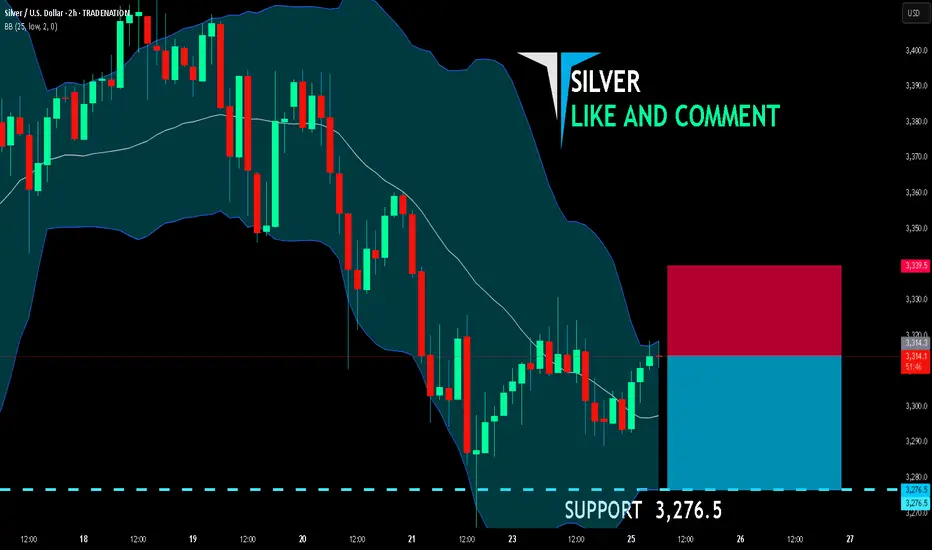
SILVER SHORT FROM RESISTANCE
SILVER SIGNAL
Trade Direction: short
Entry Level: 3,314.3
Target Level: 3,276.5
Stop Loss: 3,339.5
RISK PROFILE
Risk level: medium
Suggested risk: 1%
Timeframe: 1h
Disclosure: I am part of Trade Nation's Influencer program and receive a monthly fee for using their TradingView charts in my analysis.
✅LIKE AND COMMENT MY IDEAS✅
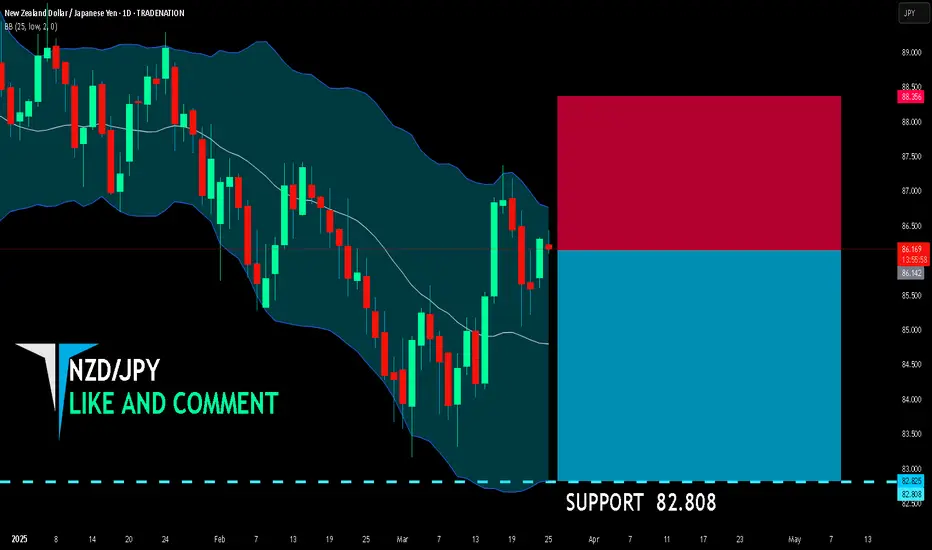
NZD/JPY BEARS WILL DOMINATE THE MARKET|SHORT
NZD/JPY SIGNAL
Trade Direction: short
Entry Level: 86.142
Target Level: 82.808
Stop Loss: 88.356
RISK PROFILE
Risk level: medium
Suggested risk: 1%
Timeframe: 1D
Disclosure: I am part of Trade Nation's Influencer program and receive a monthly fee for using their TradingView charts in my analysis.
✅LIKE AND COMMENT MY IDEAS✅
CAD/JPY SENDS CLEAR BEARISH SIGNALS|SHORT
Hello, Friends!
Previous week’s green candle means that for us the CAD/JPY pair is in the uptrend. And the current movement leg was also up but the resistance line will be hit soon and upper BB band proximity will signal an overbought condition so we will go for a counter-trend short trade with the target being at 104.075.
Disclosure: I am part of Trade Nation's Influencer program and receive a monthly fee for using their TradingView charts in my analysis.
✅LIKE AND COMMENT MY IDEAS✅

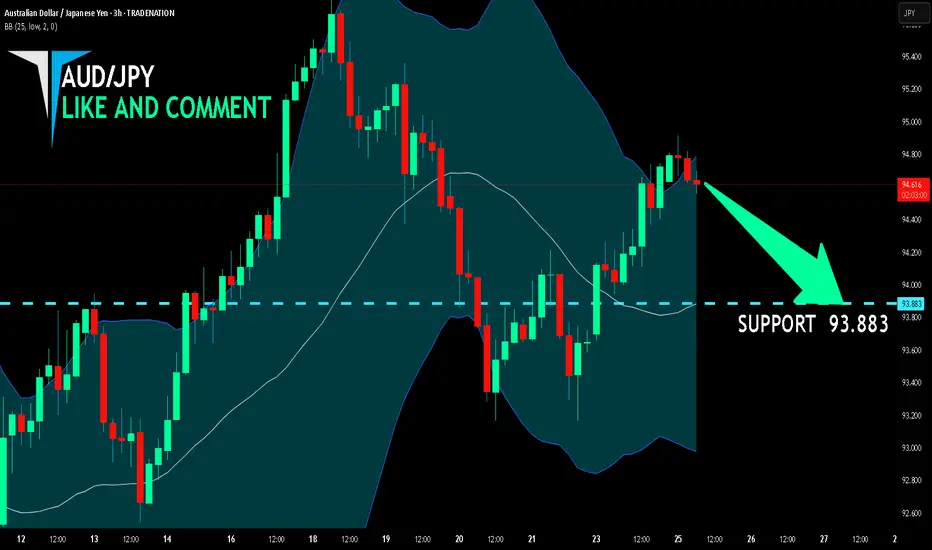
AUD/JPY BEARS ARE GAINING STRENGTH|SHORT
Hello, Friends!
AUD/JPY is trending down which is evident from the red colour of the previous weekly candle. However, the price has locally surged into the overbought territory. Which can be told from its proximity to the BB upper band. Which presents a classical trend following opportunity for a short trade from the resistance line above towards the demand level of 93.883.
Disclosure: I am part of Trade Nation's Influencer program and receive a monthly fee for using their TradingView charts in my analysis.
✅LIKE AND COMMENT MY IDEAS✅
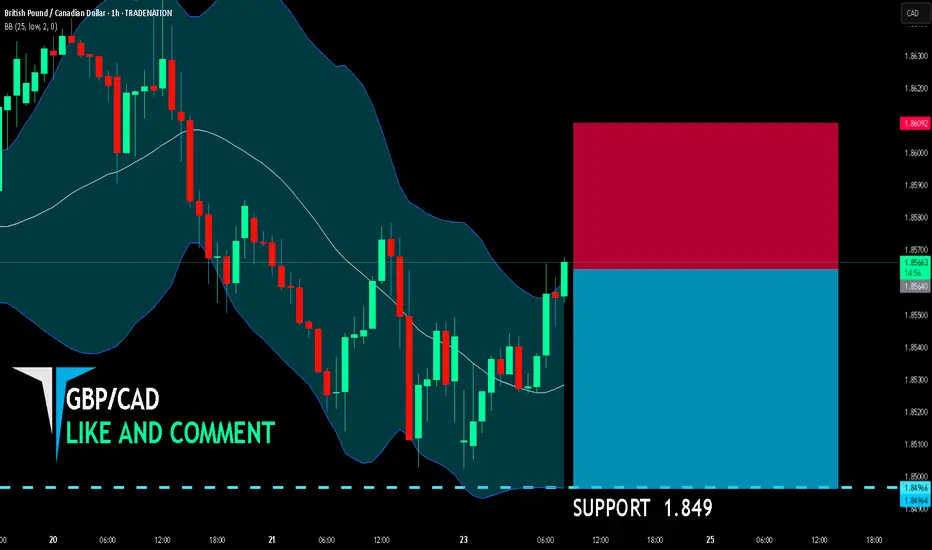
GBP/CAD BEARISH BIAS RIGHT NOW| SHORT
GBP/CAD SIGNAL
Trade Direction: short
Entry Level: 1.856
Target Level: 1.849
Stop Loss: 1.860
RISK PROFILE
Risk level: medium
Suggested risk: 1%
Timeframe: 1h
Disclosure: I am part of Trade Nation's Influencer program and receive a monthly fee for using their TradingView charts in my analysis.
✅LIKE AND COMMENT MY IDEAS✅
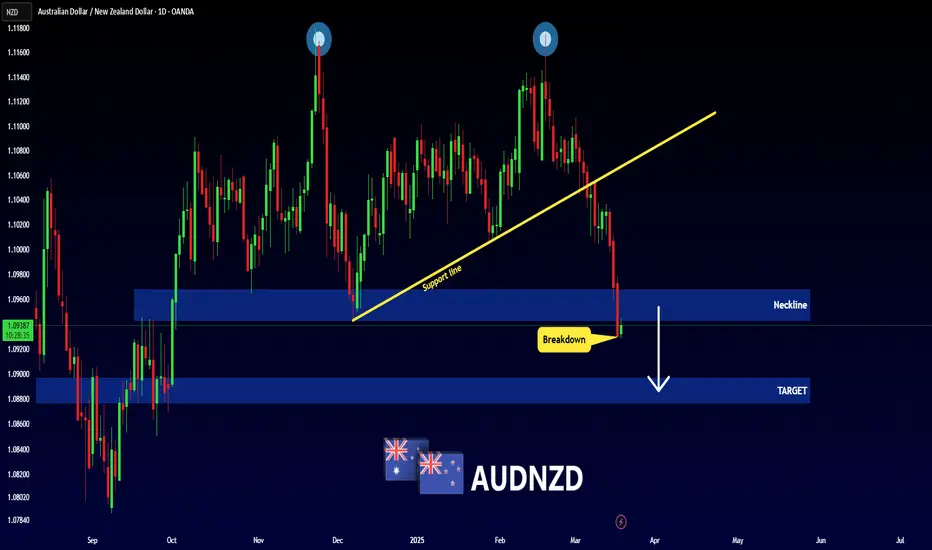
AUDNZD - Bearish Double TOPHello Traders !
The AUDNZD failed to create a new higher high !
The price formed a double TOP pattern.
Currently, The neckline is broken !
So, I predict a bearish move📉
_____________
TARGET: 1.08970🎯
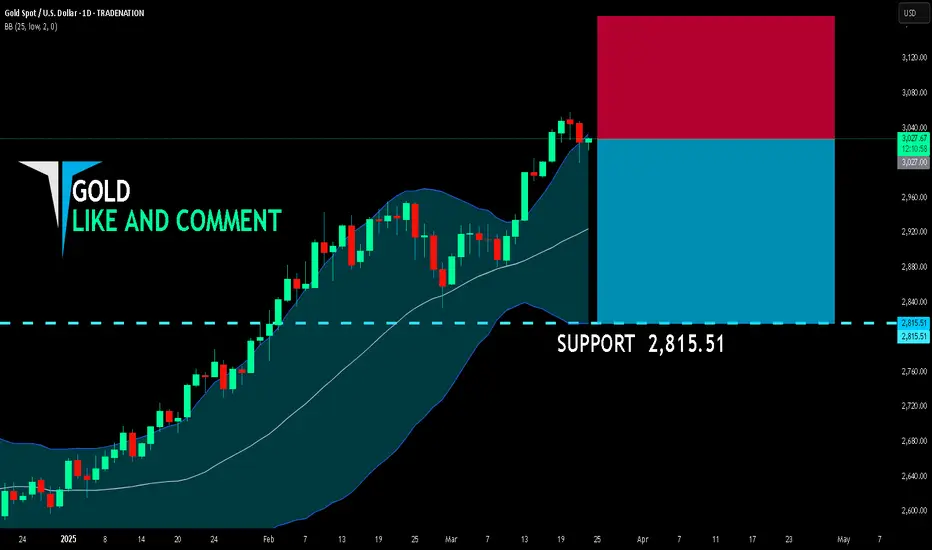
GOLD SELLERS WILL DOMINATE THE MARKET|SHORT
GOLD SIGNAL
Trade Direction: short
Entry Level: 3,027.00
Target Level: 2,815.51
Stop Loss: 3,168.26
RISK PROFILE
Risk level: medium
Suggested risk: 1%
Timeframe: 9h
Disclosure: I am part of Trade Nation's Influencer program and receive a monthly fee for using their TradingView charts in my analysis.
✅LIKE AND COMMENT MY IDEAS✅
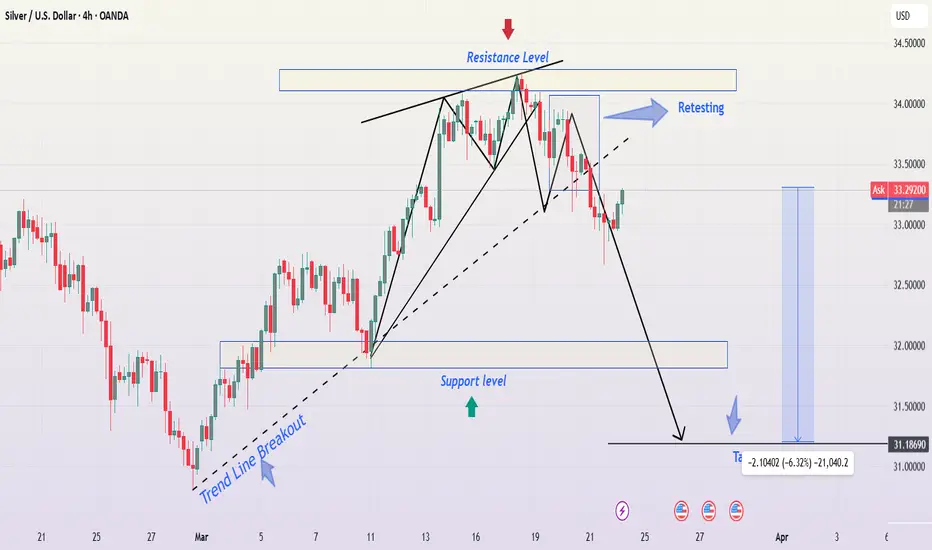
Silver (XAG/USD) – Rising Wedge Breakdown & Bearish Setup📊 Overview of the Chart
This 4-hour chart of Silver (XAG/USD) provides a classic example of a Rising Wedge Breakdown, a bearish reversal pattern. The price initially followed a strong uptrend, forming a series of higher highs and higher lows, but failed to sustain momentum at the key resistance zone (~$34.00 - $34.50). This led to a breakout to the downside, which has now confirmed a shift in market sentiment from bullish to bearish.
This analysis will break down each key level, the technical indicators supporting this trade setup, and how traders can approach it effectively.
🛠️ Breakdown of the Chart Components
1️⃣ Rising Wedge Formation (Bearish Pattern Identified)
The price action created a Rising Wedge, which is a bearish pattern characterized by an uptrend where the higher highs and higher lows start converging into a narrowing range.
This shows that while buyers were pushing prices higher, their strength was gradually fading.
The breakdown of this structure signaled a loss of bullish momentum, leading to a shift in trend.
2️⃣ Resistance Level & Sell Zone Identified
The resistance level at $34.00 - $34.50 has acted as a supply zone where sellers stepped in, preventing further upside.
A bearish rejection at this zone confirms that sellers are still dominant.
3️⃣ Retest of the Broken Support (Key Confirmation)
After the breakout from the wedge, the price made a retest of the broken trendline, a classic move before further downside.
Retesting this area confirms that it is now acting as resistance rather than support, further strengthening the bearish case.
4️⃣ Trendline Breakout – Shift in Market Structure
The dashed trendline was previously supportive, but now that the price has broken below it, it has turned into a resistance level.
This shift in market structure is a strong bearish signal.
5️⃣ Key Support Levels & Target Projection
The next major support level is at $32.00, a level where price previously found demand.
The ultimate target price is around $31.18, which aligns with historical support and Fibonacci retracement levels.
📉 Trading Strategy – How to Trade This Setup?
✅ Entry Point (Short/Sell Setup)
A good shorting opportunity arises if the price retests the resistance at $33.50 - $34.00 and shows bearish confirmation (like a rejection candlestick or a bearish engulfing pattern).
📍 Stop Loss (SL) Placement
SL should be above $34.20 to avoid getting stopped out by potential fakeouts.
🎯 Take Profit (TP) Levels
TP1: $32.00 (First support level)
TP2: $31.18 (Final bearish target)
📊 Risk-Reward Ratio
Entry at $33.50 - $34.00 with SL at $34.20 and TP at $31.18 provides an excellent risk-to-reward ratio (~1:4).
📌 Market Sentiment & Conclusion
🔴 Bearish signals are dominant, suggesting further downside potential.
📉 A strong bearish move is expected if the price fails to reclaim $34.00.
🎯 Targeting $31.18 in the upcoming sessions.
📢 Final Advice: Traders should watch for confirmation before entering trades. A successful retest and rejection at $33.50 - $34.00 will be a high-probability short setup. 🚀
🔥 Follow price action and risk management principles for a successful trade! 🔥
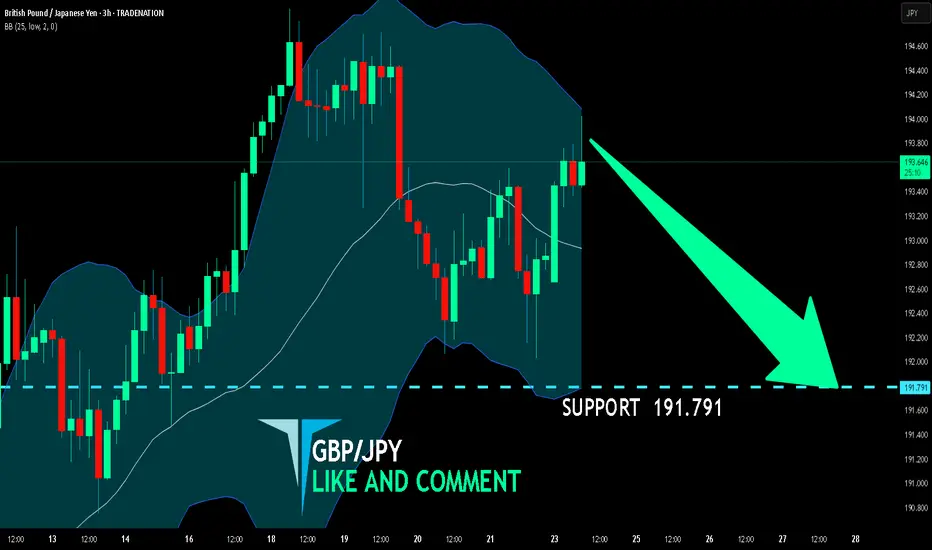
GBP/JPY BEST PLACE TO SELL FROM|SHORT
Hello, Friends!
GBP/JPY pair is in the uptrend because previous week’s candle is green, while the price is obviously rising on the 3H timeframe. And after the retest of the resistance line above I believe we will see a move down towards the target below at 191.791 because the pair overbought due to its proximity to the upper BB band and a bearish correction is likely.
Disclosure: I am part of Trade Nation's Influencer program and receive a monthly fee for using their TradingView charts in my analysis.
✅LIKE AND COMMENT MY IDEAS✅
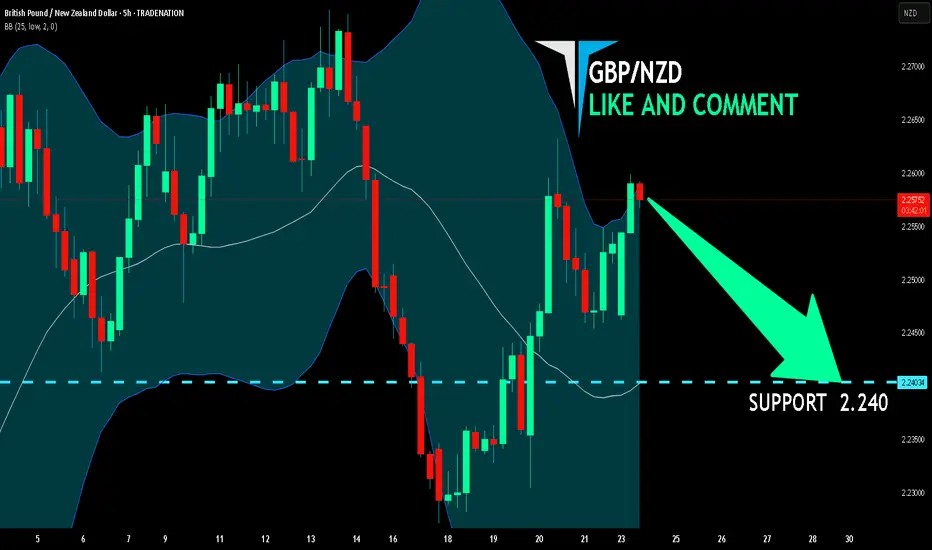
GBP/NZD BEARS ARE STRONG HERE|SHORT
Hello, Friends!
GBP/NZD pair is trading in a local uptrend which we know by looking at the previous 1W candle which is green. On the 5H timeframe the pair is going up too. The pair is overbought because the price is close to the upper band of the BB indicator. So we are looking to sell the pair with the upper BB line acting as resistance. The next target is 2.240 area.
Disclosure: I am part of Trade Nation's Influencer program and receive a monthly fee for using their TradingView charts in my analysis.
✅LIKE AND COMMENT MY IDEAS✅
BTC | 90K or 40KBTC is seemingly in the early days of a brand new bearish cycle.
This is somewhat surprising, since ETH did not make a new ATH - which has happened every single time in the past rallies.
The bounce zones I will be watching for the coming bearish cycle:

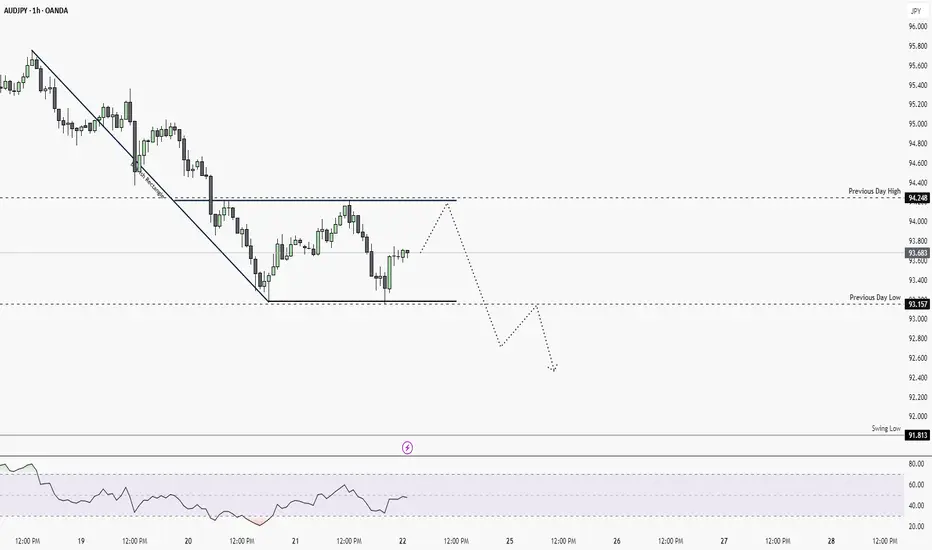
Will AUDJPY continue bearish trend? [Short Setup]Bearish rectangle is form on 1HR chart and there is no divergences. It's likely to continue bearish trend.
🔹When to Enter?
Enter in the trade when it retest it pervious day low which is 193.157. And target it to swing low, keep SL above pervious day low.
🔹 How to Take Trade?
- Only risk 1% of your portfolio
Like and subscribe to never miss a new idea! ✌🏼
USOIL SHORT FROM RESISTANCE
USOIL SIGNAL
Trade Direction: short
Entry Level: 68.25
Target Level: 65.67
Stop Loss: 69.99
RISK PROFILE
Risk level: medium
Suggested risk: 1%
Timeframe: 9h
Disclosure: I am part of Trade Nation's Influencer program and receive a monthly fee for using their TradingView charts in my analysis.
✅LIKE AND COMMENT MY IDEAS✅

BTC Dominance at Critical Level – Altcoin Rally Incoming?🚀 Hey Traders! 👋
If you find this analysis valuable, show some love by smashing that 👍 and hitting Follow for high-probability setups that actually deliver! 💹🔥
BTC Dominance Update:
We’re seeing a rising wedge formation on the daily timeframe—a classic bearish pattern. Right now, BTC.D is testing resistance, and if it rejects here, we could see an explosive Altcoin rally! 🚀
📉 Breakdown = Altseason incoming!
🚨 Invalidation: A break and close above 62.5 would cancel this setup.
What do you think about this? Let me know in the comment section.
👉 Stay ahead of the game! Follow us for real-time updates and pro-level trade setups. Let’s dominate the markets together! 💪🔥

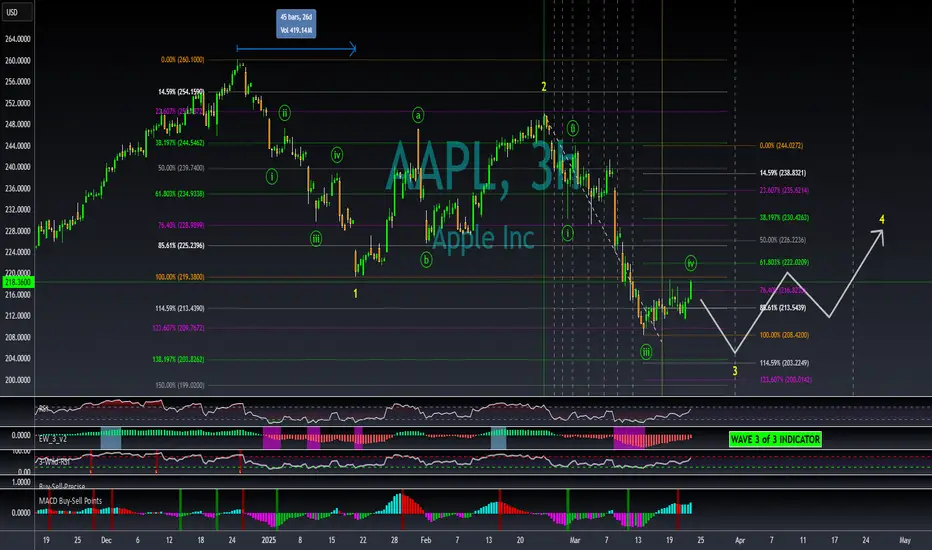
Will AAPL temporarily go below 205 this week?My overall thesis is we are in the very early stages of a multi-year decline ultimately with the S&P 500 below 3500. I have been wrong many times before so I will just take this thing in stages and see if it plays out. After this massive decline, we should be in for a great market rally of many decades. While the market has seen a brief rally, the primary question is when will the rally end? Friday turned in mix answers to that question. The next step in my opinion will be a decline, possibly sharp with a quick bottom in some sectors AHEAD of the reciprocal tariff deadline on April 2.
My wave 3 indicator tends to signal wave 3s and 3 of 3s with additional end of wave (overbought/sold) conditions. See my scripts for the specifics of the indicator. It currently signaled 3 of 3 based on the bottom in mid-March meaning another drop is likely soon.
While the other stocks I have studied mainly topped at all-time highs in mid to late February, AAPL topped at the end of 2024. The movement of AAPL may be a leading indicator of future market movement as the market appears to be trading as a micro wave structure inside of AAPL's more macro movement.
My market expectations are for their first semi-major wave 1s to end within the next few weeks. Each wave 1 will be followed by a multi week wave 2 up. AAPL may end its wave 3 structure (yellow 3) when the others finish their wave 1s. AAPL would then experience wave 4 up, when the other stocks and S&P 500 index experience their second wave.
This chart applies select movement extensions based on wave 1's movement on the left and then another based on wave 3's movement on the right. I keep the values between 0%-100% on the chart for wave 2s and 4s retracements of the preceding wave's movement for reference even though the retracement values would be inverted.
I will refer to the yellow waves a Minor waves and the green as Minute waves. The extension/retracement data on the left is based on Minor wave 1's movement and is applicable to Minor waves 2 and 3. It provides a rough location of levels for Minor wave 3 to end. The extension on the right attempts to determine Minute wave 5's end points based on Minute wave 3. An intersection of Minor wave 1 extension levels and Minute wave 3 extension levels are general targets for bottoms. One of these is between 203-204 for AAPL.
Lastly, I apply similar levels to determine Minor wave 3's length based on Minor wave 1's length of 45 bars (on the 3 hour chart). Minor wave 3 is currently longer than 45 bars. The vertical dashed bars provide similar locations with the next vertical bar occurring on the morning of Monday March 31. I am therefore watching to see if the next bottom for AAPL occurs at this time.
If this bottom truly comes into focus, I will then attempt to forecast Minor wave 4 for AAPL which could occur in late April.
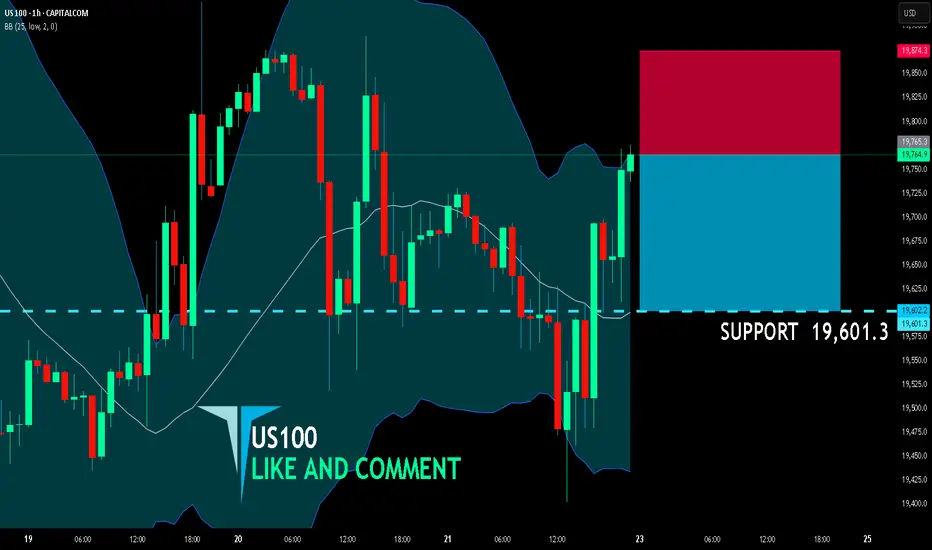
US100 SENDS CLEAR BEARISH SIGNALS|SHORT
US100 SIGNAL
Trade Direction: short
Entry Level: 19,765.3
Target Level: 19,601.3
Stop Loss: 19,874.3
RISK PROFILE
Risk level: medium
Suggested risk: 1%
Timeframe: 1h
Disclosure: I am part of Trade Nation's Influencer program and receive a monthly fee for using their TradingView charts in my analysis.
✅LIKE AND COMMENT MY IDEAS✅
GBP/CHF BEARS ARE GAINING STRENGTH|SHORT
Hello, Friends!
Previous week’s green candle means that for us the GBP/CHF pair is in the uptrend. And the current movement leg was also up but the resistance line will be hit soon and upper BB band proximity will signal an overbought condition so we will go for a counter-trend short trade with the target being at 1.126.
Disclosure: I am part of Trade Nation's Influencer program and receive a monthly fee for using their TradingView charts in my analysis.
✅LIKE AND COMMENT MY IDEAS✅
