Betting on TSLA Dumping Today In The After HoursWe are at the PCZ of a Bearish ABCD and showing bearish divergence after hours will likely be a drop. I got puts before the close.
Bearishdivergence

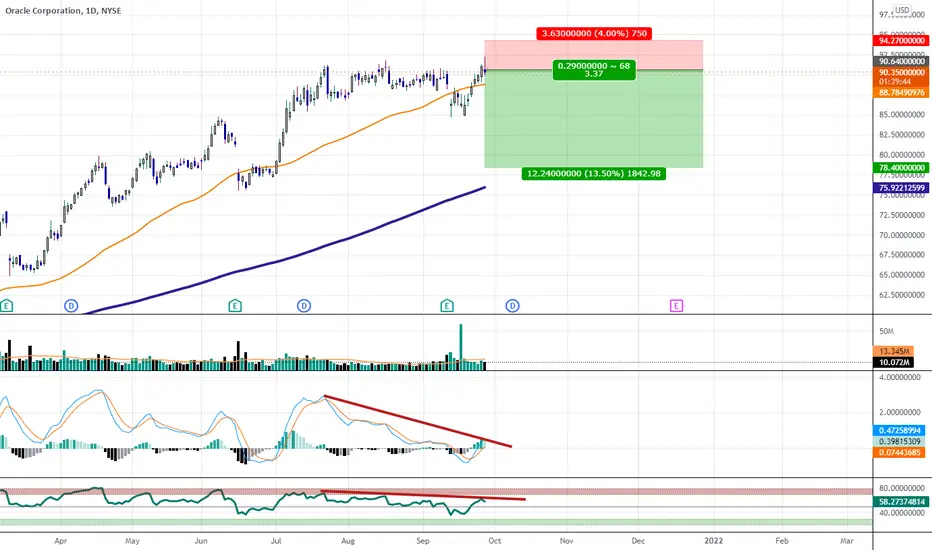
Shooting Star Bearish Reversal Pattern Visible on the DailyIf the daily closes like this that will be a confirmed Shooting Star Candlestick Reversal Pattern visible on the daily and that will be a signal for future downside. Of course the market hasn't closed yet and this is simply and aggressive early entry into this potential future position.
I think we will make about an 80 percent retrace or test the 200 day moving average as a bearish target.
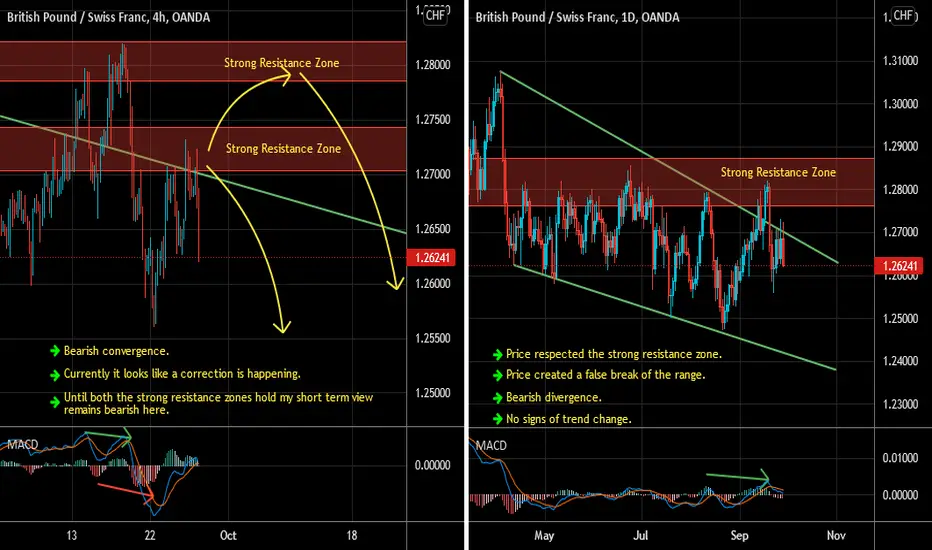
GBPCHF Intraday Sell IdeaD1 - Price respected the strong resistance zone.
Price created a false break of the range.
Bearish divergence.
No signs of trend change.
H4 - Bearish convergence.
Currently it looks like a correction is happening.
Until both the strong resistance zones hold my short term view remains bearish here.
Bearish 5-0 Looking To Break Down Below The 4HR 55 SMAWe have a Rising Wedge and Bearish Divergence on the MACD after rejecting the PCZ of a Potential Bearish 5-0; I will be looking for a big correction from here.

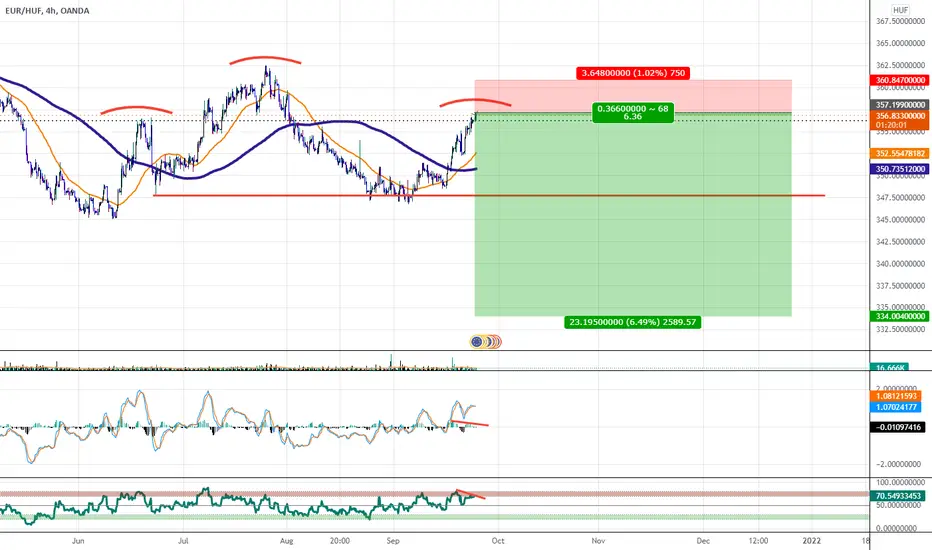
EURHUF Right Shoulder Short Entry At 200 Moving AverageWe have a bearish MACD crossing with bearish divergence on both the RSI and MACD at the area of a potential right shoulder to a head and shoulders pattern and the 200 moving average.
USDJPY 4H reaching the important yearly resistancesUSDJPY 4H reaching the important yearly resistances. A short opportunity is likely to emerge on weak candles at resistance or a recent bull candle break which will lead to test the recently broken trendline. Some of the oscillators and relative strength against DXY have initial indications of bearish divergence.

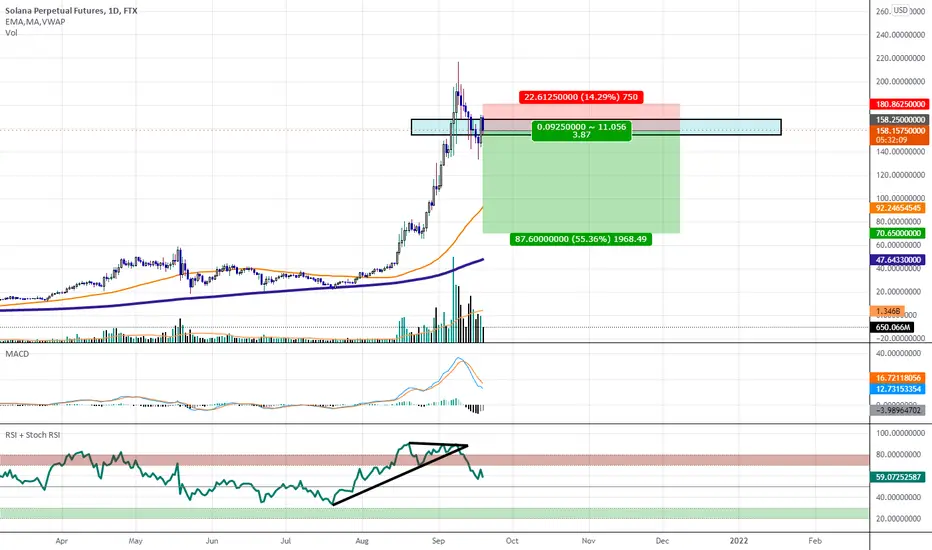
Solana hurdles to overcomeIf I'm being bullish - which in the long term I am for Solana - I could see this as a buying opportunity here.
What needs to happen in my opinion:
- 21MA (blue) needs to cross over 50MA
- Price needs to break golden pocket
- Price needs to break strong support zone
What could signal a turn for worse:
- Price currently below golden pocket & strong support zone
- 50MA could cross below 21MA
- MACD showing bearish divergence on its lagging line
What are you betting on?

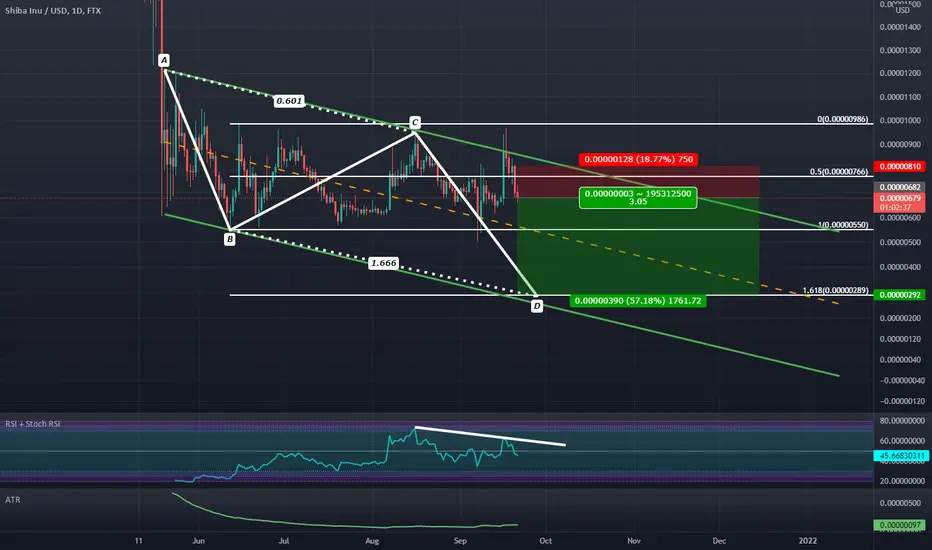
Early C Short Entry to the 1.618 Retrace BelowI think Shiba will bullishly reverse at the PCZ of Bullish ABCD but as of now i will like to try to enter before it potentially completes the rest of the wave. Stoploss above the bearish engulfing candle of this potential double top.
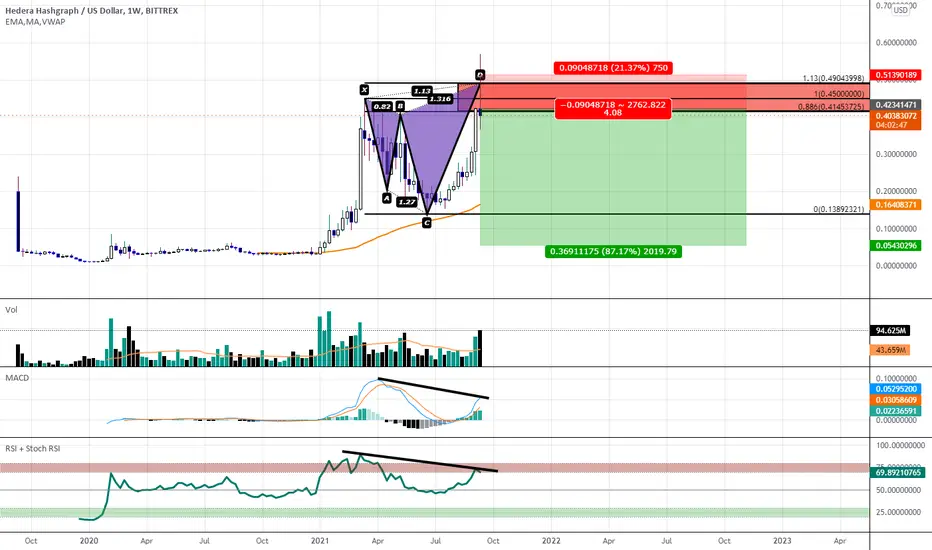
Bearish Weekly Shooting Star at PCZ of Bearish Shark on HBARUSDBeen a long while since i seen a shooting star pattern like this on a weekly chart but here we are the next few weeks are bound to be interesting if the weekly closes like this tonight.
Solana Attempting To Breakdown Through A Point Of ContentionThe zone i have highlighted on the chat is the range between the top and bottom of a high volume daily doji and we're overbought on the weekly showing bearish divergence on the RSI while on the daily RSI we are breaking down after being overbought; If we break below the zone i have highlighted then i expect to see a huge move down to the moving averages.
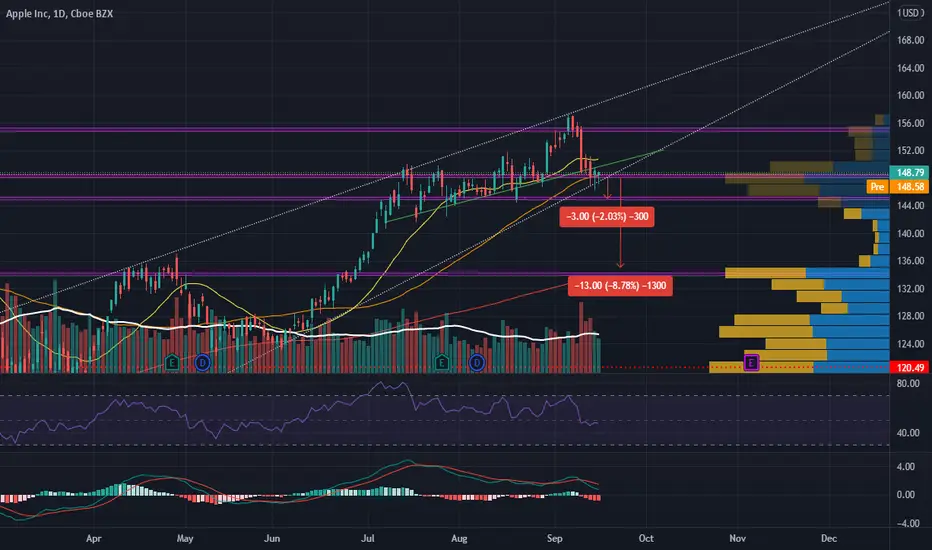
Bearish Sentiment on $AAPLRecent News - Apple reloads its stock with "new products" which aren't so new but with a higher price tag (Bearish). Epic Games v Apple (Bearish). Losing the fourth Apple car exec this year (Bearish). Quad Witching Sept 2021 (Leaning Bullish).
Trend - We're just coming off a bullish trend that helped us reach an ATH of $157.26. We broke that trend with a strong pullback from ATH with the Judge's ruling over Apple's in-app purchases. We're also still in this wedge pattern, which I believe we'll break from it within this month (hopefully next week).
Candles/Volume - We saw three wide body candles with strong, above average volume to validate them. We currently have two hammers with average volume which indicates that the buyers are holding at the ~$148 support level (could possibly be a reversal - volume makes me think not). I can see the buyers becoming exhausted and the price dropping down to the next support level of ~$145. If by chance the buyers don't step in at that price or they become overwhelmed, we can easily see the stock drop -8.78% from ~$148 to ~$135.
MA - The 200 MA has also be a previous strong support. Which it would currently fall at ~$135 if the market decided to pull back.
RSI - Starting up from July 7 to present. There is a bearish divergence on the RSI.
MACD - I believe it's just starting to pickup momentum with the signal line already having crossed over the MACD line. We also see a bearish divergence with the MACD, just like we saw with the RSI.
Constructive criticism would be appreciated.
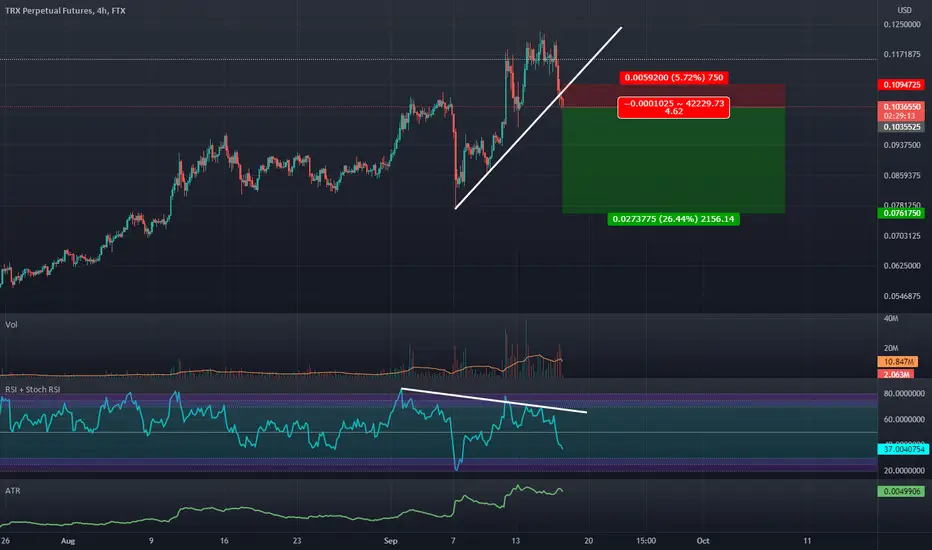
Time To Go Down To The Oversold Zones On The RSI: Trend BrokenTRX has just broken trend and looks to want to get to oversold on the RSI, The quickest and easiest way to do that would be for it to dump from here put your stop 1-2ATRs above entry
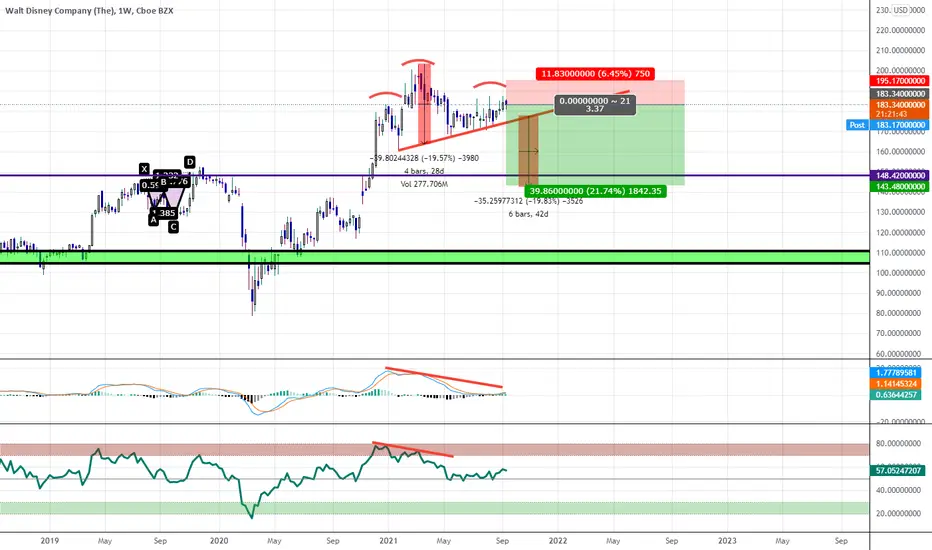
Disney Head and Shoulders Potential Right Shoulder Puts EntryComcast recently reversed off a bearish signal, perhaps Disney will be next given that they are in the same sector.
AAPL Bearish DivergenceThe price of aapl has been rising this past few weeks, mean while the RSI indicates a descending channel. This shows bearish divergence. If we get a breakout on the channel then this would be bullish but for now it seems bearish.

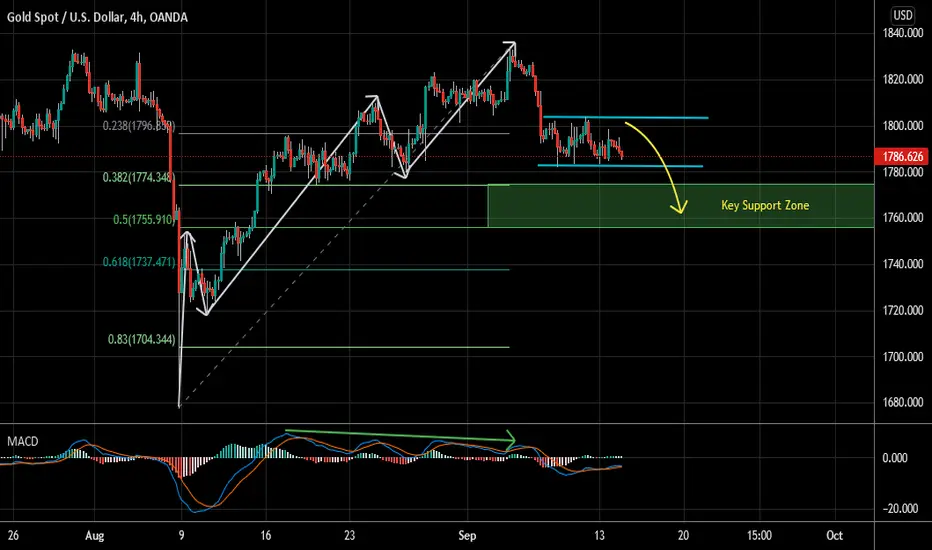
Gold Short Term Sell IdeaH4 - Triple wave to the upside which ended with a bearish divergence.
Currently it looks like a correction is happening.
After the first leg to the downside, it looks like a flat correction is happening in the form of a range now.
Until the top of this range holds my short term view remains bearish here and I expect the price to move lower towards the key support zone formed by the 38.2% - 50% Fibonacci retracement zones of the triple cycle.
Walmart May Pullback a Little Due To Litecoin Disappointment After the Litecoin situation there maybe a bit of a pullback in WMT itself due to the amount of hype it got this morning before the news was proven false.

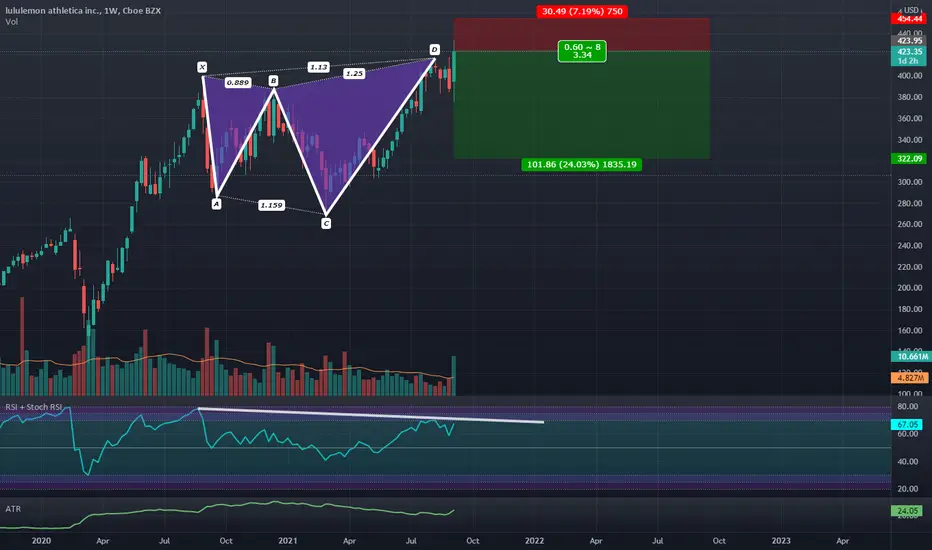
Bearish Bat Visible On The Monthly This one's kinda simple and not much thought goes into the entry just shorting at the PCZ because i want something to short.

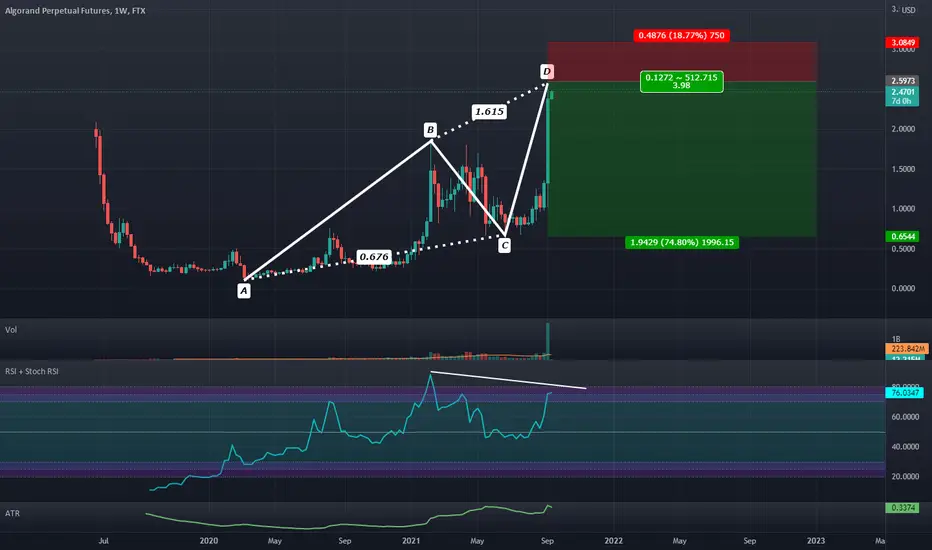
Bearish ABCD Pattern Is Nearing CompletionWe are Near a 1.618 Retrace which will be the PCZ of our ABCD Harmonic here and i'm actually not sure if it will be strong enough to actually hit it but if it does that will be a very nice place to catch the reversal.
Bearishly Engulfing The Weekly At Critical Levels: SPX Update #3I have been tracking this channel for awhile and giving occasional updates on the price action within it and i am seeing that we bearishly engulfed the weekly at the top of the channel as bearish divergence continues this may signal that this would be the last week we see any sort of attempt to achieve higher highs for a long time.
Additionally we are at a 1.618 Fib extension so this would be the perfect area to reverse from.

Bearish Divergence Between the 786 and 886 RetraceI think that we should look for a bearish reversal between the 78.6% and 88.6% Retracement and that we will fill 1 or 2 of the gaps below.

Monthly Put Options Play: Monthly Partial-RiseBABA seems to have completely broken it's trend and looks to be preparing to reverse back down to where it started i think in the next few months you will certainly see BABA below $145 and worst case scenario it will go back to the 60s.

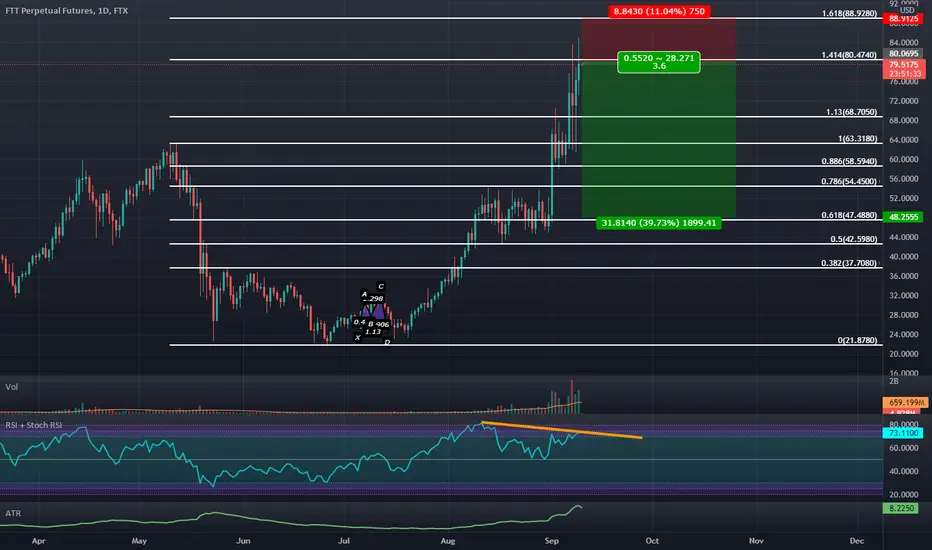
Bearish Divergence at a 1.414 Daily Fibonacci ExtensionI would like to see FTT undo all of it's gains it's gotten over the last couple of weeks before thinking of entering a bullish position on this one again.
Bearish Shark May Be Looking To Trap A lot of Bulls.We have a Bearish Shark visible on the Weekly with Bearish Divergence and a Huge Spike in Weekly Volume after an extreme upside Breakout. I never heard of this stock before and i hardly know what they do but just looking at it tells me that there are a lot of bulls betting for more upside up here and that any amount of selling below the breakout zone can easily lead to a very steep decline.