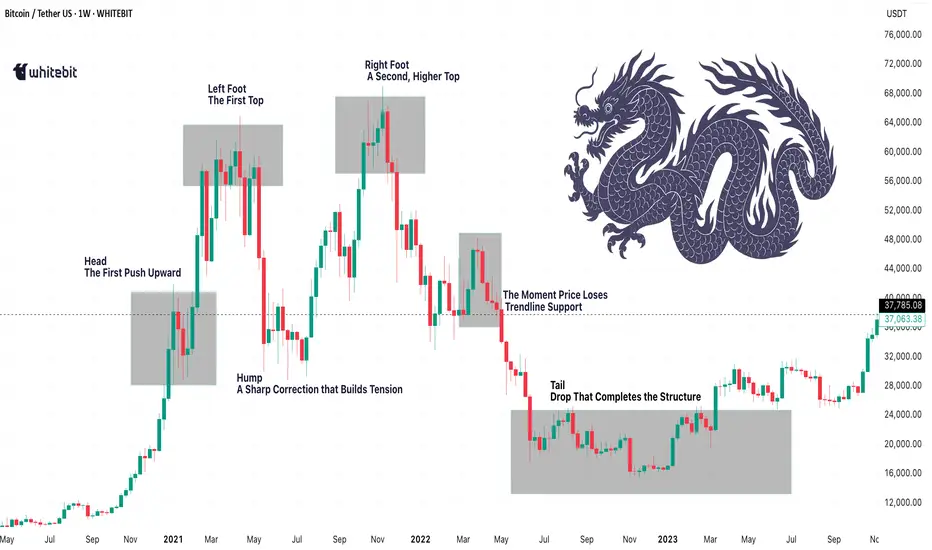
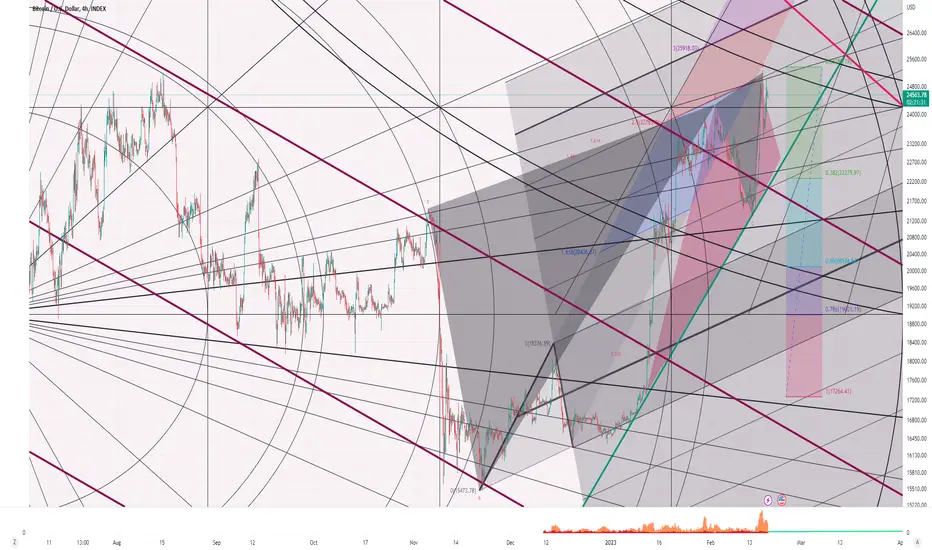
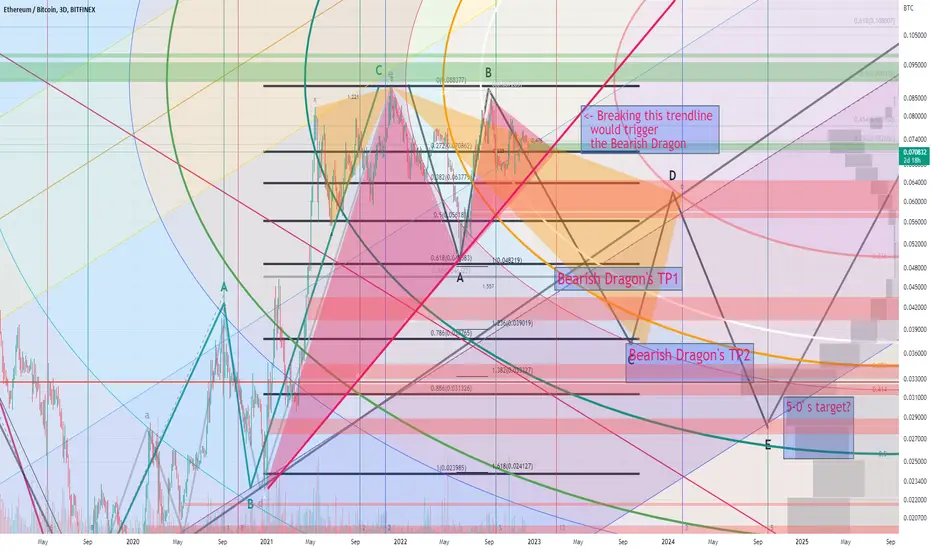
Double Top or… Bearish Dragon?Hello, Traders!
An anatomy of market psychology on the BTC chart…
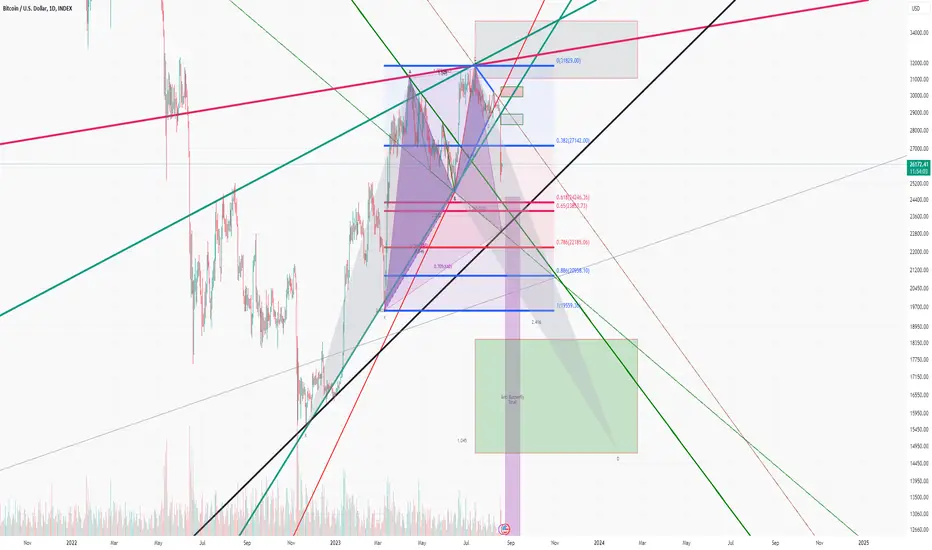
Sometimes it’s not about what’s next, but what we've already lived through. And this stretch on the Bitcoin (BTC) weekly chart (2021–2022) deserves a second look. What first appears to be a textbook Double Top might, with the right lens, reveal something more… mythical. Let’s break it down 👇
🔍 Double Top: The Obvious Story?
If you zoom in on BTC’s two major peaks — around $64K in April 2021 and $69K in November 2021 — it checks all the boxes: two high points, a clear support line around $30–32K (neckline), and eventually a breakdown that confirmed the pattern. Classic reversal, right? Yes — until you realize it wasn’t just flat repetition, but a structure with more texture and rhythm. This is where the concept of the bearish dragon pattern comes in.
🐉 The Bearish Dragon Trading Pattern
While not part of traditional TA textbooks, the dragon pattern trading model has gained popularity for its ability to capture more nuanced market psychology. In the bearish dragon trading pattern, we get:
Head → The First Push Upward (early 2021)
Left Foot → The First Top
Hump → A Sharp Correction that Builds Tension
Right Foot → A Second, Higher Top (bait for breakout traders)
Entry → The Moment Price Loses Trendline Support
Tail → The Dramatic Drop That Completes the Structure
In this example, BTC followed that script frighteningly well. And while this wasn’t a bullish dragon pattern trading setup (the bullish version mirrors this shape), it still serves as a valuable case study in how these visual patterns capture trader behavior in real time.
⚙️ So What?
Identifying a dragon trading pattern isn't just for artistic flair. These kinds of models reflect moments of emotional whiplash: fake-outs, fear, FOMO — all in one motion. This chart is a masterclass in how structure, sentiment, and supply zones align. And guess what? Even though this pattern completed long ago, some of the zones still matter today — as support, as resistance. Price memory is real. And dragons? Well, they leave footprints. ;)
📉 The Classic: Is It Just a Double Top?
Let’s start with the obvious interpretation. What we see on the BTC chart between April and November 2021 checks almost every box of the well-known Double Top — one of the most cited reversal patterns in technical analysis. It’s the kind of formation you’ll find in every trading textbook: two peaks at roughly the same level, separated by a mid-point correction (the "valley"), followed by a breakdown. And in theory, here’s how it plays out.
The first peak, in this case, around $64,000 in April 2021 shows strength, momentum, and enthusiasm. Then comes a pullback which, at first, looks like a healthy correction. Price drops to around $30,000, consolidates, and many consider it a buying opportunity. The second peak, in November 2021, climbs even slightly higher to around $69,000, but this is where things start to feel different. Momentum is weaker. Volume thins out. Retail interest is still there, but it’s more cautious. The hype feels forced.
And then the real turning point. The market loses its footing around $30–32K. That level, which previously acted as strong support, gets broken in early 2022. Not just tested, broken cleanly.
From a purely technical standpoint, that’s the moment the pattern is confirmed. A classic neckline break and with it, the implication that the uptrend is over, and a deeper reversal is underway. In traditional TA, this would be the textbook entry for a short trade, with a target roughly equal to the height from the peaks to the neckline. For BTC, that implied a drop well into the teens. And that’s exactly what happened.
So is this just a clean Double Top and nothing more? Maybe. The pattern fits. The breakdown was real. The projection played out.
What Do You See?
Yeah, this move is behind us, but sometimes it's worth going back to the dragons of the past. Do you see a clean Double Top here or a full-blown Bearish Dragon ready to bite? 🐲 And have you ever used the dragon pattern trading or dragon trading pattern concept in your analysis? Let’s talk patterns in the comments 👇
Bearishdragon
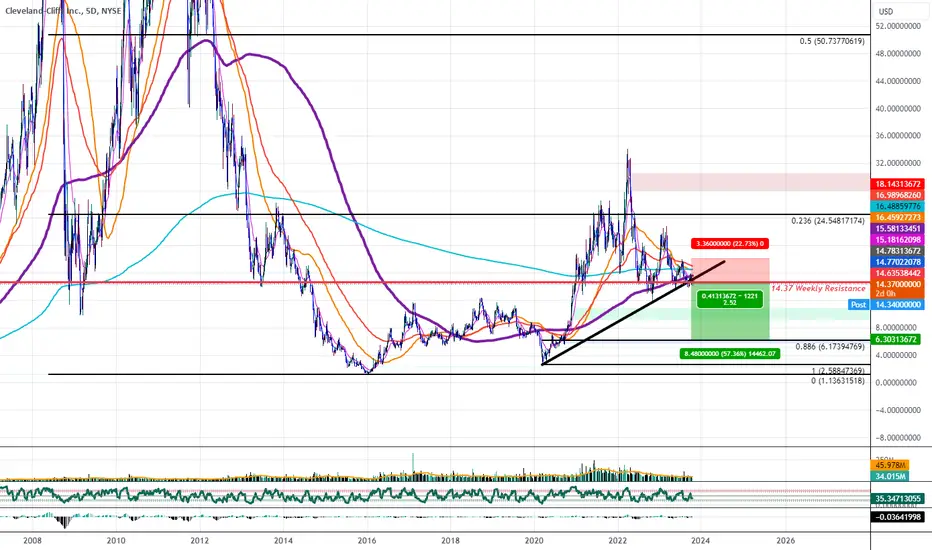
Cleveland-Cliffs: Bearish Dragon Below Resistance and 200 SMACLF has confirmed the breakdown of a Bearish Dragon and has tested the 200 SMA and the Weekly Support Resistance Level of $14.37 as Resistance again.
Now I am going to be looking for CLF to come down to make a 0.886 retrace from here, which should take it down to about $6.5 as it completes the Bearish Dragon
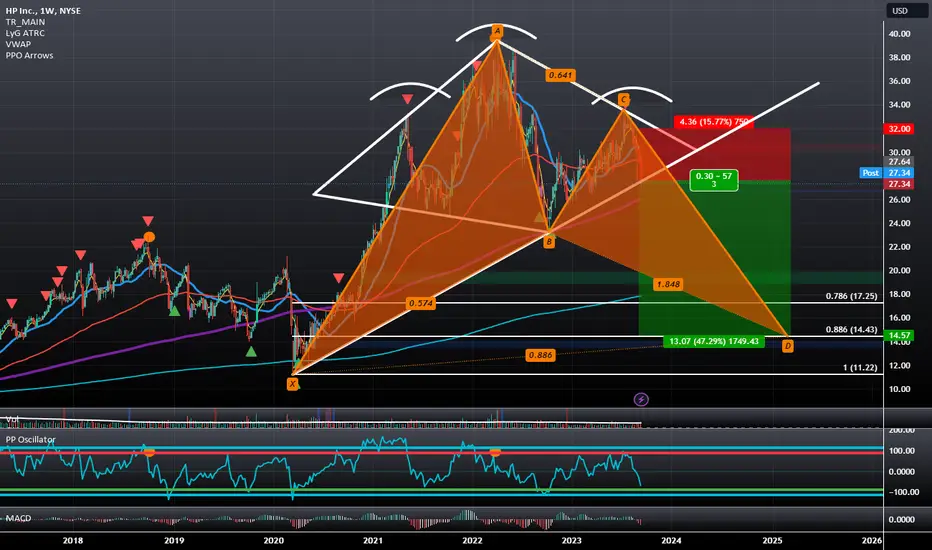
HPQ: Bearish Head and Shoulders, Diamond, Dragon, and BAMM ComboHewlett-Packard, after making five macro waves up, has formed a Bearish Structure that can only be described as being a hybrid between a Diamond and a Head and Shoulders pattern, and along with that, it is also a combination of a Bearish Dragon and Bearish BAMM.
All of this is happening after HPQ faced rejection off of the PCZ of a Bearish Crab going into its 5th wave.
Here is a screenshot of the zoomed out chart that showed the biggest macro wave structure that is on the chart and where all of this is happening:
Bearish Dragon Pattern UnfoldingA bearish dragon pattern is detected that could, in this case, develop into a bullish anti-butterfly.
The theoretically expected target is Fib .786 (approx. 22.9k), but the trendline would interfere with this process. So the modified immediate target is Fib. 65 (approx. 23.9k).
However, if BTC makes such a new low on the daily timeframe, Elliott-wise 5 wave reading is possible. It means after a rebound, a further downside is expectable.
My automated script has already suggested a green box as the target, the bottom of which is approx.14.8k. Although my view is still more bearish, such a decline will form a Navaro 200-harmonic pattern that has reasonable double-bottoms.
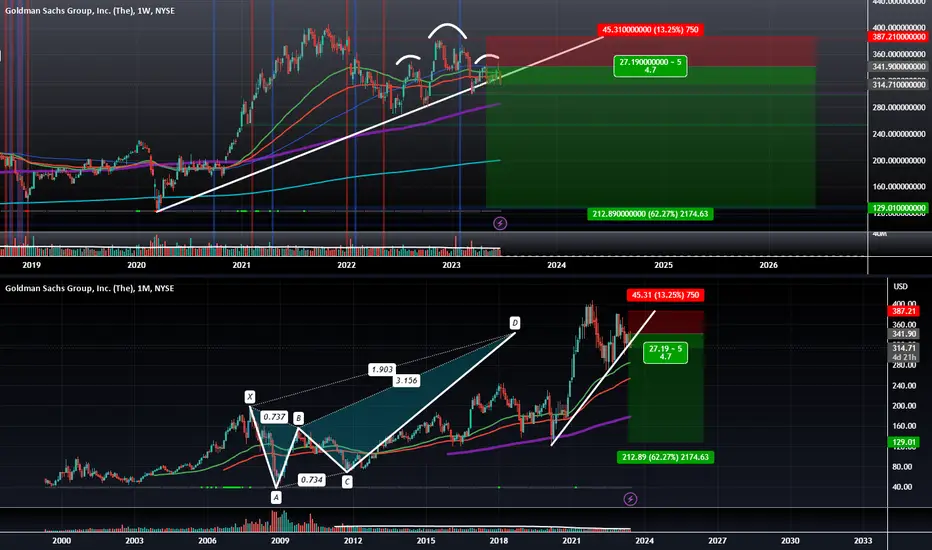
Goldman Sachs: Head and Shoulders at a Bearish Butterfly PCZThere is a Head and Shoulders pattern that has formed at the PCZ of a Bearish butterfly; it is also breaking down the trend line of a Bearish Dragon and the likely target seems to be $129.
Commonwealth Bank of Australia is Setting Up to Decline Over 77%CBA, Australia's Biggest Bank, is currently breaking down below a trend line after previously confirming Bearish Divergence on the monthly MACD and RSI, and the nearest strong support level is all the way down at around the levels of $40–$22.
This may be the ultimate sign that we are about to see a significant greater move down of the global financial sectors sooner rather than later.
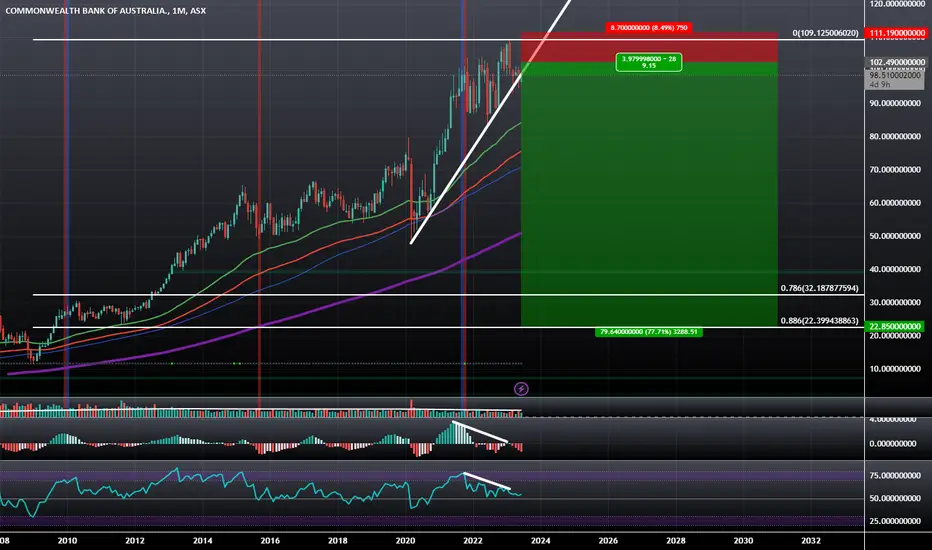
ASX-200: Weekly Dark Cloud Cover and Head and ShouldersThe ASX200 has printed a Dark Cloud Cover visible on the weekly chart within the Potential Right Shoulder of a Head and Shoulders pattern as it breaks down below a Bearish Dragon Trend Line as the RSI enters the Bearish Control Zone. All of this data put together leads me to believe that it will experience some significant bearish price action in the future and that it could go all the way down to the 800-Week EMA.

The Ultimate Destruction of Ethereum NearsETH right now looks to have formed a Logscale Bearish Dragon on the Monthly and right now is showing Weakness at Resistance if it breaks down this Bearish Dragon we will see it come to the 0.618 Retrace below as a target one for the Bearish Dragon but this could also lead to a Log Scaled Bearish Bat Action Magnet Move down to the 0.886 Retrace.
I believe Money will move out of ETH and into coins like Litecoin, RVN, HBAR, among a few others.

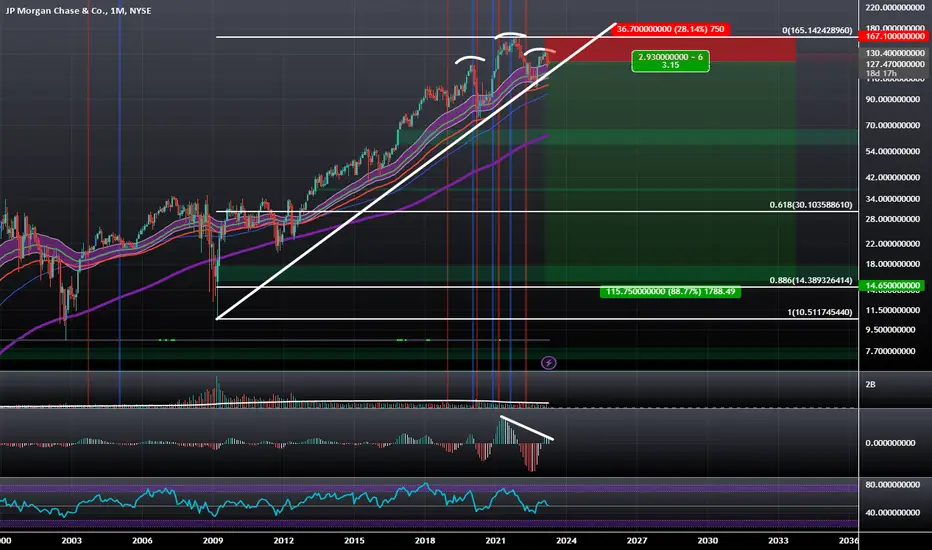
JP Morgan HnS Dragon with Bearish ConvergenceJPM after Bearishly Engulfing on the Monthly has formed a bit of a Head and Shoulders pattern while at the sametime forming a Bearish Dragon with some MACD Bearish Convergence as the RSI enters the Bearish Control Zone if price continues to do what it's doing i could see JPM making a full 0.886 Retrace.
Harmonic sequences: Cypher or Shark expected
BTC tried the Gann Square's arc and stagnated there for a while - the chart is developing precisely as we predicted .
After the black swan summons the dragon, a cypher (.786) or a shark (.886) pattern is expected next.
Usually, the chart rebounds approximately between 0.5 and 0.618, even when the consecutive pattern formation isn't inhibited.
However, we don't see any such break in the chart this time.
BTC exhibits immaculate movement of harmonic patterns sequence, which implies how deep and persistent this decline could be.
For the details of this analysis, please look at the related ideas below.
I will write an educational subject to explain the price action pattern shortly.

Potential Black swan would summon a dragon
BTC has been rejected at the apparent resistance of the 25200 zone.
Gann Square, as applied, also implies that the buy-side liquidity above is hard to reach.
Moreover, a harmonic black swan pattern (black) has formed, which would trigger another potential bearish harmonic pattern - a dragon (red).
The bearish dragon's target would be 0.618 (20104) -0.786 (19001).
However, given the Gann Square Arc's support, 0.618 or shallower is likely for the initial move.
Bearish dragon pattern unfolding
With a harmonic black swan's fluttering, BTC has broken the daily trendline (green) as the support, forming a red, bearish dragon pattern.
This price action is precisely what we predicted in our previous idea .
Please look at the related ideas for the further development expected to follow.

Bearish seahorse transforming into a dragon
This is a sequel to my previous idea .
As we predicted, BTC substantially formed a bearish seahorse pattern, which induced a sharp drop already matching a roughly 1.5 BC extension from point D.
I expect a bearish dragon follows next.
The target is 0.786 retracement from the top to the "tail" (point X) of the sea horse, which is approximately the 21200-21250 zone where we would see a confluence with POC.
ETHUSD: Logscale Bearish BAMM Targeting 49 CentsThere are quite a few reasons the charts have given me a reason to believe ETH could at least see $168.1- $128.87 that I'v posted before, but there's also some reason to suspect ETH will lose 100 Billion Dollars in Market Cap to which I have also posted. These arguments can be found in the related Ideas Section. This here is simply the price chart variant of those setups. I think if one target worst case scenario we can see $0.49 which would be the PCZ of the Logscale Bearish BAMM but, if one wanted to lower the stakes a bit then we could settle at $168.81-$128.87 which would be around the PCZ of the local Butterfly BAMM.
We also have a Bearish Dragon Breakdown on this higher timeframe that would target atleast $7.94
CVS: 3 Falling Peaks, Bearish Dragon, at PCZ of Bearish Alt-BatWe do also have Bearish Divergence on the monthly and some of the lower timeframes but the stucture looks the smoothest on the 2 week. We have Confimed the Bearish Dragon Breakdown and are working on confirming the 3 Falling Peaks Pattern if we Break Below $86.78

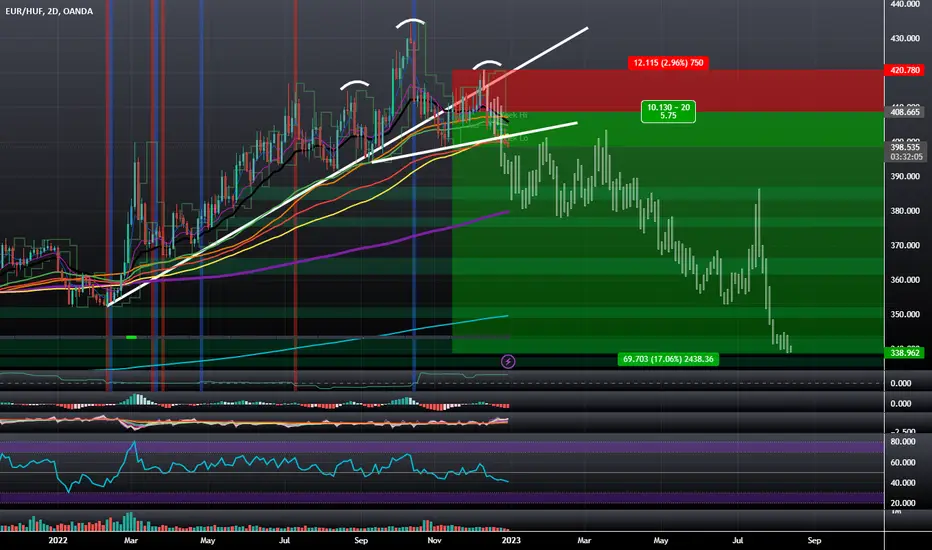
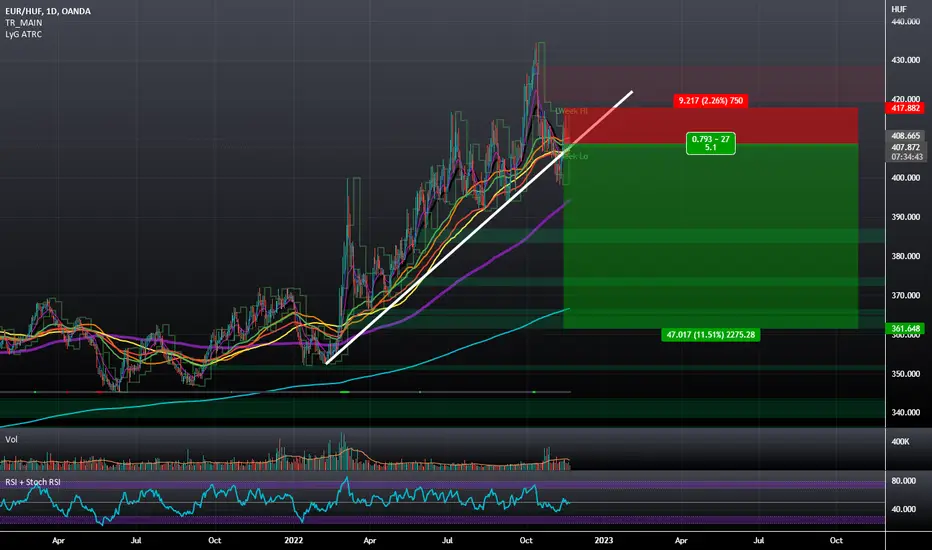
EURHUF Update: HnS is Breaking Down After Breaking UptrendDo to the huge gap in interest rates between the EUR and the HUF it seems like it will only be a matter of time before a bearish pattern like this were to play out.
This is simply just me revisiting the chart as we have gotten both a Bearish Backtest of the old uptrend and have broken through the neckline of the Bearish Head and Shoulders.
ETHBTC Bearish dragon pattern forming
ETHBTC is forming a very bearish pattern.
A 0.786-0.886 retracement is likely if the red trendline is broken.
After a pullback, such a bearish movement could trigger another bearish pattern, 5-0.
Merely a theoretical possibility, but this is one of what the holders should be prepared for.
ETHUSD: Bearish Dragon Targeting $1100We have a Bearish Dragon and BAMM on Ethereum that looks to target $1179-$1100
EURHUF Bearish Dragon: Hungarian Interest Rates Remain ElevatedDo to the huge gap in interest rates between the EUR and the HUF it seems like it will only be a matter of time before a bearish pattern like this were to play out.
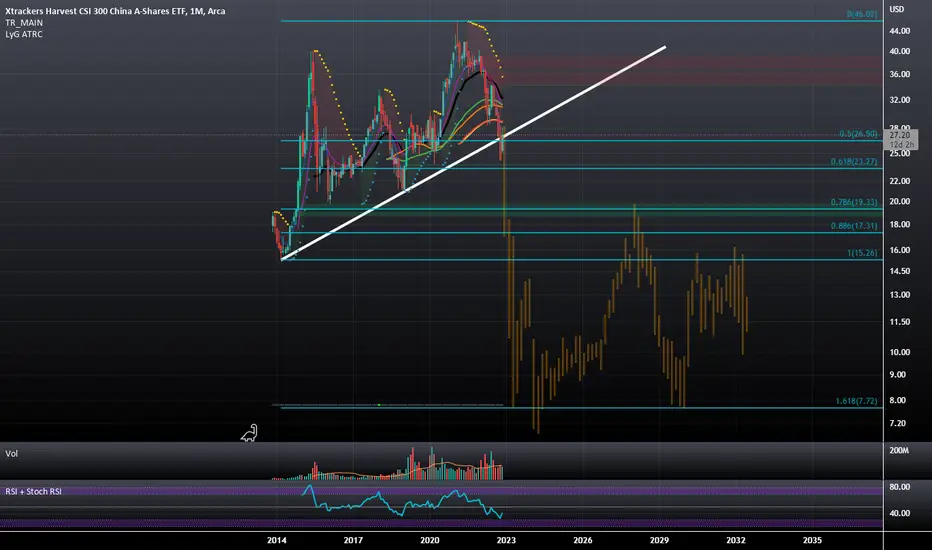
Chinese SSE300 Index ETF: Bearish Dragon with 1.618 TargetThis is an extension to the Bearish SSE50 setup that I posted not so long ago; I found a tradable US Listed ETF that tracks the movement of the SSE300 and the situation on this chart is pretty much the same as the one for the SSE50 where we are breaking a logarithmic trendline, the moving averages, and looking to make a minimum 61.8% retrace. However, I believe it will go much deeper and my targets will be the 88.6% retrace at $17.31 and then the 1.618 Fibonacci Extension below at $7.72
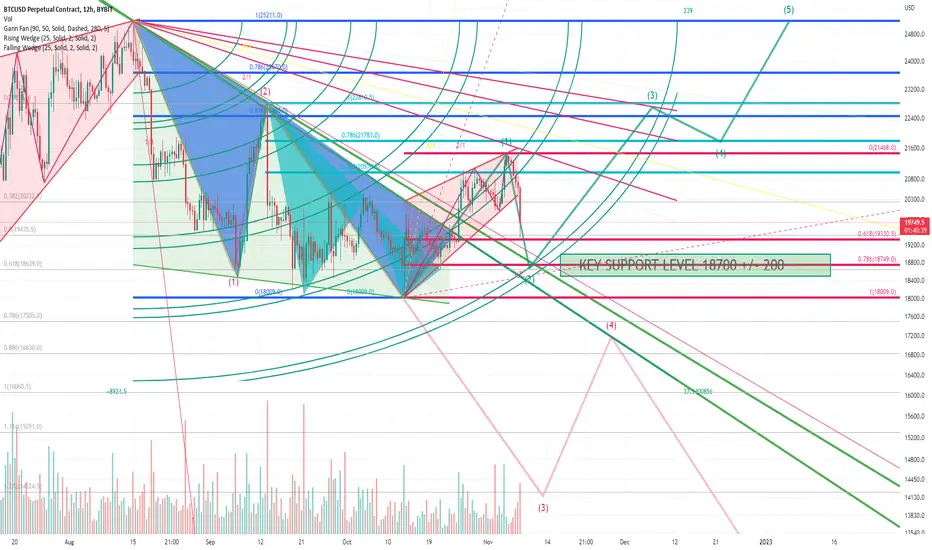
Bullish or Bearish: Watch Clitical Support Level of 18700
With the crypto exchange's asset liquidation plan flowing as FUD, the BTC chart, which looked strong, looks fragile.
Technically, a Bullish Dragon (green)' s TP (21700) has almost been (but has yet) reached, and BTC is on the path to test the support of another giant Dragon (blue).
Dragon patterns (often simply wedges), large or small, bullish or bearish, their theoretically cleanest target is a Fibonacci retracement level of 0.786.
So let's look at the red, bearish dragon's FR 0.786, where several supports converge. It's around 18700.
If BTC is on the bullish path, but a further correction is needed, we would likely see a rebound at around 18700 (green trendlines), and a bullish Elliot progressive wave (green 12345) will follow.
On the other hand, if the price breaks down through the critical support level of around 18700, we would witness a massive decline reopening the downtrend (red 12345).
If the market turns out to be bearish, my immediate previous idea will be invalidated.
This analysis should be neutral, but I see corrections in a bullish path. So this is tagged "short."
Note: Gann Square and arcs are for reference. If you dislike it, you can ignore it. Criticism for Gann Square isn't welcome in the comment area.
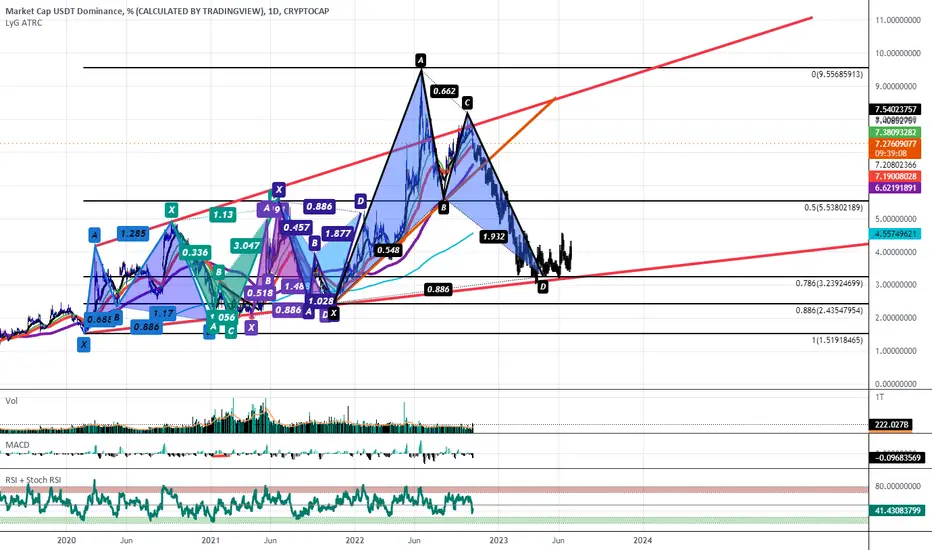
Potential Bearish BAMM On The USDT Dominance B Point AdjustmentThis is an update to a previous Pottential Shark BAMM Projection i had on the USDT Dominance.
It's been several months since posting and in that time the Shark Situation is still somewhat valid as a new high has not been made but i think it looks a bit ugly now. So based off the price action we've gotten recently i will be raising our Potential B point, thereby making this a Potential Bat rather Than a Potential Shark; The .886 Retrace Remains the Target if the B point breaks down.
Additionally we seem to be forming an accelerated Trendline which if we break that it would basically act as a Validation line to a Bearish Dragon.
We also seem to be trading within a Macro Ascending Broadening Channel on the Linear scale that we've Broken above but come back within at the highs.
Lastly the USDT Dominance is trading within a much larger Equidistant Channel on the Log scale Chart that can be seen below and i expect that it is setting up for a 50% Retrace overall:
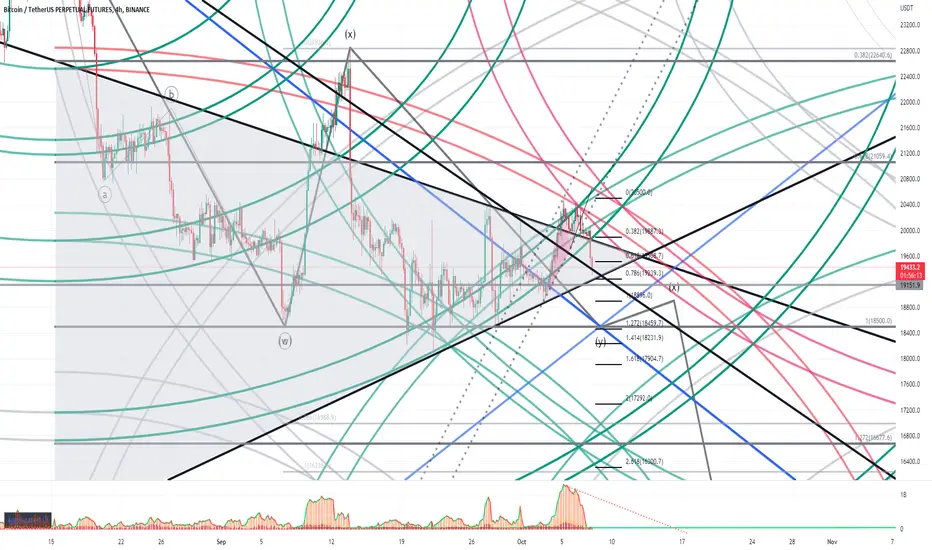
BTC: Watch 18460 if it breaks below the bottom of pennant
As we predicted, the bearish dragon pattern (red) is unfolding to pull the price down to approx. FR 0.786, almost the bottom of the pennant (gray).
If it breaks, what's the next target?
Because Gann Square works well, we could focus on its crucial component - two Gann Fans 1 X 1 (blue).
Interestingly, the crosspoint of the two Gann Fans coincides with the FR 1.272 level of the bearish dragon.
If you look at the left side of the chart, this horizontal, 18460, will be conscious initially.
But, because so many things overlap, no wonder it serves as significant support before the price reaches the current market low of 17600 at a continued downfall.