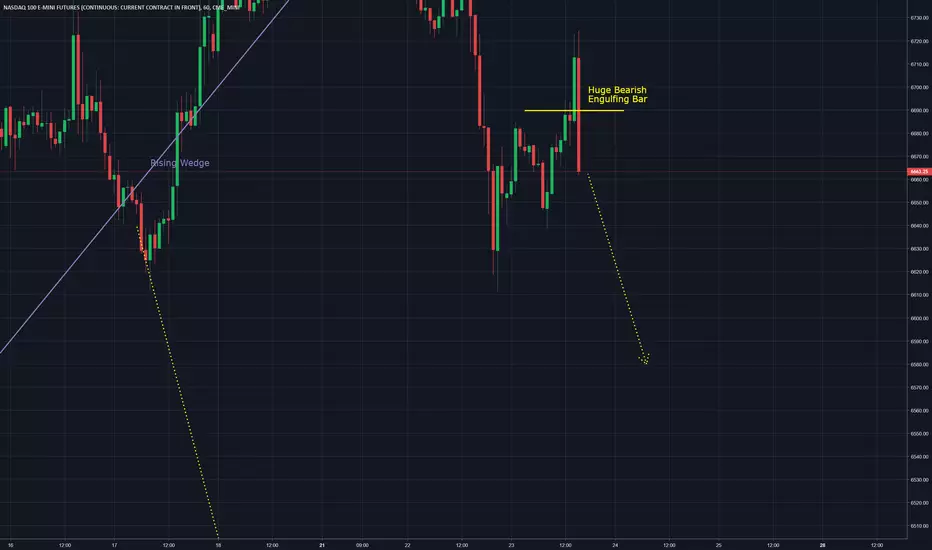
QQQ / NQ - Huge Bearish Engulfing BarA very large bearish engulfing bar has formed on the hourly charts after a failed attempt by bulls to push price higher early in the trading session. This has very bearish implications and near term bias remains bearish.
Bearish Engulfing
USDCAD shortBounce from 100SMA and bearish engulfing candle. CAD strength should be returning as oil pull back is done for now. Retail sales for Canada at 1:30 today.

Bitcoin Daily Update (day 304)Disclaimer: If you are primarily interested in copying other people’s trades then this is not for you. However, if you are willing to put in the work that it takes to learn how to trade for yourself then you have found the right place! Nevertheless please be advised that you can give 10 people a profitable trading strategy and only 1-2 of them will be able to succeed long term. If you fall into the majority that tries and fails then I assume no responsibility for your losses. What you do with your $ is your business, what I do with my $ is my business.
Click here for my Comprehensive Trading Strategy | Click here for my Comprehensive Trading Process | Click here to learn about the 2 BTC' to 20 BTC' Trading Challenge
*Using Weekly Chart*
Consensio: P < M MA < S MA < L MA | S MA made first bullish cross with M MA since July and it appears to have immediately reversed.
Patterns: Phase 7 hyperwave | Bear Channel
Horizontals: $3,500 support being tested | R: $3,592
Trendline: Channel is included on today’s chart
Parabolic SAR: $5,170 and accelerating down rapidly
Futures Curve: Backwardation is only reason I am not short.
BTCUSDSHORTS: Consolidating at support. Will we get higher low or not?
Funding Rates: Longs pay 0.01% | Very surprised that longs are paying shorts after the last couple days.
TD’ Sequential: Bearish price flip
Ichimoku Cloud: Bearish af
Relative Strength Index: Finding resistance at 38.
Average Directional Index: Shows that bear trend has only just begun. Estimate that we are on the 50 yard line.
Volume: Not all too impressed with the volume on the selloff. Would like to see a bar that is closer to the volume we saw on the week of Nov 19.
Price Action: 24h: -2.1% | 2w: -7.9% | 1m: +9.1%
Bollinger Bands: Didn’t even retest MA on this last move. Bottom band = $2,572
Stochastic Oscillator: Made bearish cross < 20 which is as bearish as it gets
Summary: This is a very tricky spot. The daily close below $3,550 support combined with the weekly bearish engulfing is a strong indication to enter short. However the futures market is still in backwardation and I refuse to enter short as long as that is the case.
I got whipped around too many times shorting BTC during $6,000 consolidation and I could have avoided every one of those entries if I used the futures curve as my final confirmation.
That is the most important indicator to me right now and I will be watching it closely. If the market re enters Contango then I intend to start shorting again. I am as confident as could be that we have not seen the bottom yet, however I also thought this would be an ideal area to provide the support needed for a relief rally.
Therefore both sides of the trade are appealing. Great time to sit on my hands and wait for a clearly picture to present itself.

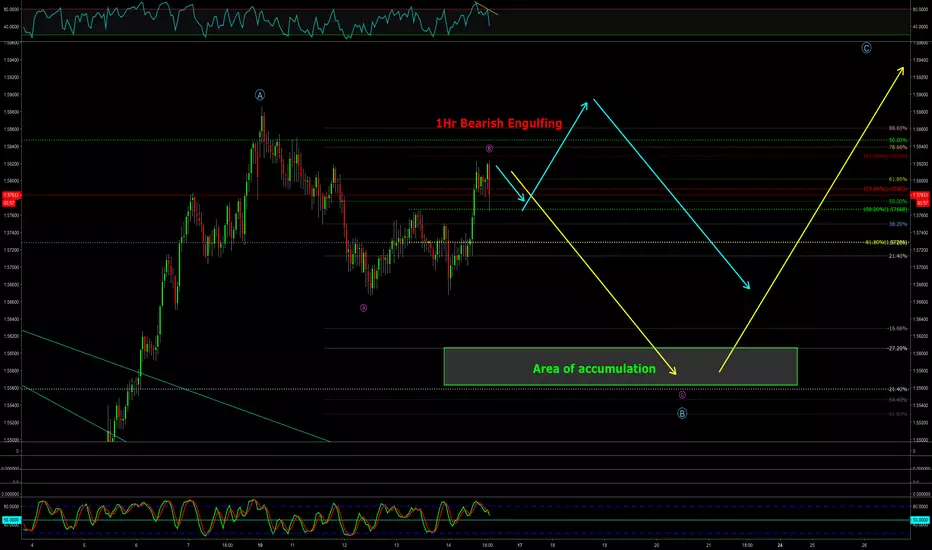
EURAUD Short EURAUD showing slight weakness for a short opportunity.
1Hr Bearish Engulfing and a 4Hr bearish engulfing.
This is also completed a three wave structure to commence the C wave.
Yellow Projection: Our preferred scenario to fall to the area of accumulation. Look for any sells through to this point.
Divergence between two peaks of RSI and we have the stochastic approaching the 50 line.
Teal Projection: Second scenario could break the prior A top then head south.
The risk: Keep your stops above blue A if you have the capacity otherwise $1.5830 for a nice tight stop on this short play.
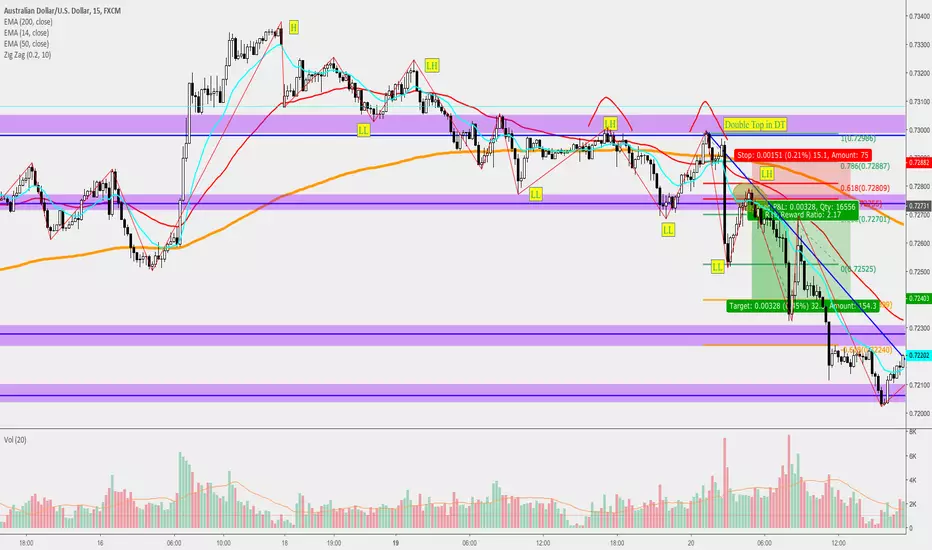
AudUsd Beautiful MultiConfluence Textbook Tradehere is a nice example of a break and retest (last kiss) as well as a fibo retracement lining up right with the support & new resistance
double top and neckline retest
taking it from zone to zone, from .5 fib retracement resistance zone to the support zone and extension area of -272
another confluence is 14 and 50 ema are under 200ema
32pip profit here if u tp'd at -272
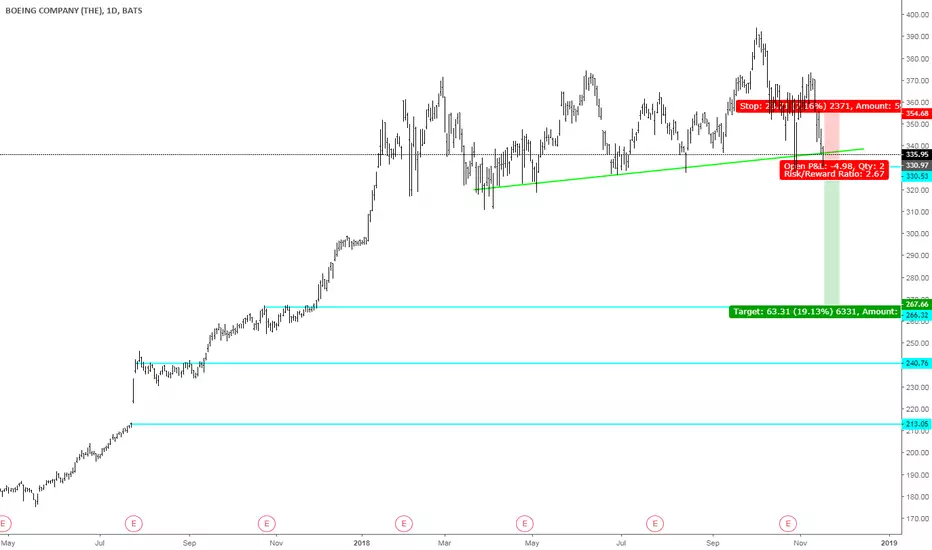
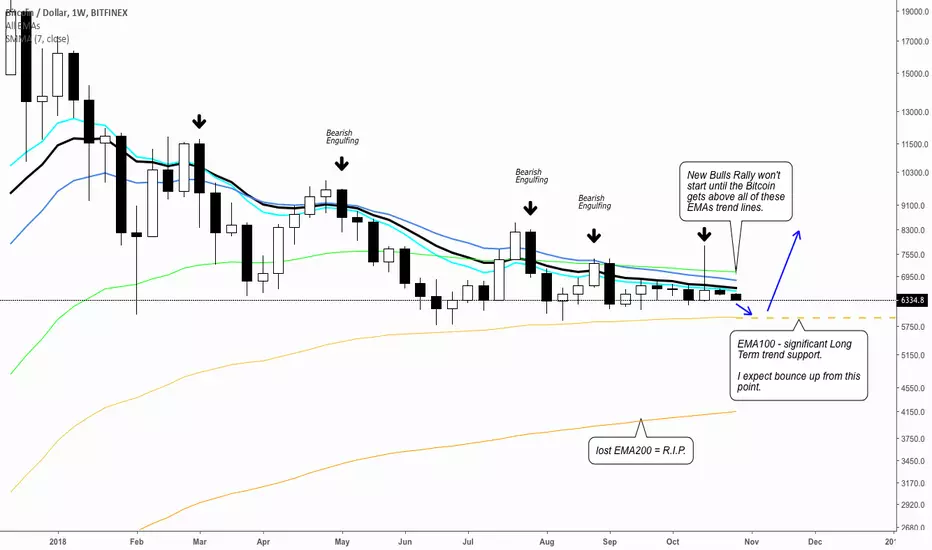
BITCOIN ($BTC): When does the new Bulls rally begins?Based on simply EMA trend lines strategy.
If you like my idea, pls. hit that "like" buttom or leave a comment. Thanks!
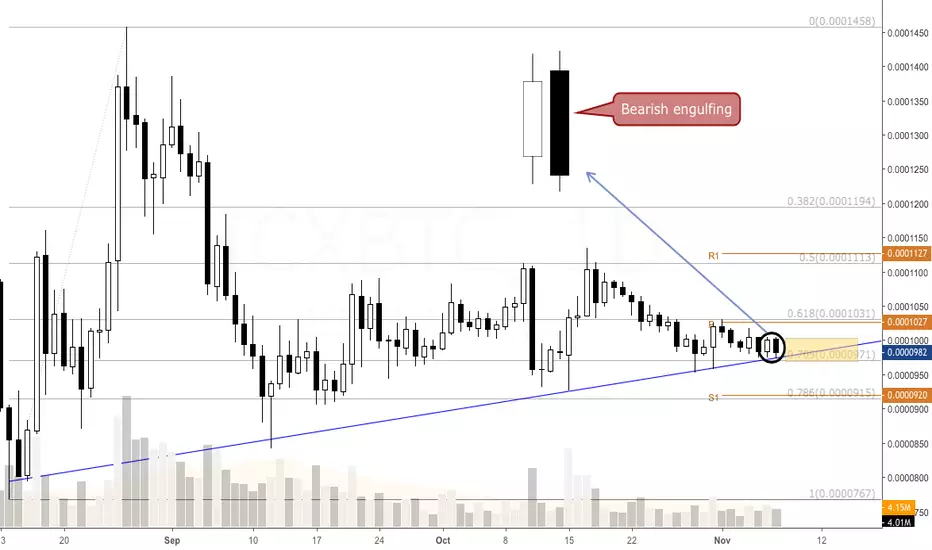
ICON - Bearish engulfing $ICXAlthough ICON is now on uptrend, it's currently forming a daily bearish engulfing. If it doesn't bounce from the yellow box, I'd expect it to go back to monthly S1 (78.6% Fib level). Otherwise, my targets would be monthly P (50% Fib level) and 61.8% Fib level.
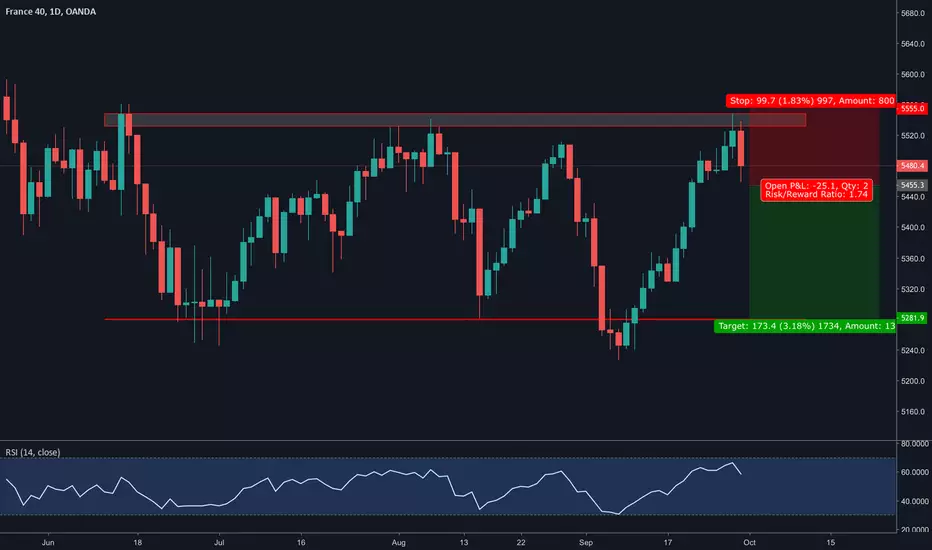
Great set up for another potential short move Perfect example of Support becomes Resistance.
Price bounced of nicely from the FIB level 61.80% with a bearish engulfing candle.
TP: Near 535.00 level
SL: above 555.000

FR40EUR ready for another short? My idea is to shorten the bearish engulfing pattern after the market has made a new low.
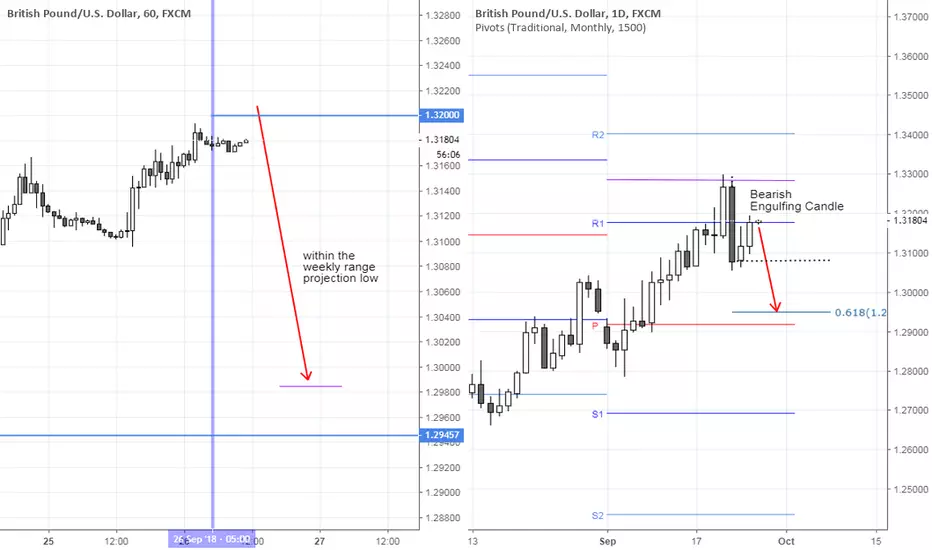
GBPUSD & Second Referendum Brexit?I have read that the Labour Party would vote for a second Brexit referendum. I am not sure wether that is bullish or bearish for the sterling. The market is one moody bugger who changes its mind so much. One day, this kind of news would be bullish for sterling, one day it becomes bearish. However, this fresh news (about potential second referendum now that no deals have been strucked with months before deadline) creates more uncertainty, and any uncertainty potentially negative for the Sterling.
Technically, GBPUSD have reached and exceeded its monthly range projection (high), as always, I will always shift my mid-term bias into a "retracement mode". Coincidentally, price reacted bearishly and formed Bearish Engulfing Candle on the Daily TF. I have made an extension projection based on this to a 61.8% extension. I am zooming in to Hour One timeframe and look for a short opportunity and target the weekly range projection low (almost = to the Daily 61.8% extension)
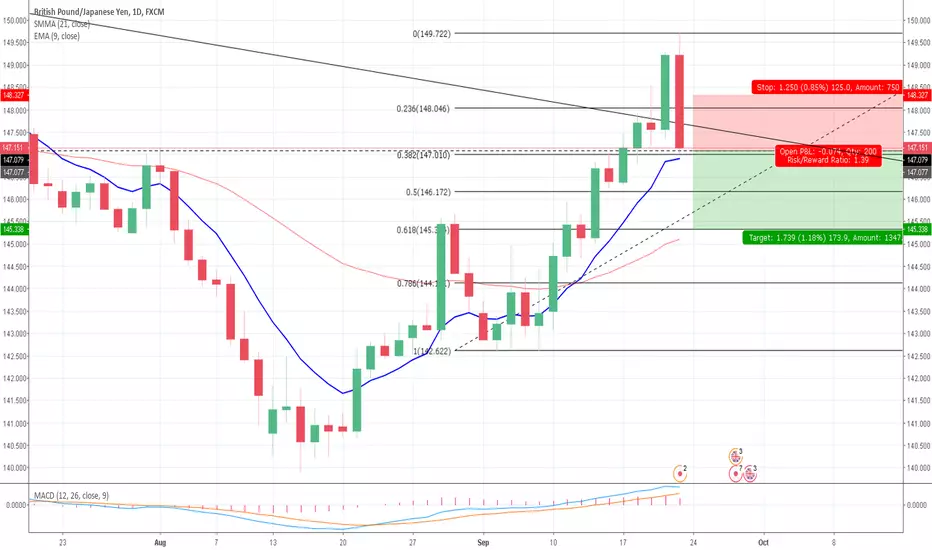
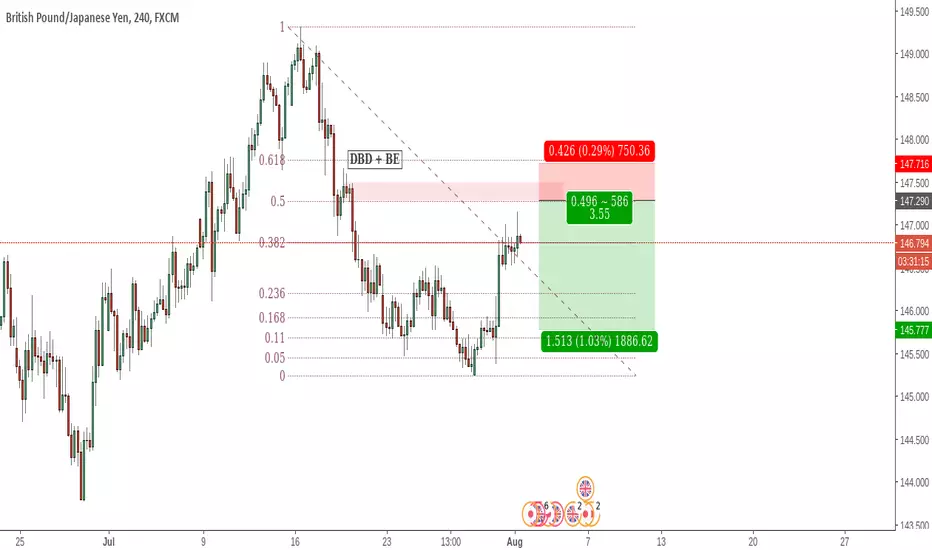
GBP/JPY SHORT IDEIA GREAT OPPORTUNITY FOR SELL!!
OANDA:GBPJPY
-BEARISH ENGULFING ON DAILY CHART
ENTRY PRICE: 147.079
SL: 148.327 -125PIPS
T1: 146.172 90PIPS
T2: 145.580 149PIPS
RISK/REWARD : 1.2
NICE TRADES FOR EVERYONE :)
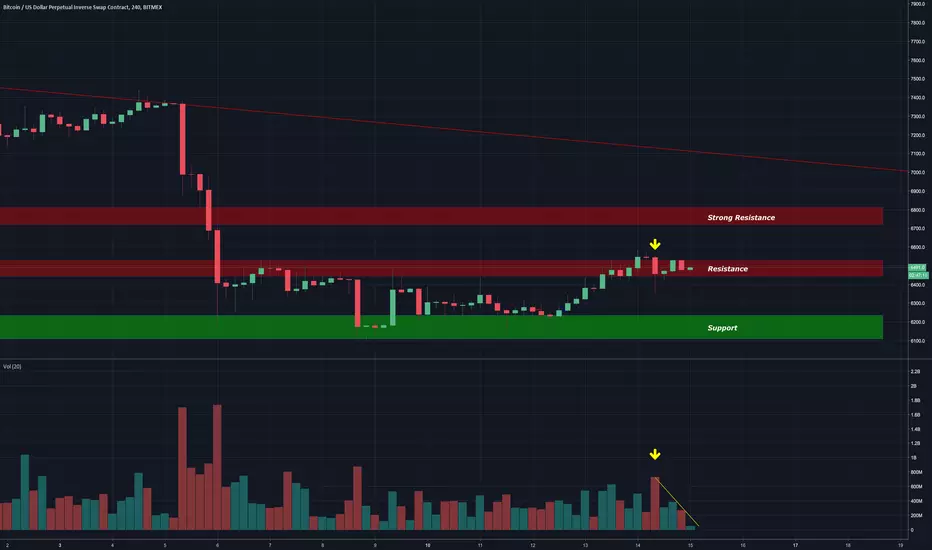
Bitcoin Daily Update (day 199)I believe that it is possible to beat the market through a consistent and unemotional approach. This is primarily achieved through preparing instead of reacting. Click here to learn more about how I use the indicators below and Click here to get my complete trading strategy! Please be advised that I swing trade and will often hold onto a position for > 1 month. What you do with your $ is your business, what I do with my $ is my business.
My most recent Bitcoin Bubble Comparison led to the following predictions: 1 day - 28 days = < $5,750 | bottom prediction: $2,860 by 10/30
Previous analysis / position: Identified resistance cluster from $6,67 - $6,887 that I believed will be the top of this bounce / Short ETH:BTC from 0.03143 | Short EOS:ETH from 0.0252326
Patterns: Descending triangle
Horizontal support and resistance: R: $6,539 | Weak S: $6,450
BTCUSDSHORTS: Looks toppy with hanging man and then extended range.
Funding Rates: Shorts pay longs 0.0384%
12 & 26 EMA’s (calculate % difference): 12 is being tested for resistance | 26 = -2.05%
50 & 128 MA’s: 50 = -4.28% | 128 = -7.53%
Volume: Declining volume while price rises on 1h
FIB’s: 0.618 = $6,637 | 0.786 = $6,414
Candlestick analysis: Daily doji | 4h bearish engulfing tweezer top
Ichimoku Cloud: 4h cloud providing resistance. Thick cloud with flat top says it will be strong from $6,500 - $6,750 | Add this to the resistance cluster mentioned in yesterday’s post
TD’ Sequential: Daily on a green 4. Top on the 4h 9 mentioned yesterday.
Visible Range: Looking back to February when we have continued to test this price makes the most sense and it shows the point of control at $6,514 and a high volume node up to $6,724
BTC’ Price Spreadsheet: 12h = -0.02% | 24h = - | 1w = +1.38% | 2w = -9.98% | 1m = +4.49%
Bollinger Bands: A return to the MA at $6,743 is to be expected after bouncing from the bottom band
Trendline: At this pace we will test the top of the descending triangle at $7,031
Daily Trend: Chop
Fractals: Up = $7,475 | Down = $6,065
On Balance Volume: Moving with price / no div’s
ADX: ADX fell below 25 indicating trendless market.
Chaikin Money Flow: Bouncing from oversold zones on weekly. Pulling back from overbought zones on daily.
RSI (30 setting): W = 48.98 | D = 46.51
Stoch: Daily buy signal is trending up.
Summary: I am starting to think that we are going to see the price resist below the original cluster that I was looking at. I would be surprised if we break through that daily doji from yesterday. That is when I expected the rally to $6,700+
Instead we were unable to test $6,660 and now the 4 hour chart is showing serious signs of a top. The high volume sell off followed by the bearish engulfing tweezer top is a strong indication that we will continue down from here.
Nevertheless the shorts remain at all time high territory and are showing significant signs of a top themselves. Will be get one more squeeze that takes us to $6,700 - $6,800 or will we sell off from here? I would say it is about 55%:40% and 5% other.
Here is my ETH:USD chart. The pale red box is where I want to build my next short position. The dark red boxes are shorts that have been called on this blog.
I also have an order set to short EOS:BTC at 0.0007474 and I am 66% entered on my EOS:ETH short at 0.0252326. Click here for my EOS analysis.
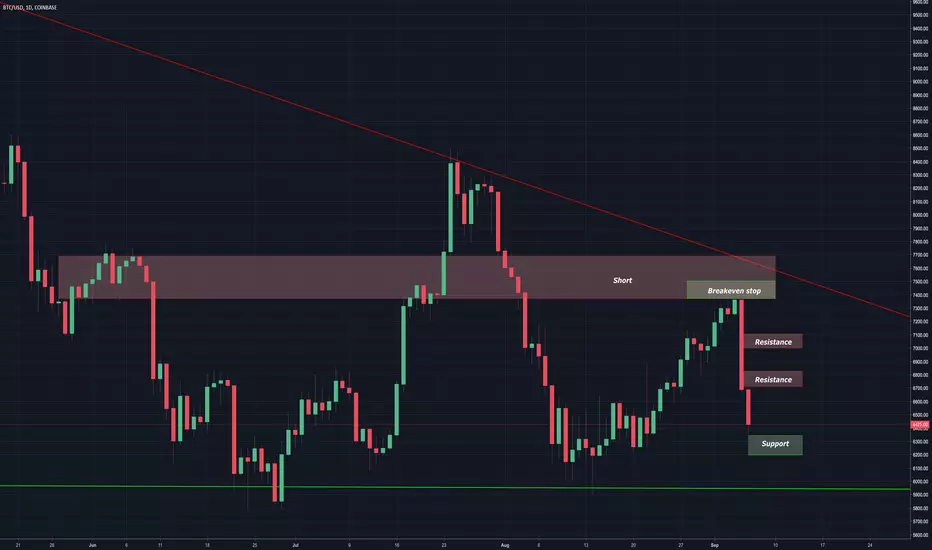
Bitcoin Daily Update (day 191)I believe that it is possible to beat the market through a consistent and unemotional approach. This is primarily achieved through preparing instead of reacting. Click here to learn more about how I use the indicators below and Click here to get my complete trading strategy! Please be advised that I swing trade and will often hold onto a position for > 1 month. What you do with your $ is your business, what I do with my $ is my business.
I did another in depth bubble comparison yesterday and have amended my short term projections. Click here to read that analysis. 1 day - 28 days = < $5,750 | bottom prediction: $2,860 by 10/30
Previous analysis / position: “$6,789 and $6,343 are my key areas of support...If you are not in position then now is not the time to chase! Wait for a bounce and then be ready to short...If you did enter in the last few days then now is the time to adjust stop losses to breakeven.” / Closed ETH:BTC short at +77% with intention to re enter if we bounce. Still short ETH:USD. Took profit on 33% of position improving my average cost basis to $317.37 per ETH.
Patterns: Weekly tweezer top. Descending triangle.
Horizontal support and resistance: R: $6,476 - $6,500 | S: $6,268 - $6,347
BTCUSDSHORTS: Approaching all time high levels.
Funding Rates: Shorts pay longs 0.0815%
12 & 26 EMA’s (calculate % difference): 12 = -6.79% | 26 = -6.14% | Very surprised that they have yet to make a bearish crossover.
50 & 128 MA’s: 50 = -8.53% | 128 = -11.05%
Volume: Big volume spike yesterday provided confirmation that the sell off was not a trap. Very surprised by the volume today. Currently 2X average and still more than 6 hours left!
FIB’s: 0.886 at $6,262 predicted current bounce.
Candlestick analysis: Bearish engulfing weekly candle has started every sell off in this bear market. Provides great confirmation for the bears. Weekly tweezers have also been very reliable/powerful.
Ichimoku Cloud: “Best entries occur when everything flips at once” Looks like this is getting ready to happen on 4h. Incoming TK’s cross + likely bearish kumo flip + just started trading below the cloud.
TD’ Sequential: 4h chart is currently on a green 1 that was a red 9. Interested to see if we bounce. Daily provided entry with R2 < R1.
Visible Range: Short term gap from $6,480 - $6,880 has been filled. A bounce back to $6,880 to test for resistance seems likely.
BTC’ Price Spreadsheet: 12h = +0.31% | 24h = -7.97% | 1w = -7.89% | 2w = -3.90% | 1m = -1.36%
Bollinger Bands: Almost touched bottom band on yesterday’s selloff. Expect MA at $6,787 to become strong resistance.
Trendline: Connect July 26th to September 4th.
Daily Trend: Bearish
Fractals: Down at $6,231 represents key area of support.
On Balance Volume: Moving down w price
ADX: -DI crossed above +DI as expected and they are quickly diverging. ADX crossing 20 indicates that the range should be over and we should be ready to trend again.
Chaikin Money Flow: Moving down with price.
RSI (30 setting): W = 48.69 | D = 45.02 | Pulling back below 50 provides further confirmation for bears. Expecting a return to 30 before thisj bear market is over.
Stoch: Pulling back sharply on daily. Made a bearish crossover on 3d.
Summary: There is plenty of confirmation that indicates yesterday’s selloff was only the start. Specifically I am referring to the: Bollinger Bands, RSI, ADX, VRVP, weekly bearish engulfing / tweezer top.
The only two factors pointing to the contrary are: btcusdshorts nearing ATH’ and the funding rates being very expensive for short sellers. This tells me that we could see a sharp spike to $6,800 - $7,00 before continuing the sell off. If this happens it will provide a tremendous selling opportunity.
If you are not in a position then be prepared for that outcome. If you are in a position then taking some off the table with the intention to re open if we bounce makes a lot of sense to me.
There is also the possibility that short sellers blow through the all time high levels and go on a bit of a parabolic run themselves. This seems more likely than usual due to how fast they have risen over the last few days. That tells me the positions are being held by a small number of traders. I get concerned when everyone and their UBER driver’s are opening short positions and that doesn’t appear to be the case this time around.
GBPUSD two-way planThe No-Deal Brexit jitters potentially pressure the Sterling in mid-term. I am picking two directions within a general GBPUSD mid-term bearish bias.
Left Hand Side Chart is H4 Timeframe. Right Hand Side Chart is H1 Timeframe
For Plan A : I am marking yesterday's daily pivot + 1.29000 price and I want to see how the market will react upon reaching it. A bearish engulfing candle in H1 timeframe will trigger me to short the GBPUSD. Target will be as illustrated by the arrow.
For Plan B : If the price test today's daily pivot and see a strong bullish reaction from it, I will be LONG and target will be as illustrated by the arrow.
If you like the write-up please give me a follow, If you agree with this trading plan please hit the Agree Button. If you disagree, post a comment down. Thank you for readinG!

AUDUSD : Prepare for POSSIBLE SHORT-1500+ plus PIPS Movement!This is a Re-post-As 1st Chart the Short (SL & TP) Position was put in reversed.
Actutal Trade is done vis OANDA account - FYI
We make analyse from Price Action / Price Pattern , S/R lines & Trend Lines
EXPECTING a BIG PRICE Movement Down..IF analyse is on target !!
> 1. For AUDUSD approaching Trendline S/R formed since 2002.
Remember TRADING is never 100% accurate..
>2. With analytics, we however FAVOUR a Break downwards of 1500+ PIPS
to the low of 2012 zone .
ENTRY will be via H4 / H1 – viz Pull Back BAR OR P RICE ACTION Confirmation ( Bear BAR etc!)
>3. OBSERVE PRICE ACTION !!. Do a Counter Trend IF Market shows otherwise !!
A: SUMMARY – We will be preparing for a SHORT position ONCE PRICE breaks
ZONE of 0.7160 to 0.70170.
TARGET TP is a Possible 1500+ PIPS Move @ 0.5510
MONTHLY Chart : Down TREND / WEDGE . Price Heading towards 2002 S/R Line
> See CHART :
WEEKLY Chart : Price BREAKING Congestion that was in place for last 8 weeks.
Now PRICE is also at/near Weekly S/R !!
> See CHART :
B: This Coming/Next WEEK Analysis: - GET ready, position for a SHORT
when PRICE breaks ZONE of 0.7160 to 0.70170.
Then RIDE the SHORT Position for a BIG GAIN approx. 1,500+ POSSIBLE PIPS
PRICE ACTION to TP target can take 4-7 months. SO RIDE OUT !!
1- ENTRY via PRICE ACTION watch . Viz H4 entry pull back to Support/TREND line.
2- OR Strong Price ACTION Signal , Big Bear Candle etc..
BE Nimble, as it might not reverse to Support-Trend line Before Trending down !!
LETS have a GOOD SHORT AUDUSD -0.84% . TARGET Profit 1,5000+ PIPS RUN !!
3- 2nd POSSIBLE TP TARGET IF TREND HOLDS is at @ 0.5510
CHEERS .. Stay Nimble-TRADE SAFE !!
Let the Market Do, WHAT’S It suppose to do !!
Act & Trigger as and when Market Dictate, ie your SHORT ENTRY !!

US 30 Trendline Test Rejection: Imminent ThrowoverCompare/contrast to 11/12 June top and throwover. Bearish engulfing candle. Shooting stars. On intraday we saw hanging man twice, and shooting star in SPX 8/.21.
Expect imminent throwover to entry on wave C of ABC ZigZag correction pattern within days, after reaching all-time high on SPX 8/21, US 30 25888 at Fibo 0.786 from Jan 26 high. Target 23531.
Possibly one more rally attempt to trendline on 8/23, then swoon; or just start lower back down into Bear Flag channel now.
As always, this is not investment advice and all comments are only intended for education and amusement. Good luck!

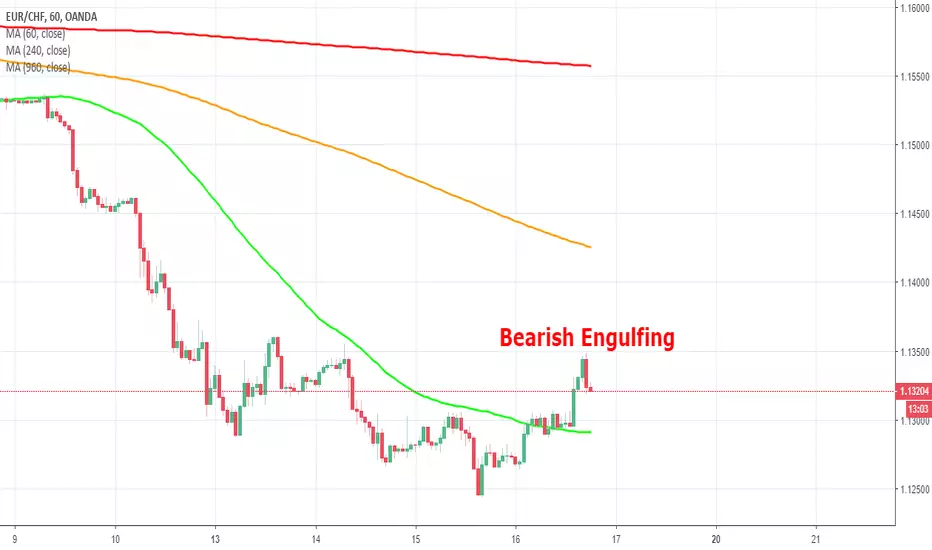
EURCHF - Bearish Engulfing Pattern at a turning pointEURCHF
The currency pair is in a downtrend according to the strong bearish setup of the moving averages.
In the video of this morning, we were already considering a short position on it, but now we have a clear candlestick pattern, a bearish engulfing.
Stop loss and take profit may be selected to have a RR that is at least 1:2.
AUDJPY - Short Trade Idea on a Double TopAUDJPY
There are several reasons to consider a short position on this currency pair:
1. Bearish setup with the moving averages;
2. Double top formation;
3. Green moving average working as a dynamic resistance;
4. Bearish engulfing pattern;
5. Price in a main downtrend.
The risk to reward ratio is 1:2, so definitely a trade to try.

Dow in correction wave XYZ; expect lower soonThis is a 3-3-3 corrective wave pattern forming. Looks like we had 3 strong down waves in 'W'; 3 smaller up waves today for an 'X';
The 'Y' should start very soon, will likely open with a gap down and should carry index to near same decline as 'W' or ~520 points to 24818.
I do not see an ABC pattern here, as there are no 5 wave impulses in the W or X waves.
As always I am not an investment advisor, and this is not advice, it's for education and amusement. Good luck!

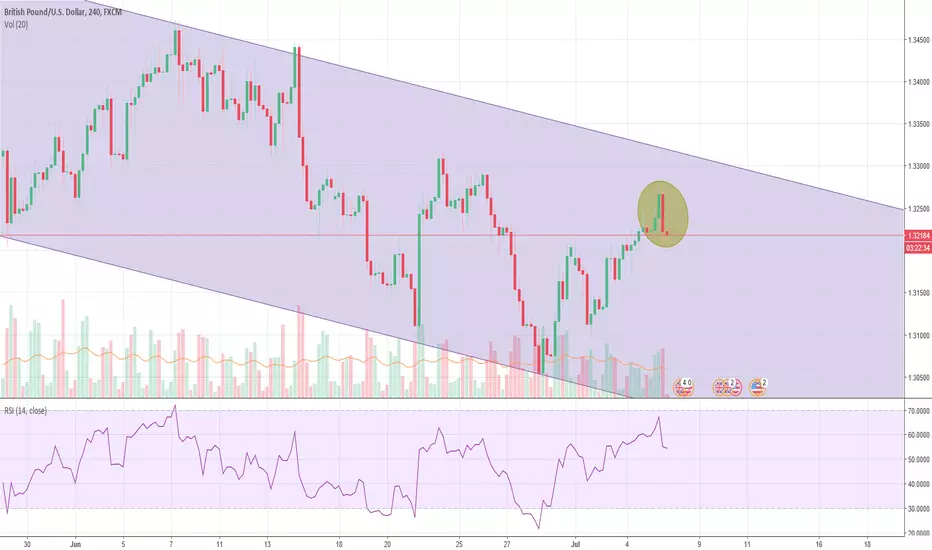
GBPUSD - Bearish englufing!A bearish engulfing candle has formed as the price moves closer to the resistance level of this bearish channel. It looks like to me that the price of this pair is going to be negative over the next few days. I think the price would move down from here towards the support level of the channel, we have seen a shooting star form as well, which makes this signal much more significant. I will keep everyone updated on this pair over the coming days. If anyone needs any help just comment or private message me and I will try my best to help.