Wipro 4 Hourly Timeframe Wipro in 4 Hour Timeframe formed Twizzer top pattern & bearish engulfing. If next candle formed bearish then pattern will be confirmed i.e bearish engulfing and you can set 1:1 target.
Bearish Engulfing

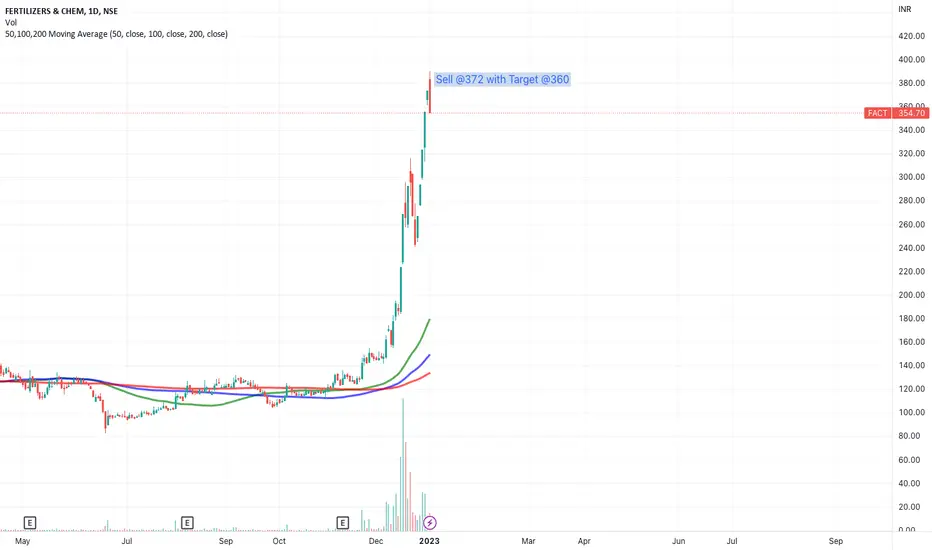
Short Sell: Bearish EngulfingWe can have good option to sell above @372 with Target @360
Disclaimer - This post is only for educational purpose and do not treat it as a trading recommendation.
Ethereum Confirming the Bearish Breakdown to $168.81Last week i posted about this Potential BAMM and Bear Flag Breakdown on ETH that would take us to the 1.618 Fibonacci Extension if real and now this week it looks like we are confirming the BAMM Trigger Line as Resistance as the Hidden Bearish Divergence Continues on the MACD. We have a Bearish Engulfing on the Monthly and just recently closed the Weekly below the POC as well as triggered tthe CAI. I think this gives great reason to believe that ETH will be coming down to lose 88% of it's value meanwhile other coins like XMR, XRP, and LTC will significantly gain in ETH Value.


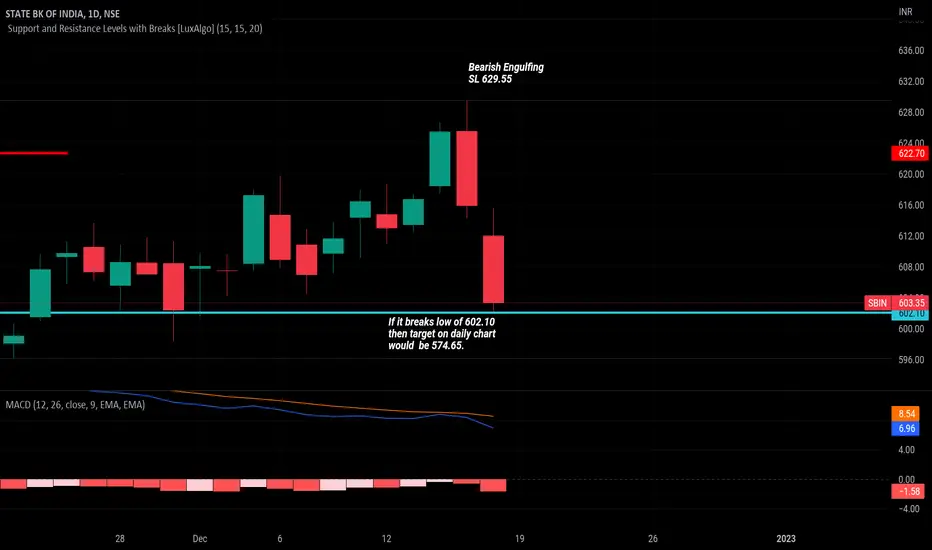
SBI Bearish Engulfing Chart pattern formed is bearish Engulfing on daily chart.
SL is 629.55
If it breaks low of 602.10 then target on daily chart would be 574.65.
my view on Glenmark Bearish!!!AS per daily chart and another time frames its showing bearish side
if price open below Rs.409 it will down upto Rs.380

LINKUSD looking weak with Bearish Engulfing setupLINK looks to have failed a 3rd attempt to breakout, locking in a very large bearish engulfing pattern on the weekly. If this pattern follows through I'll be looking in the $2.70-3 range as a major support.

USDCAD I Structure broken - next moveWelcome back! Let me know your thoughts in the comments!
**USDCAD - Listen to video!
We recommend that you keep this pair on your watchlist and enter when the entry criteria of your strategy is met.
Please support this idea with a LIKE and COMMENT if you find it useful and Click "Follow" on our profile if you'd like these trade ideas delivered straight to your email in the future.
Thanks for your continued support!
Brian & Kenya Horton, BK Forex Academy

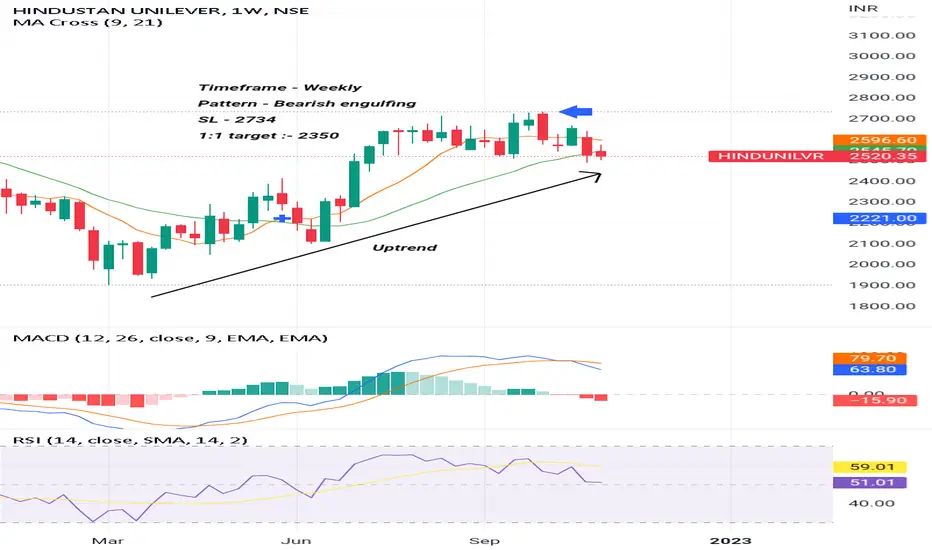
Hindustan Unilever - Weekly Chart Analysis Timeframe - Weekly
Pattern - Bearish engulfing
SL - 2734
1:1 target :- 2350
Also MACD negative divergence are there.
Rsi also in downtrend.
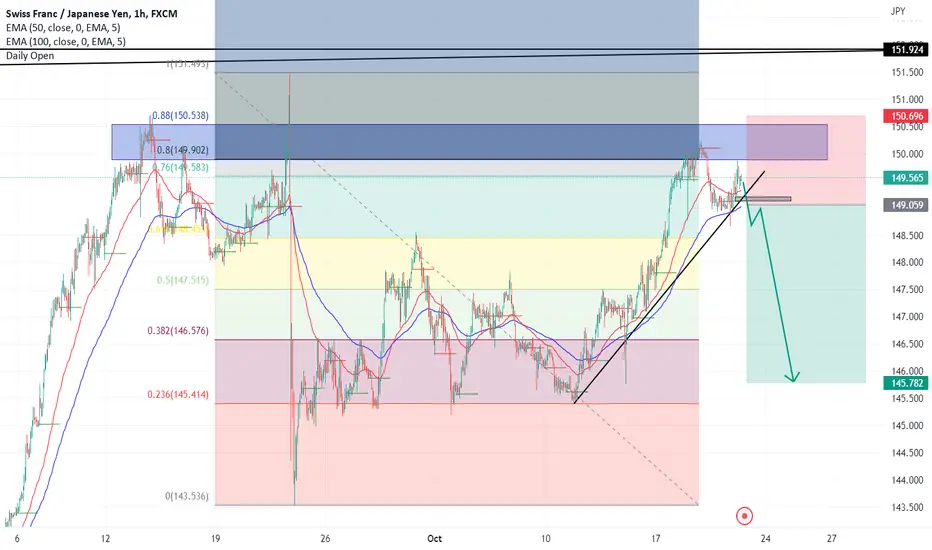
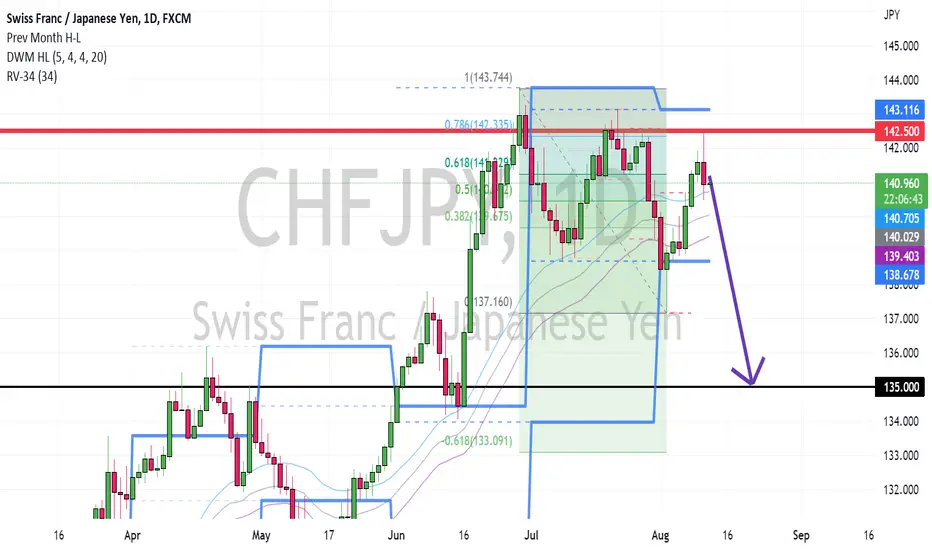
CHFJPY to fallOn weekly timeframe, CHFJPY has reached an overbought zone (RSI), an intersection between upper channel and horizontal support.
On lower timeframe, we've seen a big rejection recently, and then a correction upward : here we reach the 80~88% fib levels of the last rejection (D1), with a bearish engulfing pattern yesterday. This behavior can be a potential sell signal.
If we follow correlation to compare currencies, we find more confirmation : USDJPY has reached very high levels too fast, becoming overextended, and JPY will probably start a correction soon, meanwhile USDCHF is retesting a daily resistance for the fourth time, giving bullish signals, not yet an overextended move.
Goodluck,
Joe.
Never ever have been before and here we go againTSTW.
Not legal and financial advice;
Any information provided here is only the personal opinion of the author.

NQ1! upd. Sep., 2022 TWTS.
Not legal and financial advice;
Any information provided here is only the personal opinion of the author.

US Dollar Reversal Signals Brew, But Will the Key Uptrend Hold?The DXY Dollar Index confirmed a breakout under a near-term rising trendline from August as prices confirmed a Bearish Engulfing candlestick pattern.
This might open the door to some weakness in the near-term. But, will the dominant uptrend hold?
Keep a close eye on the 50- and 100-day Simple Moving Averages (SMAs). These could reinstate the dominant upside focus.
Resuming the uptrend entails clearing the 78.6% Fibonacci extension at 110.9316. That exposes the 100% level at 112.643.
TVC:DXY

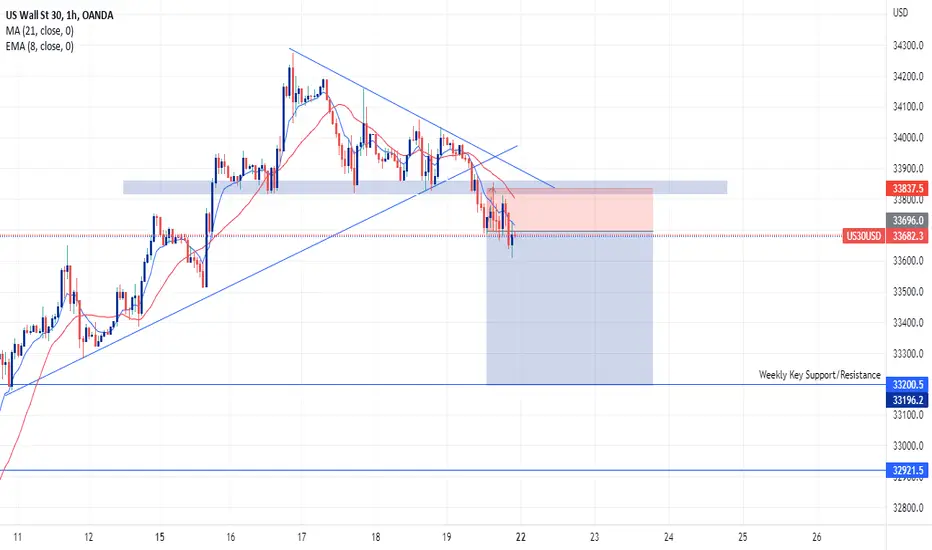
US30 SHORTOANDA:US30USD
US30 has broken its bullish structure. A retest formed and the bearish engulfing candle
which has formed is confirmation for entry. Target is the weekly key support level
I highlighted on the weekly timeframe.
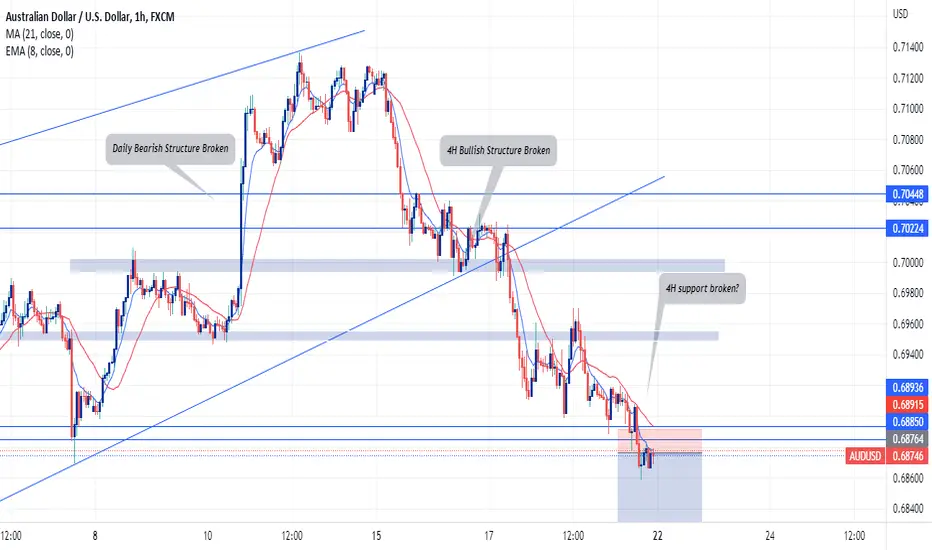
AUDUSD shortOANDA:AUDUSD
A break and retest of key support turned resistance on AUDUSD.
Bearish Engulfing candle is confirmation to go short
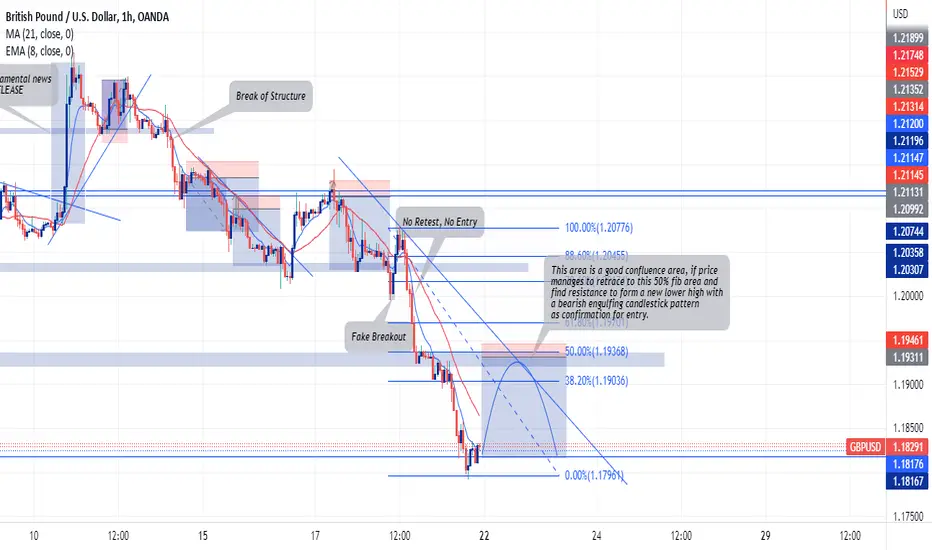
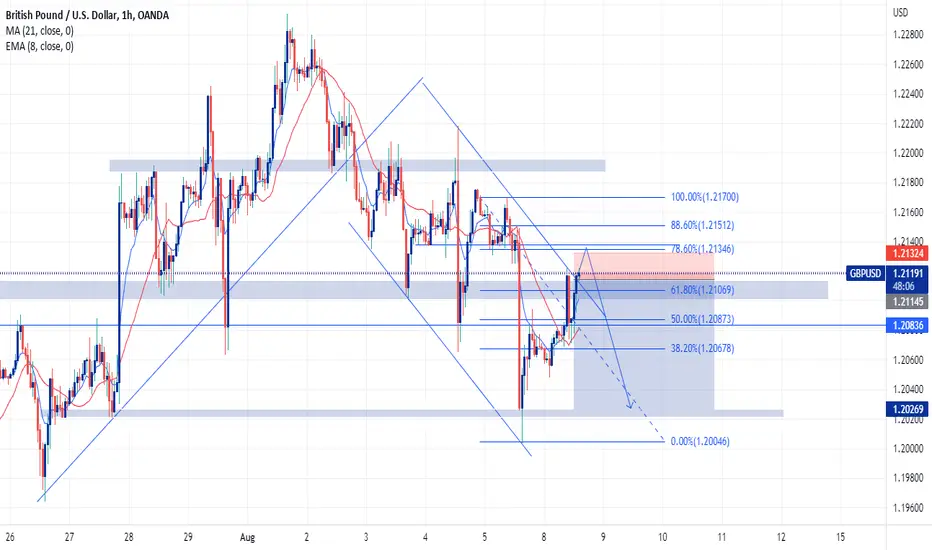
GBPUSD ShortOANDA:GBPUSD
GBPUSD Broke out of a strong support level aggressively without any retest.
My anticipation for next week is for GBPUSD to retrace to a key level of
resistance of the 1H and form a new lower high, a bearish engulfing
pattern will be confirmation to go short
CHFJPY SHORT OVER VIEWWe are looking at a 78.6% Retracement and a D1 Bearish Engulfing Candle formation. Target 135.000.
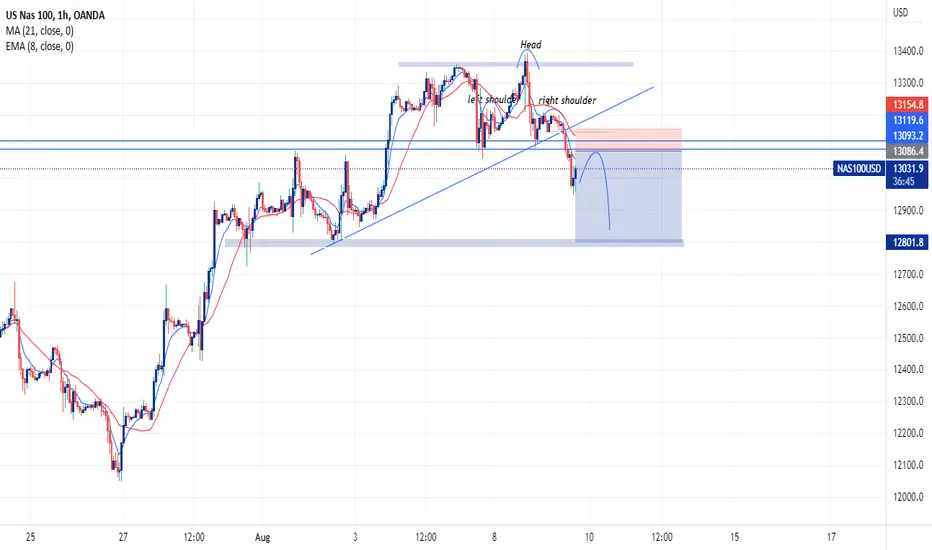
NAS100 ShortOANDA:NAS100USD
Nasdaq has broken it bullish move. The head and shoulder pattern was an indication of trend changing to bearish and the pattern proved to be bearish. Currently awaiting on a retest at key support turned into resistance. A bearish engulfing pattern will be a confirmation to go short on Nasdaq.
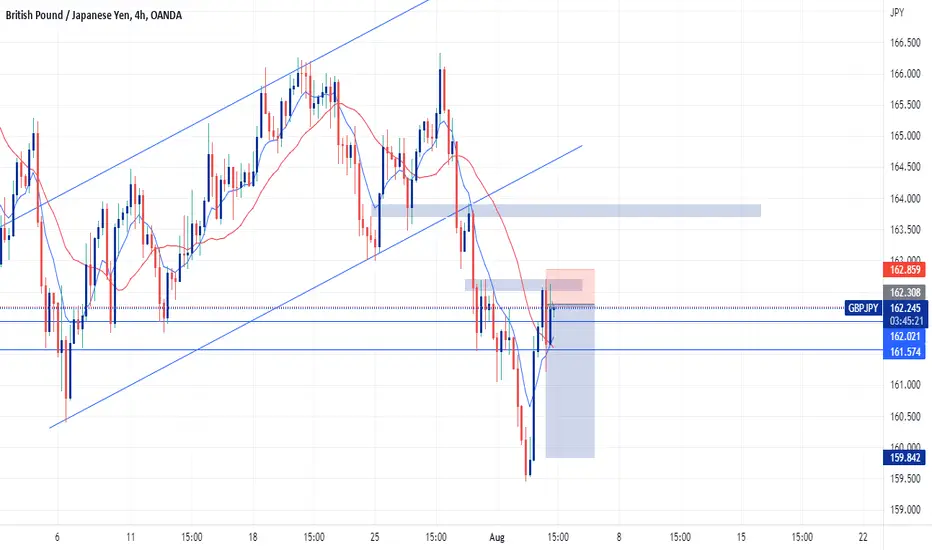
GBPJPY shortOANDA:GBPJPY
GBPJPY broke bullish structure, I am currently anticipating a retest at support turned into resistance to go bearish on GBPJPY

GBPUSD ShortGBPUSD is in a bearish trend, looking to go short at key resistance level potentially retracing at 61.8% and a bearish engulfing candle as confirmation to enter
GBPJPY shortOANDA:GBPJPY
GBPJPY broke bullish structure on the 4H timeframe and made a retest with a bearish engulfing candle as a confirmation to enter
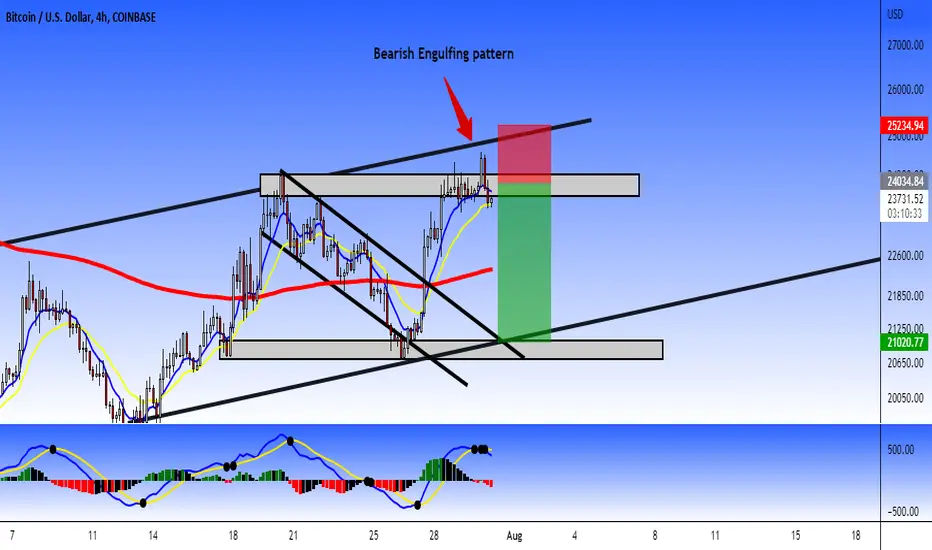
BTC/USD: bearish engulfing patternBitcoin forming a bearish engulfing pattern in H4 timeframe in the good zone to short into this chartist pattern (bearish channel perspective)
Trade Info:
1) Entry: $24,050 USD (sell order limit)
2) Stop Loss: $25, 230 USD
3) Take Profit: $21,000 USD
4) Risk/Benefit: 1:2
I hope that this analysis support you to short Bitcoin
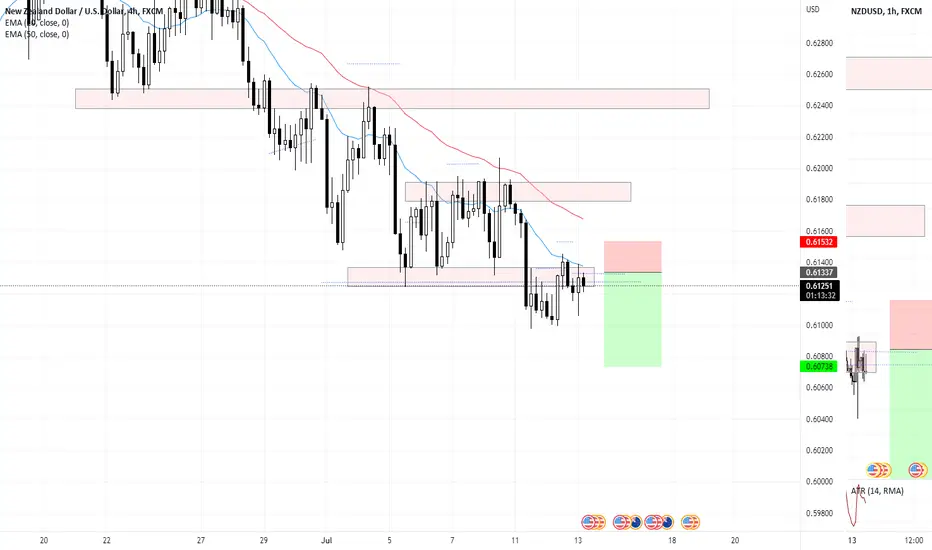
NZDUSD Bearish Engulfing 4HUsually take entries from 1 H chart although this setup was clearer to me on the 4H with the engulfing pattern at key resistance. Used a 50% limit order entry to get a better chance at 2:1 and above risk reward. FX:NZDUSD