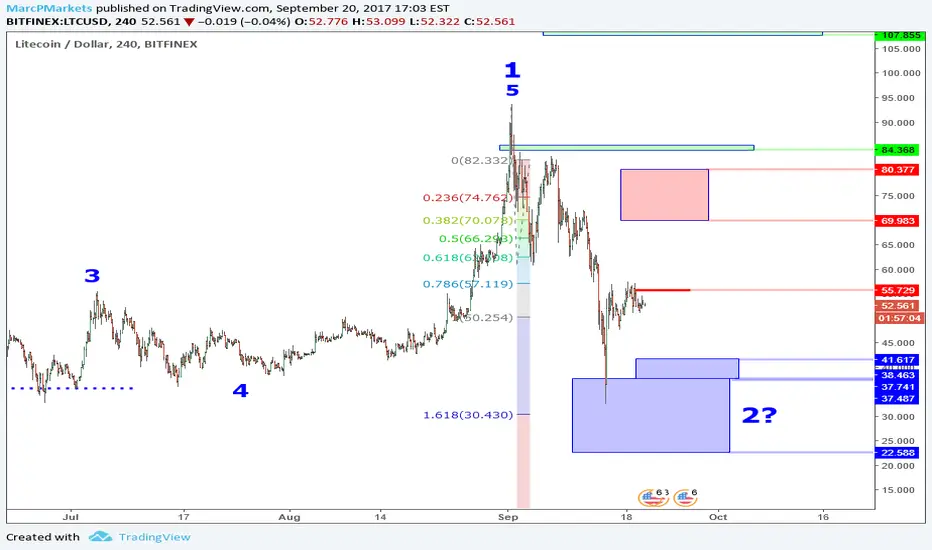
LTCUSD Perspective And Levels: Extreme Price Plan.LTCUSD Update: Same situation as the BTC market with consolidating price action just under the 55 resistance level (.382 of bearish swing). I am writing about this market to show what I am thinking for longer term positioning.
This market has previously lagged the top coins, and seems to now be following the leader which in my opinion makes it more attractive for long term strategies compared to swing trading or day trading. Also the present price structure may offer a clearer hint as to what the leader (BTC) is more likely to do in the near future.
First let's talk about the wave count. Just like BTC and ETH, this market is showing a 3 3 5 corrective formation with the current consolidation being a Wave 4 of C which means one more leg lower is likely and would be Wave 5. If this wave extends and revisits the low in any kind of dramatic sell off, it is possible to see price within the 37.50 to 22.50 range which is the .618 of the entire previous bullish structure (which it reached during the recent sell off). There is also a 1.618 extension at the 30.50 area which would be a convenient bottom area for a broad Wave 2 completion.
Keep in mind I am not predicting that this market will reach these levels. At this point I know that price action favors bearish momentum which means lower prices are likely to follow but I do not know how low. If selling momentum asserts itself again, price may find support in the 41 to 38 area which is the .618 of the recent bullish swing (which would also put the possibility of an extreme Wave 5 into question.)
Why not buy now? In order for it to revisit the extreme highs (like 80s and 90s), it first needs to push through the 70 to 80 resistance zone. Until that happens, price action will most likely be range bound and slow unless something fundamentally changes. This market is nowhere near that price zone, and instead hesitating just under the 55 resistance which I interpret as a more bearish sign.
So the reason why I am writing about this market is this: Any retrace to lower support levels, followed by a reversal, offers a long term buying opportunity in my opinion. I want to be prepared before this happens so if price reaches these projected supports, I will know what to do instead of react or hesitate. My plan is long term and NOT a swing trade, which means my entry does not have to be precise and also means I am willing to take pain.
There are two scenarios I am watching for. First is a retest and reversal back up off the 41 support zone. The second scenario is if price pushes extreme lows into the 30s or lower. In both situations, I will wait for the low candle to close, and then place an order to buy the break of the high of that low candle. TO BE CLEAR: This type of trading requires a solid plan and RISK management. I will not being using stops because it is a long term investment. So I manage risk through proportional position sizing instead. This means buying into it with an amount that allows me to take pain and still sleep at night. I can always add to the position on the way up. Again this is NOT swing trading, I must emphasize this because it has different risk parameters and management style. (No short term profit targets).
In summary, this market is interesting in many ways and if it offers extreme prices again, would be one that I intend to build a position for the long term. Presently price action is slow, showing signs of bearish momentum and is following the BTC lead. There is nothing attractive about the current price levels. The goal of this analysis is to provide an idea of how I am planning to get into this market, but the market needs to provide the opportunity. The plan must be in place ahead of time because in the thick of extreme price action, emotion will often get in the way. As my former Forex colleague Todd Gordon says: Plan your trade and trade your plan.
Comments and questions welcome.
Bearishmomentum
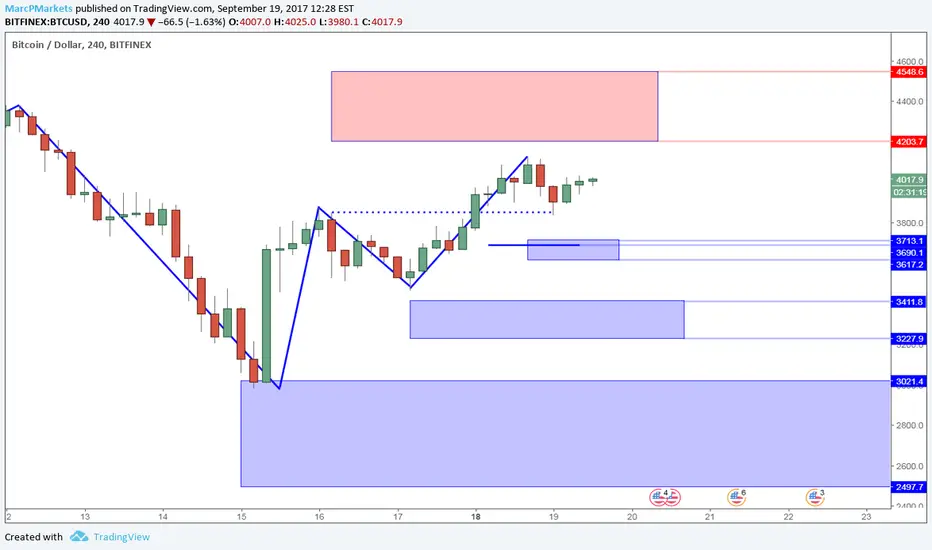
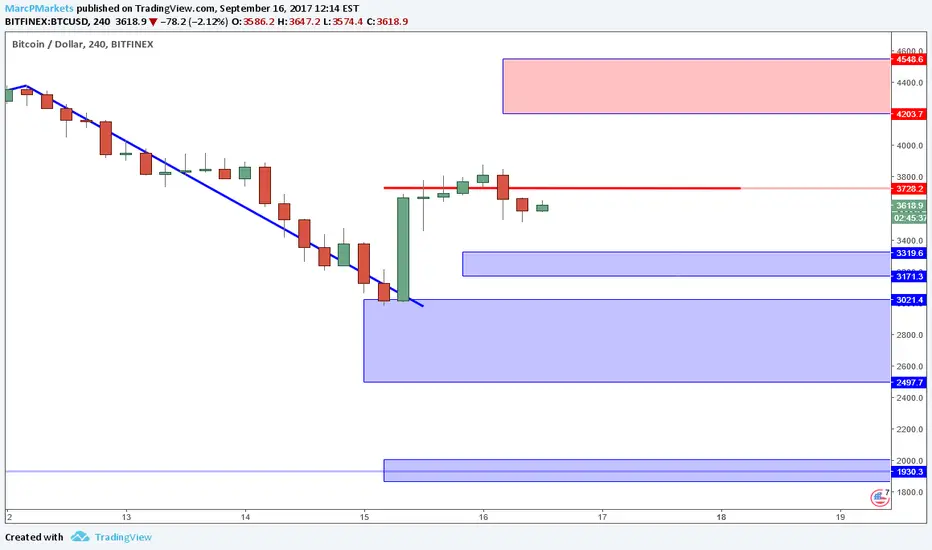
BTCUSD Perspective And Levels: 3690 Pivotal Support.BTCUSD update: The key resistance is the 4203 to 4548 area which is the .618 of the recent bearish swing. If price fails off of this area, it will need to find support above 3690 in order to maintain the current bullish structure and a chance to push beyond the 4548 level. If 3690 breaks, that could be the beginning of a correction that can take price back to the 3000 level.
As I wrote about in my previous BTCUSD report, this market appears to be in a C Wave and there are now 4 of 5 waves in place which means there is still a chance that Wave 5 unfolds. I am not predicting that it will, I am just going by the price structure that the market is showing at the moment. In order to add more weight to this scenario, the 3690 level (.382 of bullish swing) needs to be clearly taken out followed by a retrace to a lower high. On the 4 hour time frame, this process can take a day or two and will need a catalyst to ignite the required selling. In this scenario I would not expect support levels to hold, or only hold enough to generate a lower high followed by an eventual break of the 3227 level. If this price action materializes, I will be planning to invest at the extreme lows. Since all the coin markets are following this chart, you can buy any of them that suit your risk tolerance and affordability.
Now to make sure what I just wrote is CLEAR: Buying at extreme lows is NOT a swing trade strategy and not short term in any way. It is also not technical and more of a sentiment play. It requires you have a well defined plan, understand sizing and can tolerate risk. If you are not sure what I am describing, then it is best to stay out all together because you will only get yourself into trouble. Buying into extreme lows requires the ability to handle the risk. And this is NOT advice, I am just sharing what I intend to do IF this market offers an extreme low opportunity again in the near future. A push to 3000 or lower would qualify as extreme for me.
What if the market never retraces back to extremes? This is the other possibility where price pushes up into the current resistance zone, and pulls back into a significant support like the 3227 area without falling apart. I would categorize this price action as a range bound market which is not that unusual after the degree of recent selling momentum. In order for a market to get back to building bullish structure and pushing highs again, it needs to stabilize and build a base. A range bound market or consolidation is just that. This type of condition will offer trading opportunities, but they will have very conservative targets. Any swing trades that I take will be in the ETHUSD market while I use this market for further reference.
In summary, the market will choose a scenario, and the best we can do is be prepared for which ever one unfolds. Using elements like support/resistance and Elliott Wave can help us figure out what to look for and prepare. I realize many new participants think that this is a game of "outsmarting" the market or predicting what it will do next like a weather report. Analysis is not like that at all because all financial markets possess an element of randomness that we cannot control. The best we can do is evaluate price action, find clues and use them to anticipate what the market may do, and if our scenario unfolds, we simply execute our plan instead of reacting emotionally. If price cannot break the overhead resistance zone, and starts breaking supports instead, that will signal to me to stay out of any swing trades and only look for investment opportunities at extremes. If the extremes never happen, then the plan will be to look for swing trades within a range bound market. I have my plan, now the market needs to choose which way it will go. And if the market chooses a completely different scenario, I simply reevaluate and adjust to the new information.
Comments and questions welcome.
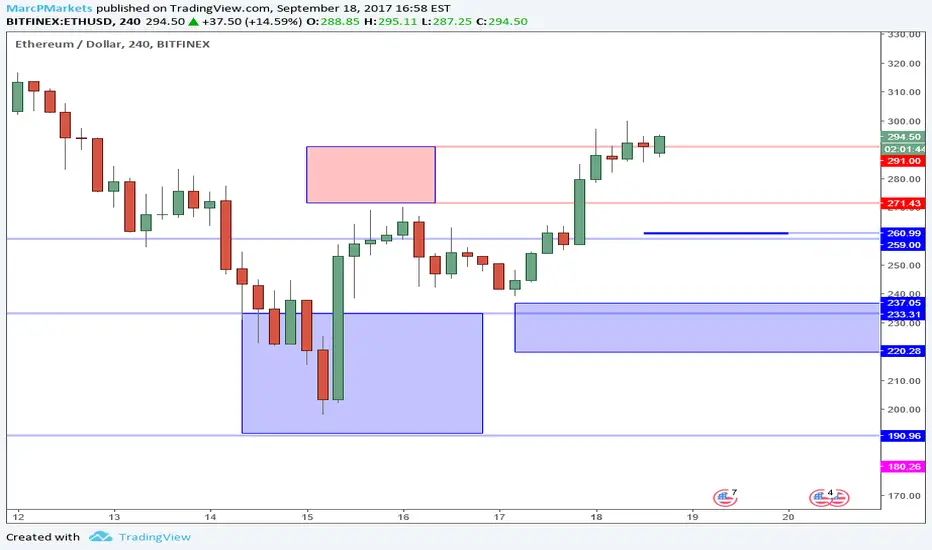
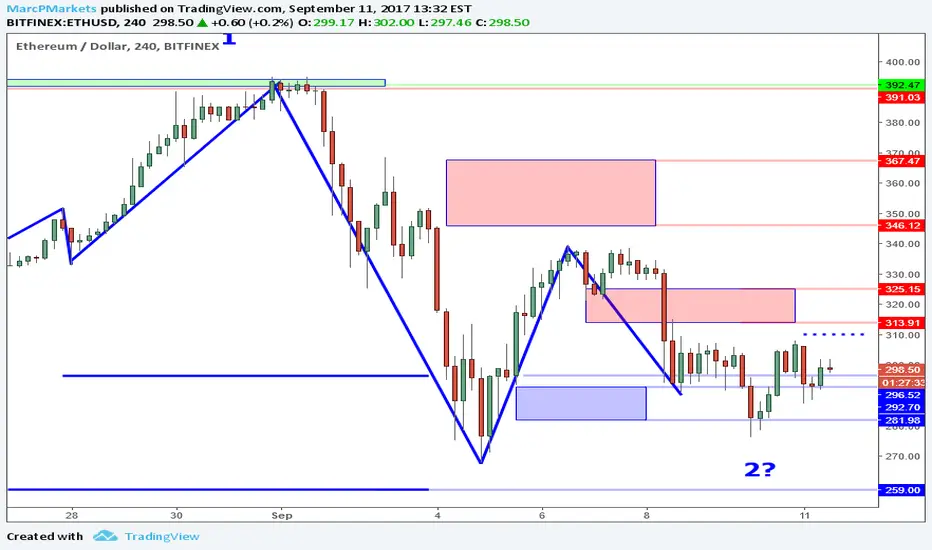
ETHUSD Perspective And Levels: The Next Supports.ETHUSD update: Nice push into the 271 to 291 resistance zone off of the shallow higher low. Tough trade to take because of the risk, and now even more so since price did not clear the resistance completely.
Bullish movements back up in the face of bearish structure is probably the most confusing for newer traders. Don't worry because if this market is going to present consistent bullish momentum, there will be more opportunities to get in even if the prices are higher.
The problem with entering now is that price is sitting at a high, and still hesitating near the range of the resistance zone. The next retrace will offer a much better opportunity in my opinion compared to where it is now. The key to buying into this market is waiting to see how low the next retrace goes. Now that there is some bullish structure to work with, there are new reference points to consider.
The first level that I will be evaluating is a retrace to the 260 area. Not only has this level been a key level during the major selloff, but is now the .382 of the recent bullish structure. If price can hold this area, and show a reversal pattern, I will be looking for a long swing trade with a target into the low 300s. If price falls through, then the next area is the 237 to 220 support which is the .618 of the recent bullish structure. I need to evaluate the price structure at the time in order to evaluate the risk.
I must make this clear: I am not putting buy orders in ahead of time. I am waiting to evaluate the price action IF the market revisits these levels. This market may not retrace at all and start pushing higher in which case I will NOT enter any position. Also since the current move up has not completely cleared the resistance zone, this market still has a good possibility of falling through the supports to test the lows (Remember Wave C?).
What is good about the current price structure is it's showing the possibility of momentum changing, but it has yet to prove itself. One negative catalyst and these supports will vanish. That is why as short term traders we evaluate risk and use stops. Also I must add IF another dramatic sell off materializes, the extreme prices will present investment opportunities for those who are interested in long term (AS IN HOLDING FOR YEARS). It is a completely different mindset and strategy from short term trading but I feel is worth mentioning because it requires much less precision. Just make sure to keep the strategies separate. Each one has its own plan and risk parameters, if you do not have any type of plan, then you should not be in these markets to begin with.
In summary, do not be frustrated by the recent upswing. Be happy you weren't short. Since price is hesitating within the projected resistance zone, I believe there is a better chance it retraces. If it can retrace back to a projected support level, and show some reversal confirmations on smaller time frames, then risk can be evaluated and setting a target in the low 300s is reasonable. Reward to risk should be no less than 1:1. And remember these supports are minor relative to the bearish structures that are currently in place. If they hold, great. If they break, then be prepared for the possibility of another test of the extremes, (which is not a bad thing if you are an investor). In the big picture, these markets are not that bearish, they just need to stabilize which may call for some range bound price action for a little while. The market will let us know.
Comments and questions welcome.
ETHUSD Perspective And Levels: Resistance Zone Above.ETHUSD Update: Shallow higher low established at the 238 level while price is attempting to push the minor resistance at the 259 to 262 area. The problem is momentum is still bearish and the 271 to 291 resistance zone ahead can lead to a lower high.
The higher low in place is a great example of a reversal formation, the problem is it has appeared in a very limiting context. First, price did not retrace back into the 233 or 220 support areas which would have been fine if this market was presenting bullish momentum like just retracing from a new high. Instead, price is showing a higher low (a sign of strength) in an environment of lower highers and a .382 resistance zone just ahead in the 271 to 291 area. So buying into this price action for a swing trade presents risk that is too high until there is evidence of bullish momentum again.
Why would a pullback to the 233 level or 220 be any better? It would present a risk/reward that is much more attractive, which would make a swing trade worth taking. For example, a retrace to 225 and reversal allows for a target of the low 270s while placing a stop in the low 200s. Risking 25 to make 50 is worthwhile. Buying in the 260s allows for maybe a 15 to 20 point target, with at least a 20 point stop which offers around 1:1 which isn't bad BUT this is accompanied by the higher possibility of the 271 area asserting a lower high in this environment. So there is more working against the trade at these levels and the reason why I will continue to stay flat.
In order to prove bullish momentum is backl, price needs to push beyond 291. At that point, a subsequent retrace will offer a better opportunity because momentum will be more in favor of longs for a swing trade time horizon.
And don't forget, in my previous report I wrote about the Wave C in the BTC market which still has plenty of room to complete which again favors lower prices. And since the alt coins are playing follow the leader, any further sell off in BTC will weigh on these coins. Another factor that increases the risk of taking a swing trade at current levels.
In summary, it is very challenging not to get lured into price formations that look like great buying opportunities. What many less experienced participants fail to consider is the context of the situation. The formation looks good, but there are too many factors in the environment that reduce the attractiveness in terms of reward/risk. If price is going to reverse back up dramatically and return to the bullish momentum that we are all familiar with,it will offer plenty of opportunities to get back in at much more attractive reward to risk ratios, even if the price is higher. I have no problem taking more aggressive entries, but only when the context favors the position, and at the moment it does not.
Comments and questions welcome.

BTCUSD Perspective And Levels: Room For Lows.BTCUSD Update: Since this market is leading the entire coin world, it is a good idea to gain some perspective on where this market can go in order to better evaluate the risk of your positioning in the alt coins.
Let's begin with the current momentum since the recent price spike may have some people confused. The push back up to 3875 is just barely above the 3723 resistance (.382 of the bearish swing), and now price is retracing. A retrace to test the low is not unusual and can possibly offer a buying opportunity. The key support area for this scenario is 3319 to 3171. If price can reverse in this area, then a broader higher low structure will be in place and offer a short term (swing trade) opportunity with a conservative target. If this scenario unfolds, I expect the alt coins to follow. Reversal formations within the support area are the key requirement in order to define risk.
What happens if price falls through? Great question I'm glad you asked. If price pushes below 3171, then it is likely to retest the 2980 low. If that breaks, then that opens the door to a retrace that can revisit the 2497 level which is the bottom of the zone. This support zone is the .618 of the entire previous bullish swing and would be a convenient level for a broad Wave 2 to bottom. More on Elliott Wave in a moment.
If this market presents the scenario where this support zone breaks, the next support is 1930. Yes it sounds a little extreme, but it is the 2.618 extension projected from the 5000 high. I am NOT saying that the market will test this low, but IF it presents this scenario, then there will be some great investment opportunities in the alt coins in my opinion.
In terms of Elliott Wave, this appears to be a 3 3 5 correction with the current spike being 4 of C which means there is a greater chance that Wave 5 of C unfolds and as we have seen , Wave 5s have a tendency to extend. That is why I mention 1930 as a possibility. 1930 also happens to be the bottom of the previous Wave 4 when the market was still in the bullish structure if you look further back on the chart.
Within this bearish context, it is very important to wait for confirmations and have conservative short term targets for swing trades. Investing, as I have emphasized before is a different strategy that contains different risk parameters. If you are investing for the long term, then you must understand the risks, and see new lows as an opportunity and not have to worry so much about precise entries.
I am using this chart as a reference point for both swing trading and investing. As a swing trader, I am waiting to see if this market can stabilize somewhere within the 3319 to 3171 area I and will be watching cheaper coins like ETH and LTC for short term trades with conservative targets. As an investor, I am just watching to see if this market pushes lows so that I can purchase some lower priced coins for the long run which means I am buying to hold. It is a completely different strategy compared to the short term trades that I write about.
In summary, BTC is clearly leading the alt coins as evidenced by the similar chart structures across the board. If you are not trading BTC outright, in a sense you are still exposed to its price action by purchasing any alt coin, so it doesn't hurt to have some perspective on this market. Being that we are in a corrective C Wave, this market is more likely to retest the current low, if not push into lower territory before the bearish momentum exhausts itself. If a higher low forms, there may be a short term buying opportunity, but as far as going back to 5000, that is not happening until this market builds more of a base. In my opinion, this correction is a broad Wave 2 and when the bottoming process is complete (which can take weeks) that will eventually be the beginning of large Wave 3 and those of you who have been reading my analysis consistently should know what that means by now.
Questions and comments welcome.
ETHUSD Perspective And Levels: Fear Leads To Price Spike.ETHUSD Update: Price went sub 200 only to push back up to 250 in a matter of hours, along with all the coin markets. Now you know why I suggested considering a small position as an investment. The bearish momentum is not over yet, and now these markets need time to build up some supportive structures again so I am not anticipating new highs any time soon.
The initial spike back up is an interesting piece of information. BTC went below 3k only to spike back up to 3500. This type of price action often signals the beginning of a change in momentum, but not enough evidence to start opening swing trade longs.
If you read my previous report, I wrote that investing small wasn't a bad idea because there was extreme fear in the market. Sure it got slightly more extreme, but if you believe in the technology (which has not changed), then investing when everyone is hating these coins is the best time. As I wrote, there is no way of pin pointing the bottom. It is a function of understanding your risk and starting small (without leverage). I don't think these markets are out of the clear yet and still have potential to test lows again. Just remember investing is for long term and NOT a swing trade strategy.
At this point I am watching for evidence of stability (for a swing trade) and that would be in the form of a higher low at the new minor support at the 220 to 210 area within the broader 230 to 190 area. A failed low here would offer a short term buying opportunity providing that BTC is also stable. Keep in mind since this market has revisited this broader support area which is the .618 of the previous bullish swing, the broader price action will most likely be range bound and I plan to use very conservative targets for any trades that I enter.
The new resistance area is the 271 to 291 zone which is related to the .618 of the overall bearish swing. This market needs to clear that in order to show that there is any possibility of retesting the mid to high 300s. So this resistance will serve as a profit target (if the market offers that opportunity). If the market retests this resistance sooner (it is almost there) this area will serve as a level for a possible lower high which can lead to new lows if BTC falls apart again. We just have to wait and see. As far as buying now, the risk is too high.
In order to know if a bottom is truly in place, price needs to retest the lows. That is why this price spike, as impressive as it is, is not the time to get long. The retest may lead to new lows, or it may be shallow, there is no way to know until after it unfolds. This is why it is so important to define your scenarios ahead of time so that you have something to measure against instead of being sucked into the herd mentality.
In summary, investing and trading are more about psychology than anything else. Price action analysis helps to uncover clues about the crowd mentality so that probabilities and risk can be better determined before taking a position. The purpose of my analysis is to capitalize on short term price fluctuations and I have to repeat this because I realize many new traders do not understand the difference between what I am writing about and buying to hold for the long term. My plan at the moment is to wait for the next retrace and if the market revisits the 220 area, then I evaluate for buy signals for a swing trade. Otherwise I stay flat. There will be plenty of opportunities to get long.
Comments and questions welcome.

ETHUSD Perspective And Levels: Lower Low Into Major Support.ETHUSD Update: 230 support area has been reached while all the coin markets sell off. This is actually a great time to start considering accumulating small positions for the long term even while there are no signs of buyers.
Momentum is bearish and price has been making lower lows along with the rest of the markets. BTC is clearly leading the way. You can blame it on the news, or whatever other catalyst you like, the important thing is that price is beginning to revisit attractive levels. This is where the people who were way too bullish at 380 get pushed out of there positions, especially the ones who used leverage and have no idea how that works. A few weeks ago it was hard to imagine this market testing the 230s, but as you can see, anything is possible and why I always focus on risk and not reward.
The 230 support zone is relative to the .618 of the recent bullish swing and is a wide area with the bottom boundary at 196. At the moment, since there is no sign of stability in any of these markets, it is possible to test that level. And if you zoom out further and look at the entire price history on a weekly chart, you will see that the .618 relative to the overall initial wave is the 162 to 94 area. I am not "predicting" that this is the next support, but it does provide some perspective in the sense that there is room for this market to test lower prices and it would still be normal.
The fact that this market broke the 296 level and has not found stability, followed by retesting the current support, signals that this market is more likely to see more of a range bound environment in the near term. This means short term positions should have conservative profit targets, like the low 300s, etc. This market no longer has the structure in place to see 400+ in the near term. The market now needs time to stabilize and consolidate.
When markets are full of fear, as long as they maintain their fundamental value (in this case the technology hasn't changed), the opportunity to start accumulating a small position is not unreasonable. This is not a technical play, or a short term trade. It is buy some for the long term. Months and years not days and weeks. Even though there is no technical bottom in place, and there is still room to go lower, as long as you believe in their future, then this situation as a whole is a buying opportunity. The key is starting small. For example if you buy 1 coin at 230, and it goes to 130 in the next week, is that really going to hurt you? Also you have to keep the this process and strategy separate from your shorter term plays. It is more of an investment. Remember, the goal is to build onto the position as the market stabilizes. By starting small, you are limiting your risk and will have the ability to take pain. If you start big, or get too big too fast, or use leverage, you will get yourself into trouble quickly.
In order for this market to show any sign of stability, the first thing that I need to see is a break above the 293 level. This is the .382 of the entire bearish swing and an overlap of the .618 of the most recent bearish swing. IF price pushes above that level, that would be the first step to looking for more signs, like a higher low. I must emphasize this level is not a buy trigger. Just a point of reference that will signal the bearish momentum is losing steam. Until that happens, any minor retrace is more likely to unfold as a lower high.
In summary, do not get sucked into the hype. As long as these coins maintain their purpose, and they are not rendered obsolete by some new technology, you have to see beyond all the drama and think against the crowd, ESPECIALLY this crowd. I am staying out in terms of swing trades until these markets can stabilize and when they do, price action will provide the right clues. And now is the time to think about a core position, not at 350. You will not get the bottom. Remember: small.
Comments and questions welcome.

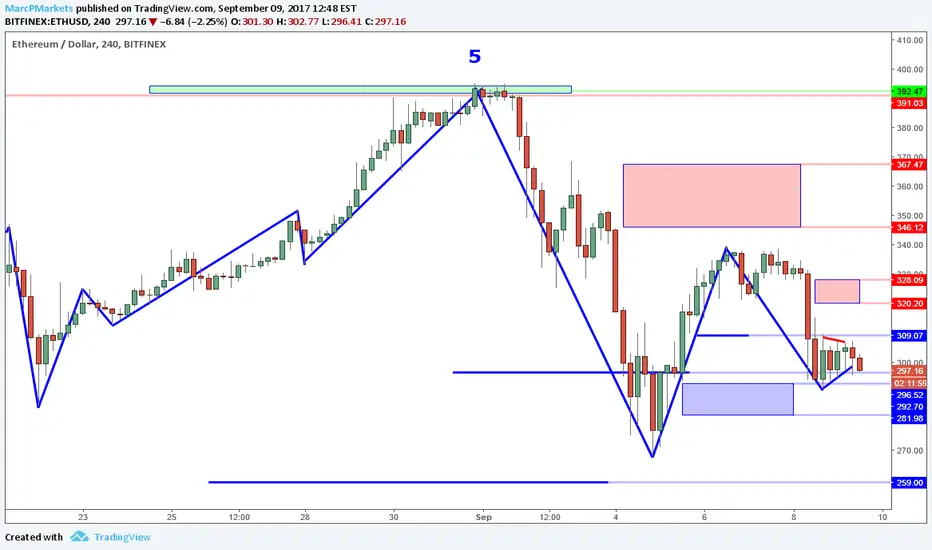
ETHUSD Perspective And Levels: Room For Lower Prices.ETHUSD update: Bearish momentum continues as price revisits the 260 support level. I have been stopped out of my long, and will now wait until the market can show new signs of stability. At the moment, the next area of support is the 230 zone which is very possible until the momentum changes.
I have been writing about the 296, 260 and 230 levels for some time now. Now that 260 has been tested, that is a clear sign the bears are in control which can take prices back to the 230 area as well. The BTCUSD chart is also very similar and still has room to see lower prices.
Even though I have been stopped out, I am still bullish and now waiting until stability returns to these markets. If this is a Wave 2 of a larger 3, it can retrace quite a bit before seeing a significant reversal. Keep in mind I do not know how low these markets will go, and I am flexible enough to get back in if I see the right conditions.
The kind of price action I am waiting for requires 2 conditions. First a resistance needs to be taken out. These usually come in the form of a lower highs that get broken and as of right now, the 282 and 296 levels (old support, new resistance) will have to be broken. Second, after price breaks the resistance, it will be a matter of waiting for a higher low or failed low and that is the point when I can evaluate risk for a new position. When the market shows signs of continuous bullish momentum, there will be plenty of opportunity to add to the position.
So my plan is as follows: I will be watching the 260 area on the 4 hour time frame for a break of a lower high resistance followed by a reversal structure like a higher low or double bottom. If these appear, I will consider putting on another small position (25% of my normal beginning size) so that if I am stopped out again, the loss is proportionally small. If price falls through 260, then I will be watching the 230 area for the same kind of price action. Just to be clear, this process can take days if not longer.
Also at the moment, 310 which is the .382 of the overall bearish swing is a key level for defining momentum and as long as price stays below this level, I will expect any bullish swings to be limited in proportion until price action proves otherwise.
I have been getting all kinds of PMs asking me about news, and the China situation. Again the news just pushes prices faster. Corrections are normal and required in order to shake out the weak hands and provide new opportunities. In terms of the big picture, any major sell off is a buying opportunity for long term positions in my opinion.
In summary, as bearish momentum maintains its hold on all of these markets, the lower support levels like the 230 area now become the focus. The key to speculating in any market successfully is being prepared and defining a scenario ahead of time which is not a prediction. If the market presents the planned scenario then great, you follow the plan and if it doesn't, you stay out. Many people still do not understand that there is a high degree of randomness to price action which is the reason why no one will be right 100% of the time and also why we are always evaluating probabilities.
Comments and questions welcome.

ETHUSD Perspective And Levels: Stability And Trigger.ETHUSD Update: Stability forming now that two higher lows are in place at the 267 and 276 levels. This allows for a clear definition of risk and a scenario that can lead to a new long position.
At the 267 level there is a bounce that retraces back to 276. This formation is a broad higher low which indicates strength returning to this market. The bearish momentum has failed to push new lows. Plus there is a smaller higher low at the 287 level which signals further stability because higher lows often lead to? Higher highs. Two formations like these within the 296 support level which I have been writing about for a few reports now, are the signs of stability I have been patiently waiting for.
If you observe the ETHBTC market which has been a great source for additional clues, it also has a clear higher low formation in place which adds to the stability argument even more.
What is most important about these structures besides where they appearing is that fact that the market has offered clear reference points to define risk from: The 267, 276 and 287 lows. With this information I can determine if a long swing trade is worth taking. The next question is where is the entry and the target?
A break above 310 is a new long signal because that indicates bullish momentum returning. A long position at 310 with a stop in the mid 280s and a target in the mid 340s offers just over 1:1 reward/risk (and that is being extremely conservative). If there is any positive catalyst along the way, that can push prices further, but for now I am going to use the 350 area as the initial target. The beauty of this kind of trigger is if price never breaks 310, then that means bullish momentum is still limited and there is no trade and no risk taken.
IF instead price decides to break below the key support levels relative to these higher low structures, like 287 or 276, then that would signal bearish momentum is still present and I would wait and see where the market stabilizes again before any further evaluation. Also a break below the 267 low will negate the possibilities of the present stability completely, and open the door to the 230 support zone. This is why it is very important not to take a position too early and wait for a trigger. (Unless you enjoy pain).
Another point I want to make is this: my previous reports have been bearish, and now this one is much more bullish. I do not base my observations on feelings, or my opinion, or what anyone says or writes. I base my outlook on what clues the MARKET provides and I am flexible enough to recognize new information while not getting stuck on ANY opinions. The market doesn't care what I think. So I don't, I "listen" instead.
In summary, this is the kind of price action that my plan forces me to WAIT for before taking a new position after a sell off. It is very challenging because it requires a ton of patience to wait for (it has been a number of days). The only way to achieve this kind of patience is with a well defined plan, and not getting sucked in by the hype, the price noise and your own impulses, fears, and bias. If the context of these market conditions were more bullish, (like they used to be) then the entry criteria would be less restrictive so this is why context is so important for the analytical elements that I employ.
Comments and questions welcome.
ETHUSD Perspective And Levels: 260 Support Test?ETHUSD Update: 280 support revisited while bearish momentum continues to push prices lower. Even though this correction still has room to test even lower prices, it is normal and will offer a better opportunity to buy, just not yet.
As I wrote about a few reports ago, 320 was a significant break and maybe now you can see why. If you look at a weekly chart, it is basically the low of the previous week's Shooting Star like candle. If you read my reports at that time, I describe the bearishness of the signal, and why I would not even think about buying. The current weekly candle closes today and if it closes the way it looks now which is near the low, especially with no wick, then this signals lower prices are still more likely.
At the moment I am watching for a retest of the 260 support to see if price can stabilize. A break below opens the possibility to retest the 230 support zone which is related to the .618 of the recent bullish structure. What adds to this argument further is the lower high structure at 340 (which I talked about in previous reports), the wave count, and the ETHBTC chart which offered plenty of warning ahead of this bearish momentum.
In terms of Elliott Wave, I am counting the previous bullish 5 wave structure as a 1 of a larger 3. The current corrective legs are part of the subdegree Wave 2 which implies that a larger Wave 3 is likely to follow once this correction completes. Buying too early in anticipation of subdegree Wave 3 of 3 is extremely risky because Wave 2's can be deep corrections. I would rather wait until the bottom is in place and buy at slightly higher prices because at least I will be able to evaluate my risk more effectively than I can at the moment.
Also pay attention to the ETHBTC market because it is testing the .06562 triple bottom area. If that level breaks, that will also add to the bearish momentum that can take this market to the lower supports.
In summary, my plan is to let the bearish momentum play out and wait for stability at one of the lower support levels before I do anything else. Right now in order for me to get long, I need to see bullish momentum return which means price needs to show evidence of a reversal ALONG WITH a change in momentum. If price revisits 260 or lower, that doesn't mean I will get that low price. When momentum changes, prices will have to be higher in order to confirm the buyers are back. Keep in mind these evaluations are short term in scope and if you plan to hold for more than a few weeks, or months, then you can start building a position at any low, just make sure to have a very well defined investment plan and don't get too big too fast. The bullish momentum will return and when it does, the market will provide the proof. Until then, I wait.
Comments and questions welcome.

ETHUSD Perspective And Levels: Bearish Momentum Continuation.ETHUSD Update: Price action is consolidating within the 309 to 290 area and triangles like these are typically continuation patterns. Even though smaller time frames are showing some signs of reversal, the overall momentum is still bearish.'
When markets are in clear bullish trends, it is much easier to decide when to buy, but when the environment becomes conflicted and noisy, this is when you really need to understand price action. These environments are full of false signals and very easy to buy too early, especially if you have a limited understanding of TA.
Price action in this market has been behaving as anticipated around the projected support levels, but the reason why I won't start buying is because momentum has not changed. Lower highs often lead to lower lows and in the face of a small triangle, I would rather stay out until there is clear evidence of bullish momentum.
Remember a reversal does not guarantee price will go back up. The reversal is the first step that indicates momentum is in the process of changing. There are bullish reversals present on the 1 hour time frame but since we are facing a lower high, I need more confirmation and that will come in the form of resistance levels breaking. Strength breaks resistance levels and the price points that will confirm that bullish momentum is back is 310 and then the 320 to 330 area which is related to the .618 of the recent bearish swing. IF those levels are taken out, buying on pullbacks will be more reasonable. In fact a break above 330 will confirm the 290 area as a higher low which would signal further strength.
Since the market is still showing bearish momentum, the more likely scenario based on the clues on this chart, is a retest of the lower supports that I have been writing about which are the 291 to 282 area and the 260s. A break below 290 will more than likely trigger more selling and IF that happens, I will be watching these supports for stability before doing anything else.
In terms of Elliott Wave, this price action can be part of a subdegree Wave 2 of a broader Wave 3 (The previous 5 wave structure was the first wave). Corrective waves can be very confusing and for the sake of simplicity, I am not labeling them, but if this is a Wave 2, it only has two legs in place which means there is a greater chance of one more leg which is Wave C. If this wave unfolds, the 260 level is a very reasonable area for it to complete and there is even a possibility of a revisit to the 230s. If price actually retraces that far, that would be a good buying opportunity, especially for long term holders (Upon validation).
In summary, although some bullish signs have appeared at projected levels, bearish momentum is still present and the reason why I will not buy at the moment. The small consolidation, plus the wave count make for a situation that carries too much risk for any new long position. If the market proves otherwise, then breaks above 310 and 330 will signal that change and I will even consider buying a small position at that point. I am not trying to get the best price, I am trying to get in line with the momentum so that chances are the trade will go the right way with the least amount of pain. The market will decide and then I will adjust to the new information.
Comments and questions welcome.
ETHUSD Perspective And Levels: Watching For Reversals.ETHUSD Update: The 320 break signals the return of bearish momentum and confirms the lower high formation as I described in my previous report. ETHBTC also offered a heads up with it's resistance failure that I mentioned as well. The question now is can this market find support at the projected levels and form a broader higher low?
Compared to my average number of views, my previous report was way below but for those of you who took the time to read it, it described what is happening now. 309 was the first support level to watch for stability, and price fell through like it wasn't even there. And this is exactly why I do not place buy orders at levels, because they are random until the market proves that there is a reason to buy there. The validation section of my trading plan is what helps me filter out this type of situation.
The next area is the 296 support which which is more in play at the moment. As I have written about previously this is the .382 of the entire bullish swing and since it is a proportion of such a large price move, price action around this level will be very noisy just like it was the first time it tested this area (and went below 270). And that adds some weight to the 292 to 281 support zone which is related to the .618 of the recent minor bullish swing.
Just below that is the 260 support that I explained previously also. The recent 4 hour candle is large and even though there is some retrace (wick) I will take that as a clue that this market is more likely to test the lower supports. Large candles are a sign of strong momentum so it is reasonable to expect the next few sessions to be bearish at least (unless there is a dramatic recovery during the next candle). Other factors that support this bearish argument are the lower high confirmation at 340, AND the failed high on the ETHBTC chart.
As I also mentioned in my previous report, in order for me to buy, I need to see a failed low, or higher low and it would be helpful if the market offered that structure at one of the projected support levels. IF the market can stabilize in the 292 to 281 zone, then that would signal more of a range bound situation. If I can get long somewhere in the lower part of the range, I will be targeting the 325 area at least initially. In particular I will be watching the price action for a higher low or double bottom on a smaller time frame and will be considering the mid 250s for stop placement. Price structures of this kind will negate the bearish momentum that is present at the moment. Otherwise I stay out.
I do not know if any relevant news came out, and the reason why I don't check or write about news is because price tells me everything I need to know. Price action made me very cautious about the previous up move and I reiterated it over and over. If the market wants to sell, it will sell. And again this price action was setting up before any news. News only serves as a catalyst and helps the market move in the direction of it's intention faster. One of the basic foundations of technical analysis is that the market discounts everything and that includes news.
In summary, the bearish momentum that was building up in the price action played out to a point. The confirmed lower high opens the possibility of testing the lower support levels that I wrote about previously. Keep in mind, the overall trend is still bullish, this market is just going through a normal correction and upon stabilization will offer another buying opportunity at attractive reward to risk ratios. Remember that the support levels are proportionate to the swings that they measure, and they provide reference points to evaluate for particular price action (like a double bottom). They are not buy prices to just set orders for. The best thing you can learn from my analysis is how to anticipate instead of react, because without that ability, you will always be chasing.
Questions and comments welcome.

ETHUSD Levels And Perspective: Consolidation Into Support Zone.ETHUSD Update: 207 resistance that I reported yesterday clearly held and selling momentum ensued. Bears are still in control for the moment. And with the additional price structure in place, there is more information to consider.
Overall, this market is consolidating which is noted by the converging trend lines. No surprise since there is a ton of uncertainty going into these next two weeks. A thread on Reddit explained the "User Activated Soft Fork" (UASF) which I thought was supposed to happen on 8/1 (BIP 148) is actually happening on 7/23, along with some other confusing details (I don't even know if this information is reliable). This is a perfect example why fundamentals are NOT good for short term trading. What this information does tell me is how confused and uncertain these markets are which is in line with the ongoing consolidation (technicals don't lie). This also tells me not to hold anything into those dates and to let the market work itself out. So from here I will consider day trade opportunities, or plan to exit any possible swing trades before the 23rd. (Unless I can find more reliable information).
Since the selling momentum continued off of 207, there is a new minor overhead resistance in the 203 area that also needs to be compromised before I can start looking to buy. These levels can be used for day trade targets or shorts if you are so inclined.
Also at the moment, price is at the 193 level which was a previous resistance (inversion) and has acted as a support previously. This level and the 180 to 190 range just below (which relates to a .618 Fib retracement of the broader structure) still serve as a location for bullish reversals. I prefer chart pattern reversals on this time frame like the examples that appear to the left of the chart (see double bottom). I would like to see one of these appear at the current level or in the range below. That is the first step, then I need to see a break of 207 which will signal buying momentum has returned, and finally I will be evaluating the subsequent retrace for a trade entry. That is my plan in a nutshell. 180, 169 and 160 are my reference points for a stop, but I cannot evaluate risk until my setup appears.
In summary, the major trend is still bullish according to price structure, but all these markets are caught in a mud pit of uncertainty. During these consolidations, projecting relevant support and resistance levels is very helpful because they highlight where to expect reversals, and how to navigate a broad range bound market. Since there is no trade setup, my goal for these evaluations is to provide some clarity and perspective.
Comments and questions welcome.

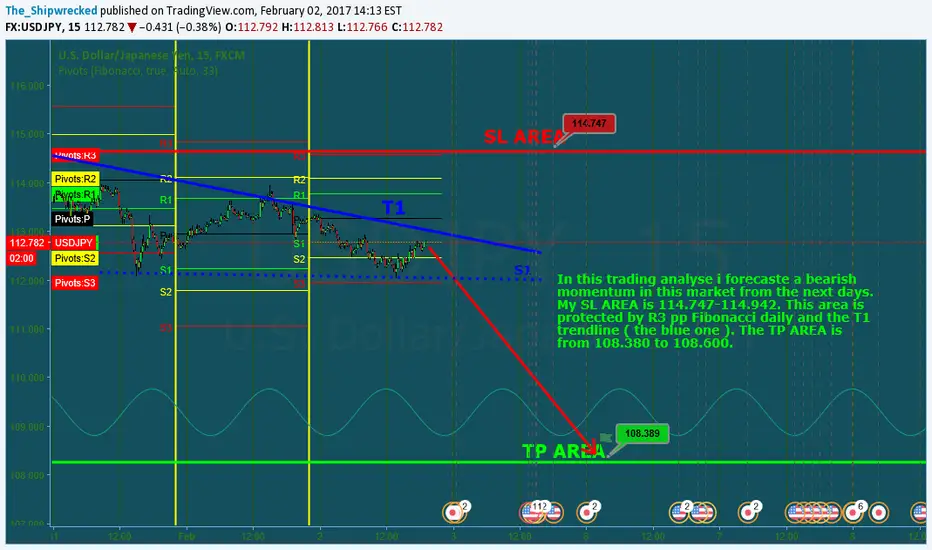
USDJPY next to a bearish momentum: SELL 1 week trade timeHi everyone,
I was looking at USDJPY this morning and after a technical analyse i got at the conclusion that a bearish momentum is near. I think that looking at 1D chart without any indicator or draw tools would be even enough to understand the near massacre of the bull-minds traders.
Anyway i could be wrong... :
The market could have a pullback on S3 pp or un S1... this area will be very protected by the buyers... a lot of people will see an opportunity to buy here, hopping in the retrecement and that a bullish trend will start. I have the trendline T1 to protect my trade and also R3 pp ( you can see them on the chart ).
Anyway, if i'll a bullish trend starting ( if it's gonna break T1 and after it'll have a test ceiling on the trendline ) i could also change the trade swiping in a long. I hope this is not gonna happen.
As i said you first the main points were i could change the position are:
1) test ceiling on T1
2) pullback on S3 pp or S1 ( are quite near, you can see them on the chart also )
This trade is weekly trade ( more or less ) but using this analyse i'll also open Couwntdowns and Binary Options positions. My gains are 90% from this ones but i can't publish the entries and exits of this trades due to the slowly tool that is this idea chat. But, if you're interested in Couwntdowns and BO options or interested in the upgrade of my trade, write me in p.m. without any problem... I would be happy to help you at any question.
I hope this trade will help you,
Delta B.
Bearish due to series of Doji like candle stick.Sell on strength as upward momentum has been rejected for a series of times. wait for pullback before entry ...I will update this as soon as possible(Near terms).