Comprehensive GBPUSD Analysis Ahead of UK General ElectionThis is a comprehensive analysis of the GBPUSD ahead of the UK General Election scheduled for Thursday, 4th July 2024. The chart has been marked to highlight key levels (Decision-Making Points) on the weekly, daily, and H4 timeframes. Below is a summary based on the price analysis:
Weekly: Strong Bearish
The wave structure on the weekly chart indicates a bearish expectation.
Daily: Bearish Wave Structure
The daily chart shows a second bearish wave structure with a lower low.
H4: Bearish Wave Structure with Pullback
The H4 chart has completed a bearish wave structure and shows a valid pullback.
H1: Bearish Momentum
This morning, a momentum low was made, and the current pullback aligns with the second bearish wave structure.
Bearishmomentum

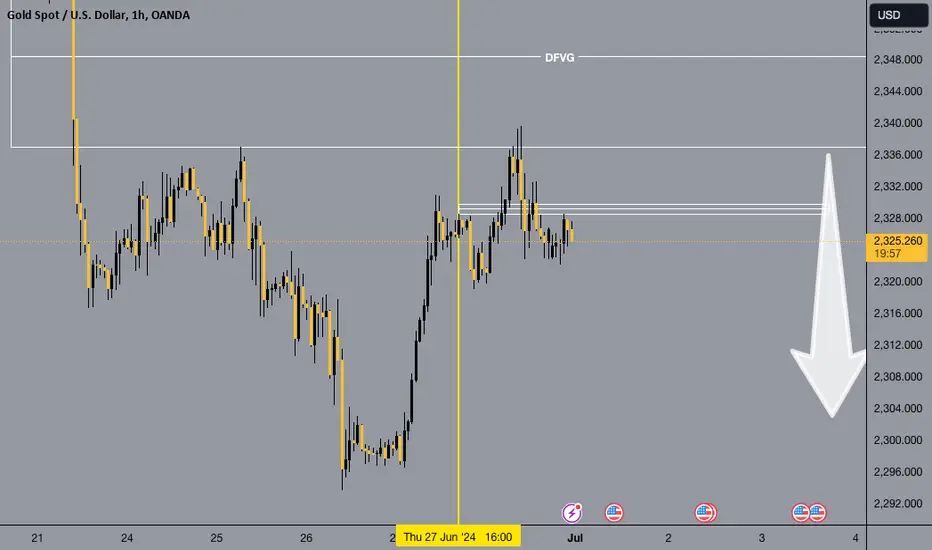
XAUUSDWhat i'm looking at. daily fvg hit, 1hr fvg hit, markets is at an ath, mitigation and imbalances have to be filled before going higher. i'm looking for drop to at least the bullish order block @ 2,300.908 or there abouts.
BTC USD: TRAPS ARE EMINENT~! BUT NOT WITH US!!!BTC USDT
Bullish Sentiment
a. BULLISH Back to 67.7K to get out (LAST CHANCE BEFORE WE KISS NEUTRAL AND GREED METER GOODBYE)
b. BULLISH to repect MA and Trendline retracement.
c. Shortterm Bullish to BULL trap and feed bears!
Bearish Sentiment
a. MStrat just bought; money for sharks and scalpers.
b. Increasing interest to short the market due to inflated balloon of longs.
c. Sharp knife drop eminent once we receive a capitulating news somewhere 66 67 and 68k at least
d. This knife drop will give you 3 candles signal in 1D tf. and a clear patterns in 4hr down to 15hr tf.
e. It will fail to reclaim a higher price than 68.8k body close. 69K is too funny to reclaim especially with a strong candle close in weekly. No one can predict that if that happens.
media.discordapp.net

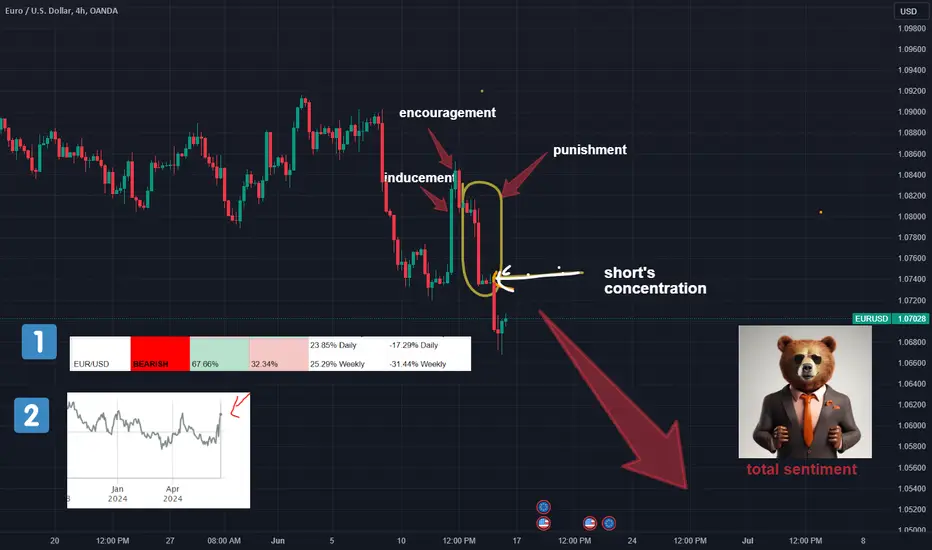
EURUSD Cutting-Edge Analysis? like a "loot button" ))))Hi guys. Let me share some thoughts on the prospects of the EURUSD pair
Retail's been building up long positions and cutting short ones, which suggests a strong bearish sentiment (think "sell when everyone's buying").
The same bearish mood is lurking in the options market, where folks are aggressively trading "naked shorts" and combinations. However, we should note that volatility has spiked to this year's max—these bursts often trigger "stoppies" or short-term corrections, instead of following the main trend.
Visually, the "longs" have been punished, and now the market's favoring the bears. Interestingly, the highest concentration of bears is after the close of a bearish candle—remember your tech analysis books, that's a "candle with a big body and almost no shadows"—a 100% trigger!
I hope this summary increase your trading edge!
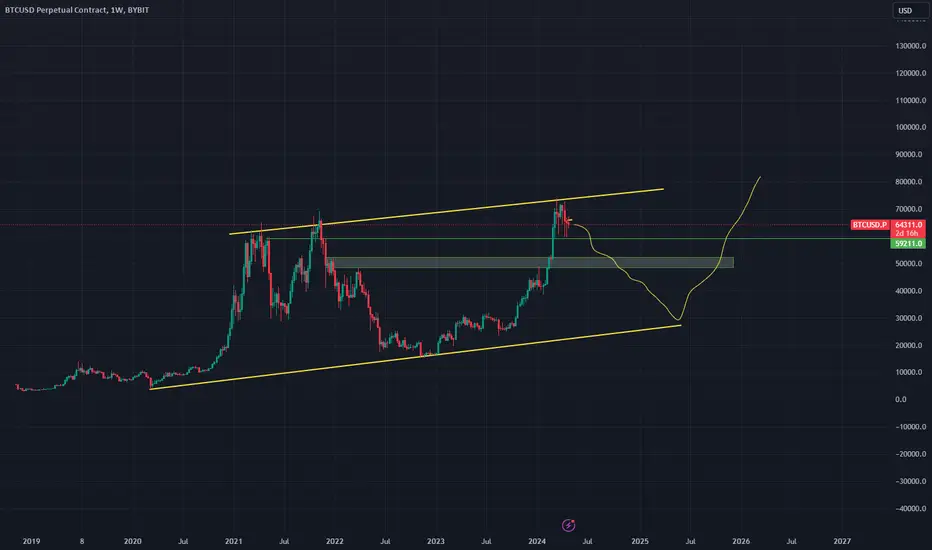
Bitcoin (BTC) Price Analysis: Preparing for the Bearish AbyssIn this technical forecast, we delve into the darker recesses of Bitcoin's potential price journey. We observe a concerning configuration on the BTCUSD chart where the currency is currently grappling with critical support levels.
Current Dynamics:
The price has recently retracted from a peak, teasing the possibility of a significant downtrend.
A descending channel formation can be seen, indicating a tightening bearish grip on the market momentum.
Worst Case Trajectory:
Should the price break below the sturdy support zone, indicated by the green rectangle, we may see an accelerated drop.
The price could tumble toward the lower boundary of the channel, a line that has historically acted as a gravitational pull during bearish trends.
Key Levels to Watch:
Immediate support resides within the green rectangle zone. If this fails, the descent could be sharp and unforgiving.
Further support is hypothesized by the extended yellow trend lines, outlining a worst case range that could spell distress for bulls.
Projected Pathways:
The worst case scenario envisions a stark descent, followed by a period of consolidation below the current support.
A relief rally might attempt to reclaim lost ground, but the overarching trajectory remains bleak in this hypothesis.
Conclusion:
While we must tread with caution, preparing for a bearish eventuality is prudent. Investors and traders should brace for volatility and consider the historical behavior of the market during similar patterns. Vigilance is key as we watch for potential support breaches that could confirm this grim forecast.
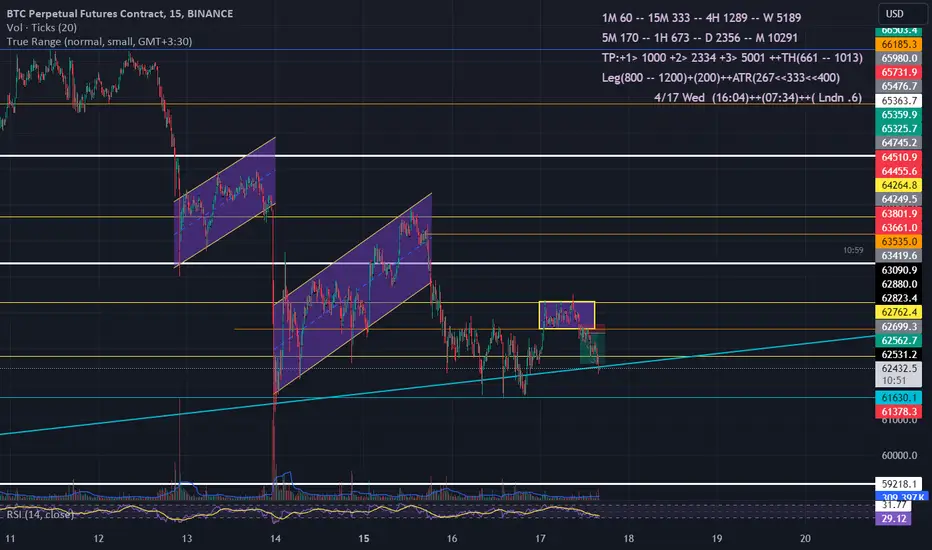
Bitcoin AnalysisIf the price of Bitcoin stabilizes at 61630.1, then the market is expected to fall to the range of 592220.
But this depends on BTC.D and USD.D, which are currently at critical points.
Also, for the rest of the coins, when the BTC trend line breaks, we will expect the price to drop.
BINANCE:BTCUSD.P
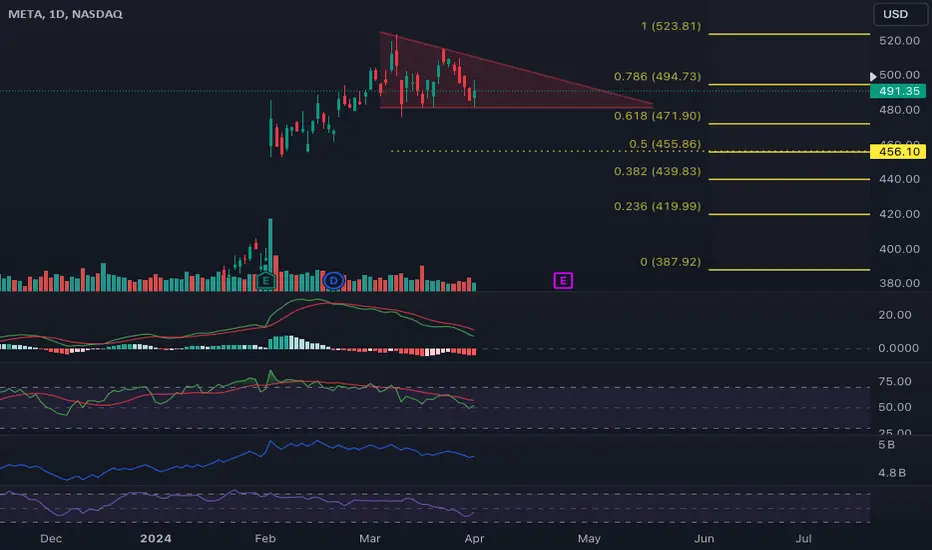
META to $455Overview
META is approaching a possible landslide that may take the share price to around $455. An influx of insider liquidation paired with healthy market skepticism supports the possible correction.
Fundamentals
Overall the company appears healthy according to their 2023 Annual Report. The only filings that I found concerning was the abundance of 144s that indicate insider liquidation. As of late, insider liquidation has been heavily present amongst most of the Magnificent Seven companies (GOOGL, AMZN, NVDA, and TSLA)
Technicals
A bear flag is forming after the rally momentum rounded out and is now beginning to develop a descending triangle. The oscillators don't support a breakdown at the current time so a possible bounce back to the triangle's resistance line around $505-510 is possible as the pattern continues to develop.
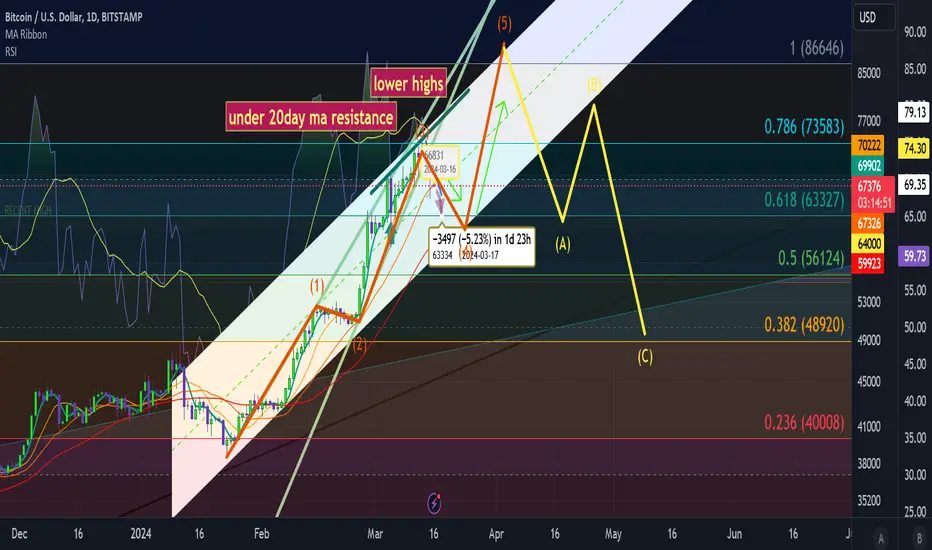
Corrective wave potential, will this be ATH Currently bitcoin is stewing while cooling down, getting ready for what may be the 5th and final impulse wave, resulting in what possibly could result in a corrective wave that could drop us out of the channel and result pushing us potentially into the low 50s or high 40s
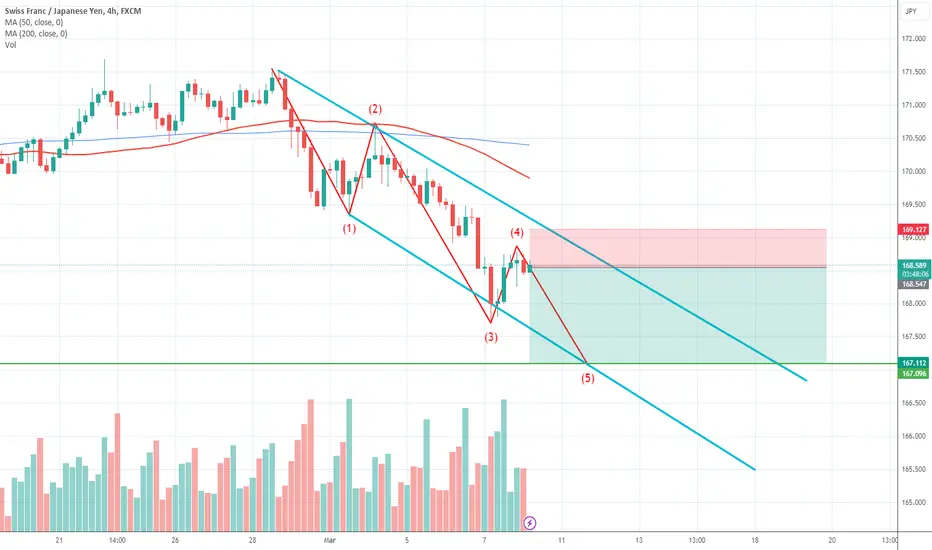
CHFJPY Short opportunity with 2.5 RR ratioHello guys,
Here I am again,
According to Elliott Wave Theory, CHFJPY appears poised for a downward movement based on the formation of a five-wave impulse pattern, with wave 5 about to start.
Furthermore, the emergence of an evening star pattern reinforces the potential for a trend reversal. An evening star is a three-candlestick pattern characterized by a bullish candlestick, followed by a small-bodied candle, and then a bearish candlestick that closes below the midpoint of the first candle. This formation indicates weakening bullish momentum and the possibility of a shift towards a downtrend.
Consequently, traders may anticipate a downward movement in CHFJPY as the Elliott Wave pattern start the 5th wave which is bit slower and complexed.
GL
Disclaimer: Forex signals provided are for informational purposes only and should not be considered financial advice. Trading forex carries inherent risks, and users should exercise caution and conduct their own research before making any trading decisions.
🟢🟢(GBP USD channel pattern breakout support level) short analyHello traders what do you think about GBP USD)
Technical analysis 🟢
traders are you looking 👀 big support channel patterns breakout? GBP USD 🟢
breakout support level 1.26000
retest support level pullback momentum bearish candle
1.24919)🟡 FX:GBPUSD
Short analysis signals 💯
FX:GBPUSD
Safe trade ❤🙏 plaes like ❣️ and comments follow next analysis 😀

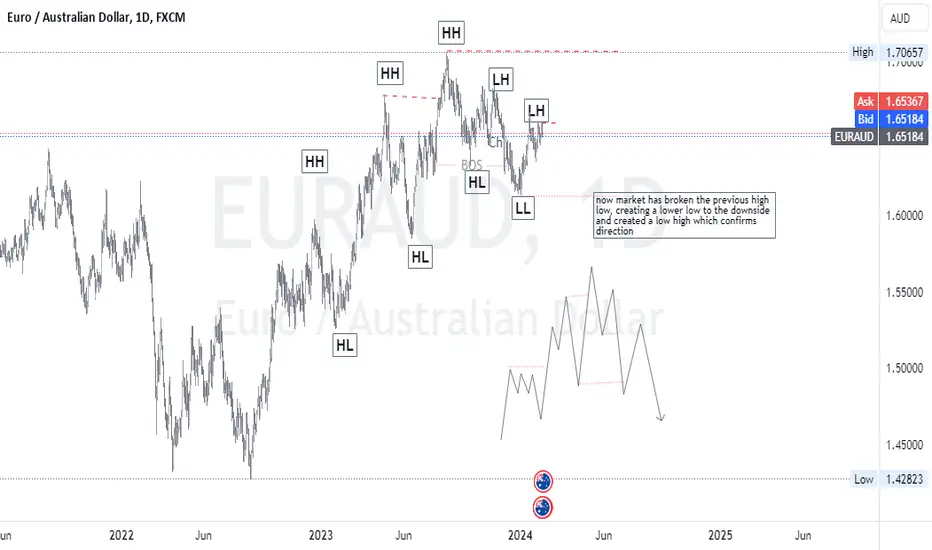
EURAUD SHORTnow market has broken the previous high low, creating a lower low to the downside and created a low high which confirms direction.
SEIUSDTSEIUSDT is in strong bearish trend and also form bearish flag pattern. Recently the instrument has break through important support zone.
Now the price is trading within the bearish flag and seems like it getting ready to break it.
Will the sellers took benefits from these bearish confluences?

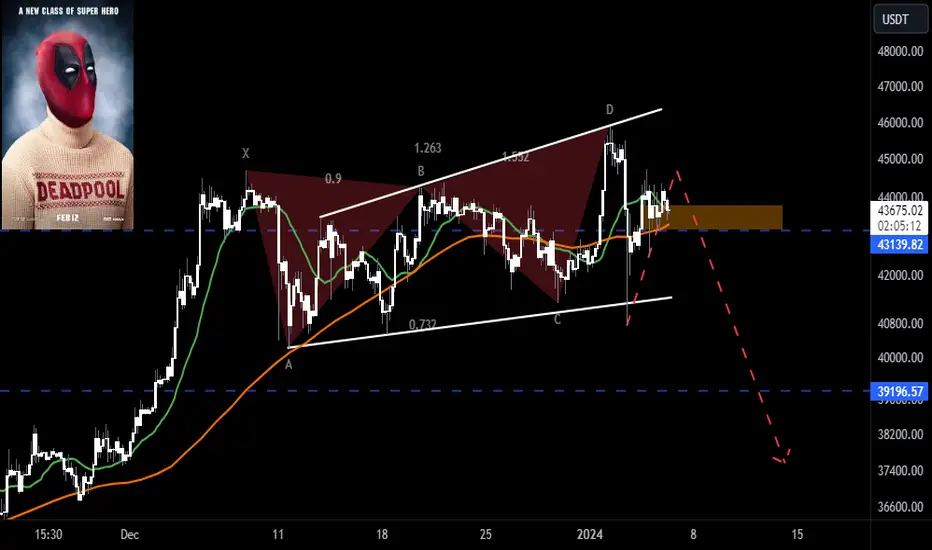
📈Bitcoin price correction / Targets for the Bearish market📉BINANCE:BTCUSDT
COINBASE:BTCUSD
Hello dear traders. Let's make it simple.
Bitcoin will retest lower levels around 43K. (But the most important dynamic level is the Daily Bollinger midline.)
If the price breaks below the specified area, Bitcoin can fall towards lower targets of $40,000 to around $37,500.
Many analysts are predicting a sell-off after the approval of the Bitcoin ETF.("Sell the news")
✌💥If you are satisfied with my analytical content, please share my ideas💥✌
✍🐱👤Otherwise, make sure you leave comments and let me know what you think.🐱👤✍
🍾Thank you for your support. I hope you will gain profit by following my analyses.🍾
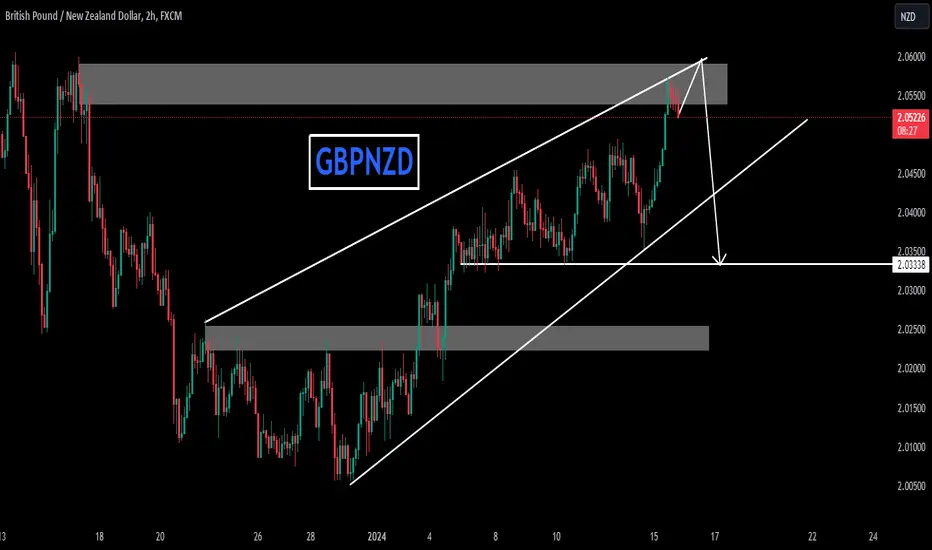
GBPNZDIs GBPNZD exhausting at resistance zone?
As the price is been on high bull run but now it seems like price is lacking bullish momentum after printing double top pattern at resistance level and bearish divergence( on lower time frame) suggesting the sell pressure is about to start.
If the bears took control , the 1st target could be 2.0300.
What you guys think of it?
ARB is most likely to go for a bearish move.ARB made a head and shoulder pattern and after breaking the pattern it is heading for a retest. If the test is successful then there is a high possibility for a bearish movement in Arbitrum

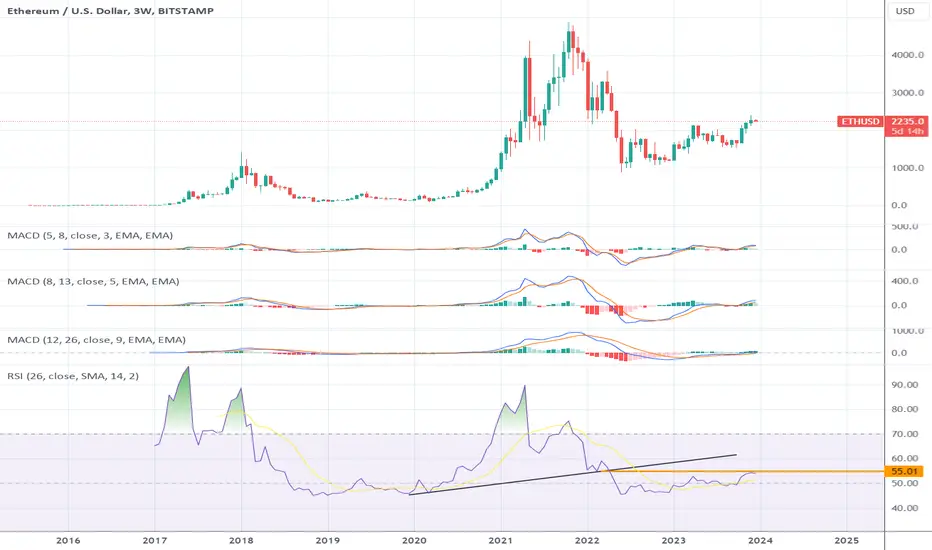
📉🐻 Ethereum Targets: $1630 & $1200 in Bear Push 🎯💥The Ethereum (ETH) cryptocurrency has recently reached a point of resistance, which is similar to what we have observed on the Bitcoin (BTC) chart. This development suggests that the crypto market could face a period of significant decline or bearish trend in the near future.
Target 1: 1630
Target 2: 1200
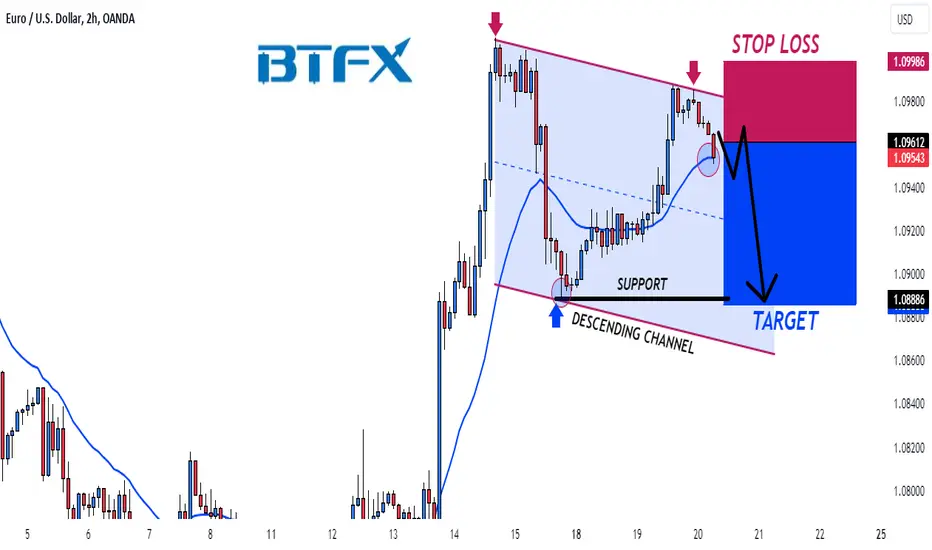
Bearish Outlook on EURUSD ContinuesHi Traders!
EURUSD continues its bearish outlook as the market is now in a descending channel.
Here are the details:
After the double top on the higher timeframe idea (see link below), the market looks to have run out of steam to break the resistance level, which provides additional opportunities for short entries to target the support level at 1.08860.
We are now looking for a break and a close below the 20 EMA for a confirmation signal.
Preferred Direction: Sell
Entry Level: 1.09612
Stop Level: 1.09986
Target Level: 1.08860
Technical Indicators: 20 EMA
Please make sure to click on the like/boost button 🚀 as your support greatly helps.
Trade safely and responsibly.
BluetonaFX
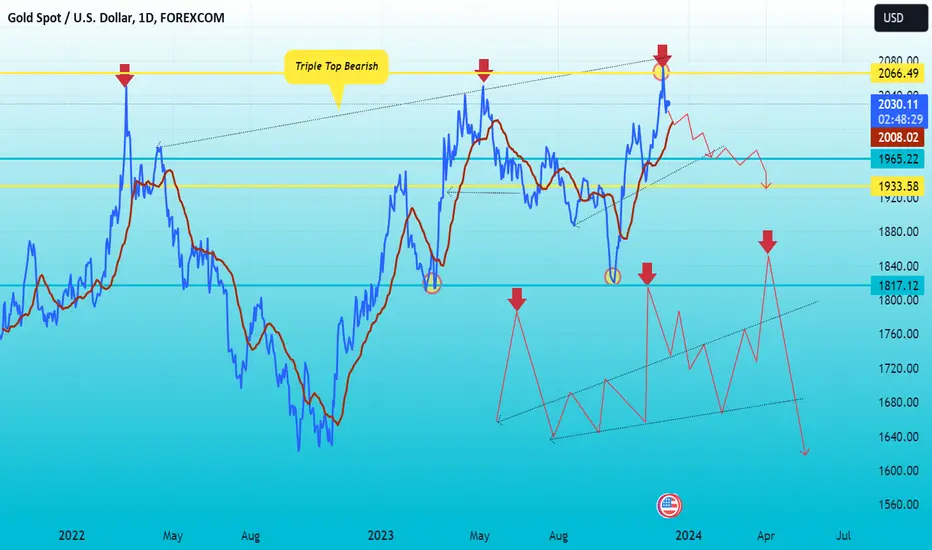
💥🔥 gold triple top Bearish) Pattern) 1D tame frame)⏰⏰Hello traders what do you think about gold?
traders gold now see a triple
Top (Bearish pattern channels
In trading.a triple top pattern is
a bearish chart pattern that indicates a potential trend 📉 reversel from an uptrend to a downtrend lt is characterized by Three conservative peaks (or highs) that are approximately equal; following by a price breakdown below a support levels.
Key levels 2000)
Key levels 1965)
Key levels 1933)
🔥EURUSD BEARISH ANALYSIS 💥💥Hello traders what do you think about euousd)?
traders euousd breakout trade line support levels Rsl retet To lower high Rsl now waiting for retest same Rsl? Now see I will down 👇 support levels ✅
Key levels 1.07948
Key levels 1.06500
Key levels 1.05500
💵 steady, euro soft as traders wager rate cuts to begin in Q1
Dec 6, 202314:19 GMT+5
The dollar held near a two-week high on Wednesday, while the euro was weak across the board as markets ramped up bets that the European Central Bank will cut interest rates as early as March.
The euro
EURUSD
was down 0.1% against the dollar at $1.0783, after touching a three-week low of $1.0775, as markets adjust rate expectations lower following soft data and dovish central commentary.
The single currency was also at a three-month low against the pound
EURGBP
, a five-week low versus the yen
EURJPY
and a 6-1/2 week low against the Swiss franc
EURCHF
.
"The story in currency markets is mostly about a softer euro," said Niels Christensen, chief analyst at Nordea.
"Yesterday's comments from ECB's Schnabel supported the market view of early rate cuts."
Influential policy-maker Isabel Schnabel on Tuesday told Reuters that further interest rate hikes could be taken off the table given a "remarkable" fall in inflation.
Markets are now placing around an 85% chance that the ECB cuts interest rates at the March meeting, with almost 150 basis points worth of cuts priced by the end of next year.

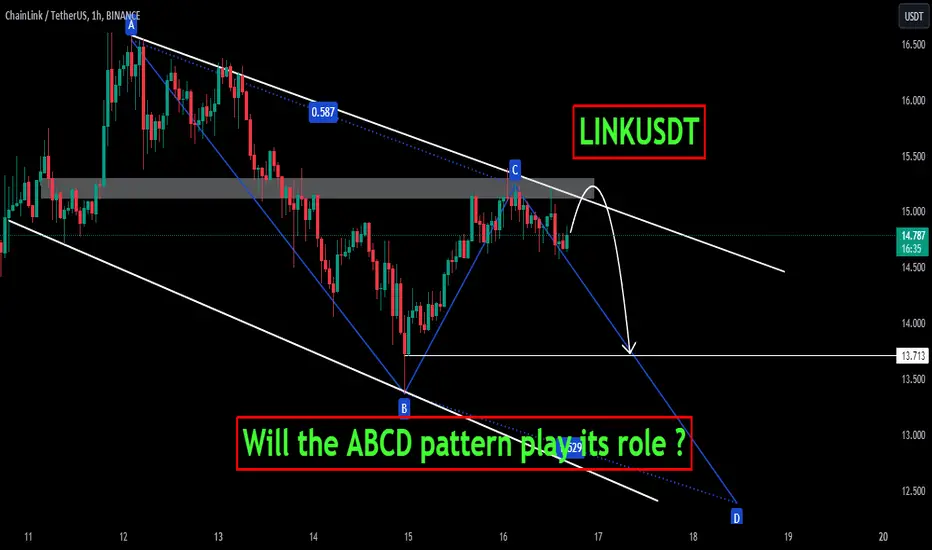
LINKUSDTLINKUSDT is trading in descending channel and printing consistent LLs LHs. Recently the price is broken the important support zone and now retesting the broken level, which is also the 50% Fib retracement level.
If the sell momentum continues the next target could be 13.70 followed by 12.50 region.
What you guys think of this idea?
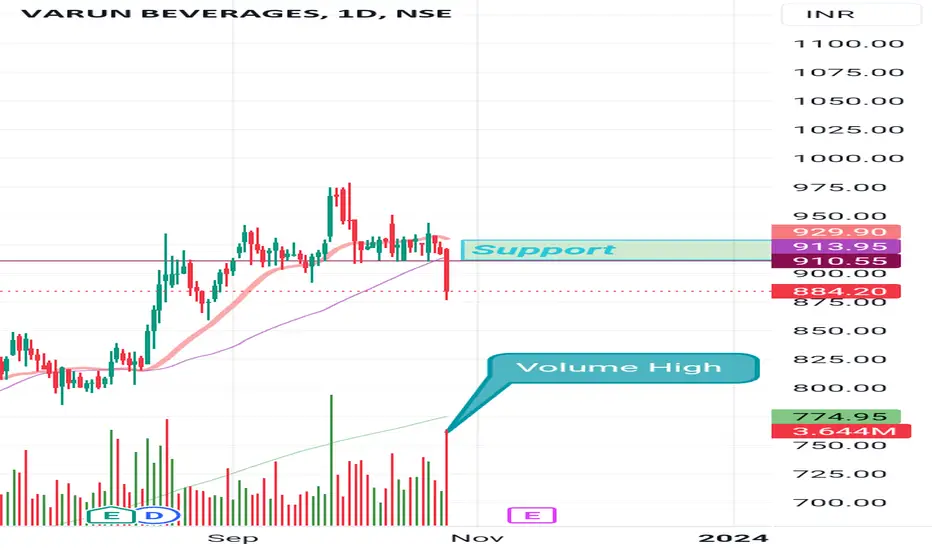
Bearish This stock have fundamental good stock
Technically this stock breakdown from major support now stock can go low level
Take own analysis
No recommendation for buy and sell
vedanta looking weekvedanta ready for touch 208 lavel
on daily-timeframe
You can set the stop-loss as your risk-reward!

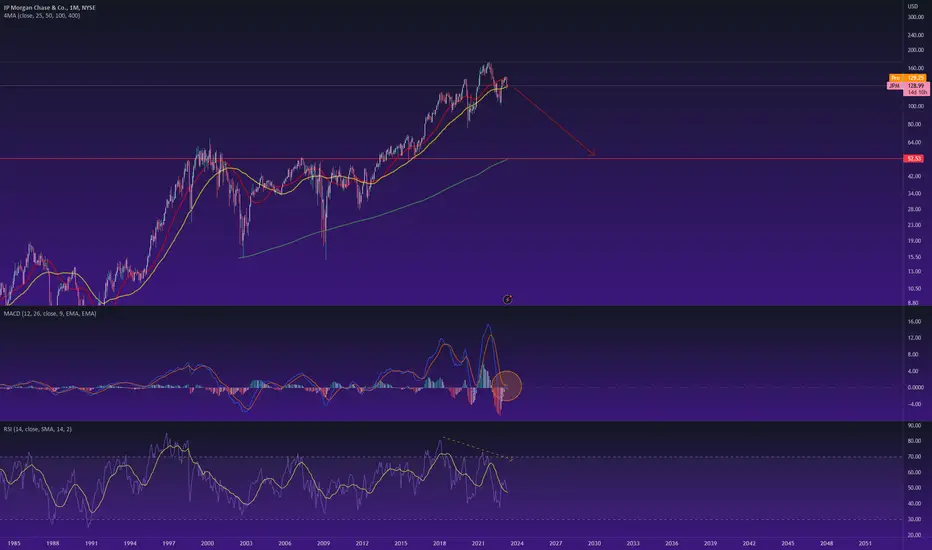
JPM - The banking crisis is not overBesides the obvious head & shoulders, as you increase the timeline from 1M to 2, 3 or 6M the more horrendous it gets.
Massive bearish divergence in RSI.
Price being rejected at the 25 MA, that will most likely lead to a death cross
MACD being rejected at the signal line after the inflated march 2020 pump (looking even more rubbish at higher timeframes)
PPO printing a bearish alert for the first time in its history at 6M (not shown)
I think it will fall to the 0.786 retracement /400 monthly MA / previous top of 50$ minimum . It can go much lower as the MACD suggests, but a 70% is a common retracement for a JP Morgan bear trend and every time it enters a bearish market a retracement to its previous top and to the monthly 400 MA is a guaranteed target.
I think this won't affect negatively the cryptomarket as some people suggest.