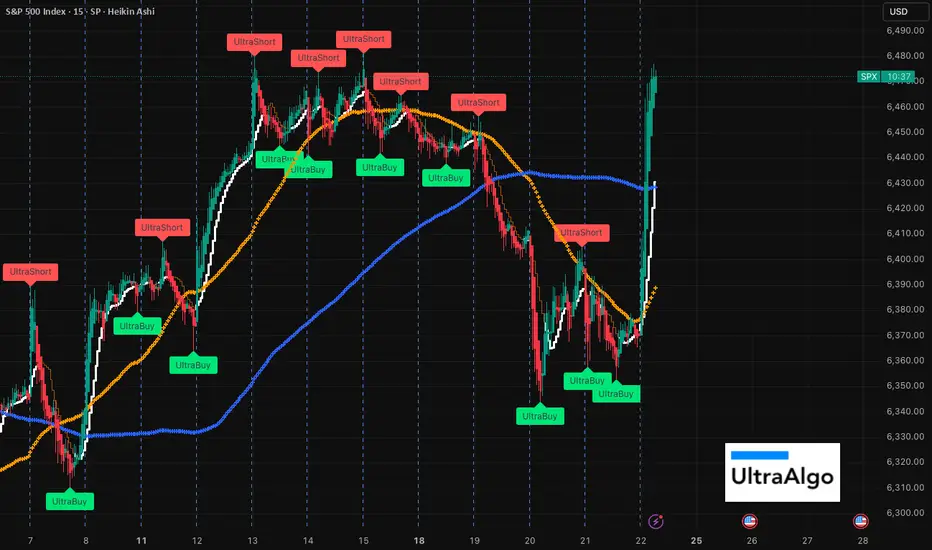
Reaching ATH and could be dropping SPXLet's not get too excited about today's news. The fundamentals are still not good; cutting short term rates is inflationary and the impact to long term rates (mortgage, auto loans etc.) will likely increase. We're reaching ATH (again) and this looks like it's short lived. Looking for a short signal soon! If you're up now, it's a good time to get out IMHO....
Bearishtrend
EURUSD Breakdown or Double Bottom? Catalysts at Jackson Hole!EURUSD has broken below the key 1.16 support ahead of the Jackson Hole Symposium, raising the stakes for both bulls and bears as markets become more aware of the likelihood of a hawkish stance.
But will it be the case?
Let's see what the possible scenarios are at play.
Bearish Catalysts :
Hawkish Fed Signals: Recent FOMC minutes and a potential hawkish tone from Chair Powell could push EURUSD lower. Rate cut odds for December have dropped sharply, and further Fed focus on inflation may accelerate downside.
Technical Breakdown: The loss of 1.16 opens the door to 1.1530, 1.1460, and possibly 1.14. No clear bullish divergence on RSI suggests more downside risk.
Geopolitical Risks: Uncertainty around the Ukraine ceasefire could weigh further on the euro.
Bullish Catalysts :
Oversold Conditions: EURUSD is approaching oversold territory, with a potential double bottom forming near 1.1530/1.1460.
Dovish Surprise: If Powell signals concerns over the labour market or hints at a pause, a short-covering rally could target 1.16 and above.
ECB Commentary: Any unexpected hawkishness from ECB President Lagarde could support the euro.
Key Levels to Watch :
Support: 1.1530, 1.1460, 1.1400
Resistance: 1.1600, 1.1660
Trading Plan :
Volatility is likely post-symposium. Bears may look for breakdowns and rallies to resistance for entries, while bulls might watch for reversal signals at key supports if the Fed surprises dovishly.
This content is not directed to residents of the EU or UK. Any opinions, news, research, analyses, prices or other information contained on this website is provided as general market commentary and does not constitute investment advice. ThinkMarkets will not accept liability for any loss or damage including, without limitation, to any loss of profit which may arise directly or indirectly from use of or reliance on such information.

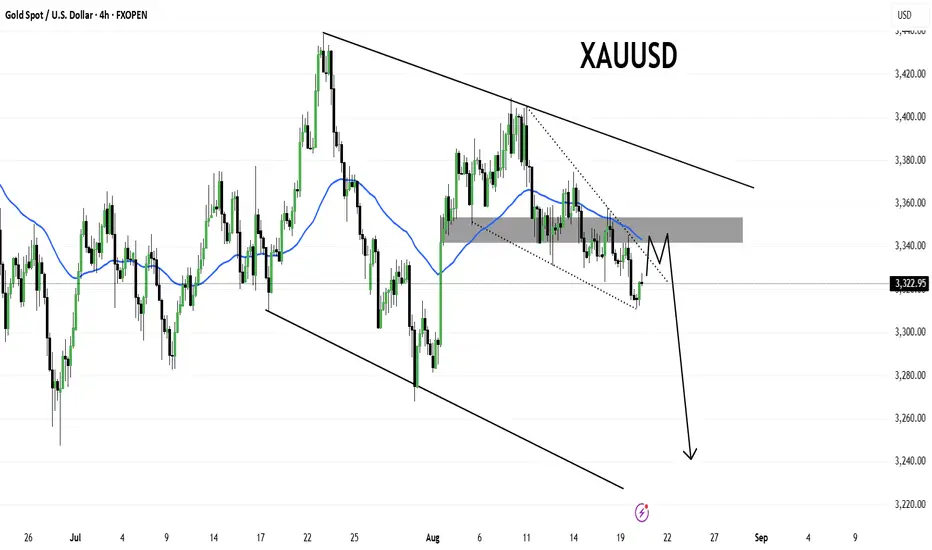
XAUUSDGold is still trading inside a descending channel, respecting lower highs and lower lows. Currently, price is testing the short-term descending wedge, with a possible pullback into the 3340–3350 resistance zone (highlighted in grey).
As long as price remains below this resistance and the channel trendline, the bias remains bearish, and we could see another leg down toward 3240–3220 in the coming sessions.
Key Points:
Price respecting bearish structure.
Short-term pullback expected into resistance.
Sellers likely to step in below 3350.
Downside targets: 3260 → 3240 → 3220.
Bias: Bearish below 3350
▒₿▒ TWIN SHOOTING STARS | WK ▒₿▒COINBASE:BTCUSD
[ [ ]]
Hello everyone,
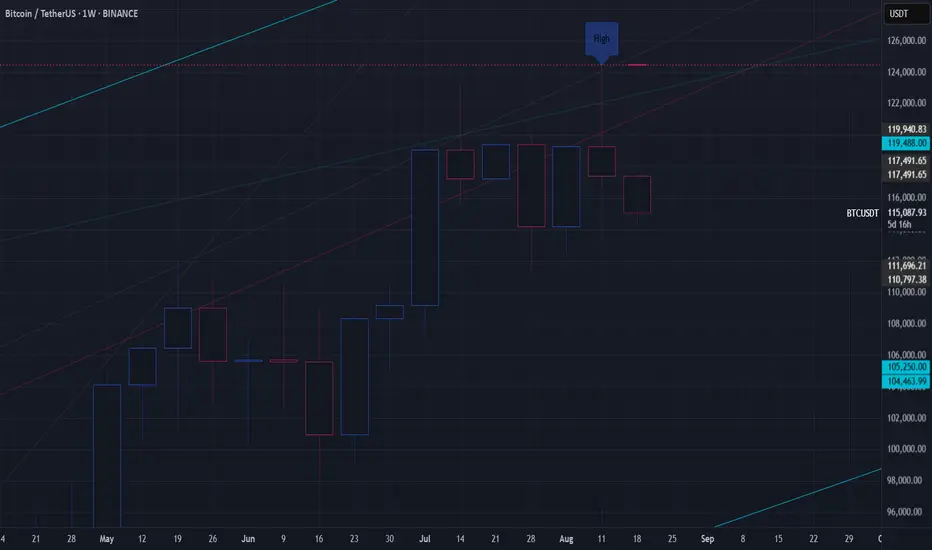
We identified a critical juncture for Bitcoin, marked by two consecutive weekly Shooting Star candles. The wait for confirmation is now over. The market has made its decision, and the bearish thesis we outlined has been validated.
The Bearish Thesis: Confirmed and In Control
The potent storm warning we identified has now made landfall.
What Happened: The weekly candle closed decisively bearish, breaking below the floor of the recent consolidation range (~$115,000). This move confirms the immense selling pressure at the ~$124,000 resistance and validates the double Shooting Star pattern as a major top for the time being.
What It Means: The period of indecision is over. Sellers have taken control, and Bitcoin has officially entered a corrective phase on the weekly timeframe.
The Bullish Case Has Faltered
The alternative scenario of a "Bullish Rectangle" or a simple healthy pause has been invalidated. The hope that buyers would absorb supply and push higher was negated by the strong weekly close to the downside. The price action has confirmed that the recent sideways movement was distribution, not accumulation.
The Updated Game Plan: What to Watch Now
With the breakdown confirmed, the context of our key levels has changed. They are no longer possibilities; they are now active targets and established resistance.
Established Resistance: $124,000. This level is now the confirmed peak. The bulls would need to reclaim this formidable level to even begin to suggest a return to the uptrend.
Broken Support / New Resistance: The previous "Indecision Zone" of $112,000 - $115,000 has now been broken. In the event of any bounce, this area is now expected to act as resistance.
The Primary Target: With the initial warning sign at ~$111k triggered, the focus now shifts to the next major support zone. The logical destination for this corrective move is the previous multi-month resistance from May-July. Therefore, the primary target is $104,000 - $100,000.
Bear Market Confirmation: As before, a decisive weekly close below $104,000 would break the entire macro market structure, signaling that this is more than a correction and likely the start of a longer-term bear market. The probability of the bull run being over would then become extremely high (>85%).
Conclusion
The time for a neutral stance is over. The technical evidence confirms that Bitcoin is in a correction with a high probability (70% likelihood) of heading towards the $104,000 support zone. The path of least resistance is now clearly to the downside. Any rally back to the $112k-$115k area is likely to be met with selling pressure.
This is not financial advice (NFA). This is for educational purposes only. Always do your own research (DYOR).
Posted by: Kairos
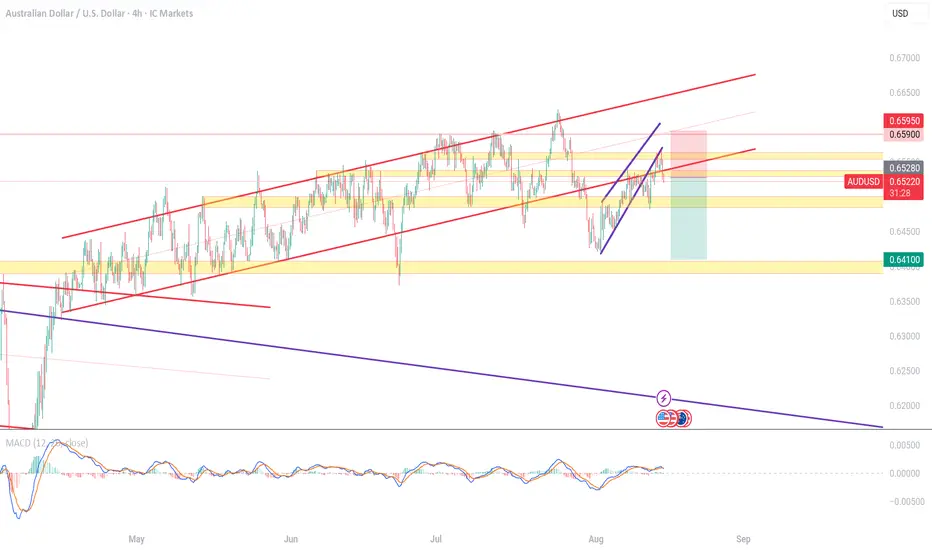
AUDUSD : SHORT OPPORTUNITY. HERE'S WHY!4HR Long Term trend broken, short till 0.6390 (TP), and SL at 0.6595.
MACD shows bearish signal as higher high in price but lower high in indicator.
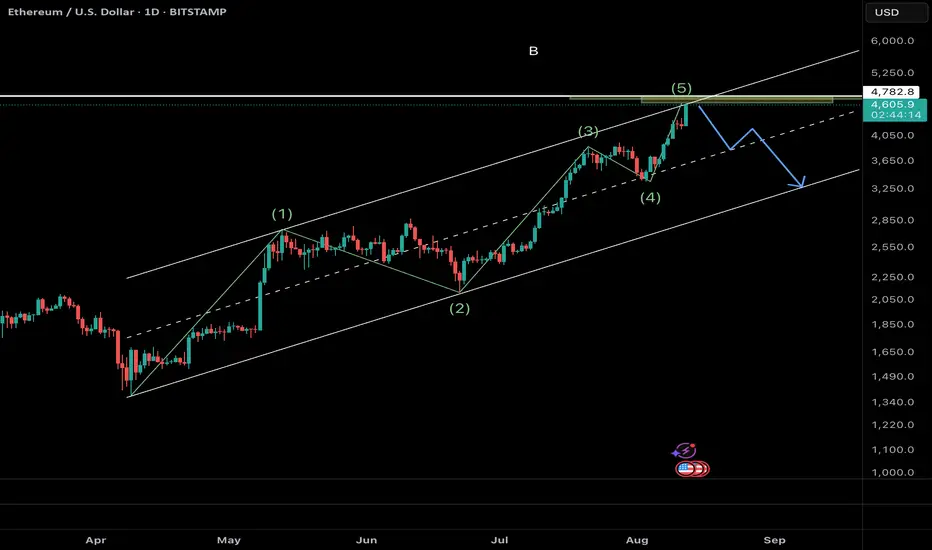
Ethereum (ETH/USD) – Elliott Wave AnalysisThe current price structure suggests that Ethereum is completing the final stages of a 5-wave impulsive advance, with the market now positioned in wave 5 of 5. Price action has reached the upper boundary of the ascending channel, coinciding with a key Fibonacci projection zone (green resistance area), which aligns with typical wave 5 termination points.
Given this confluence, the probability of a medium-to-long-term top forming here is elevated. Once wave 5 completes, a corrective phase is expected, potentially retracing towards the midline or lower boundary of the channel. The projected path (blue arrows) anticipates a significant decline, consistent with the completion of a full impulsive cycle.
Key Points:
• Structure: Impulse wave (5 of 5) nearing completion
• Confluence: Channel resistance + Fibonacci projection zone
• Outlook: High probability of reversal and corrective decline
• Targets: First support near $3,650, with deeper retracements possible toward $3,000–$2,800 if bearish momentum accelerates
This suggests caution for late long entries, as risk/reward now favors a corrective move.
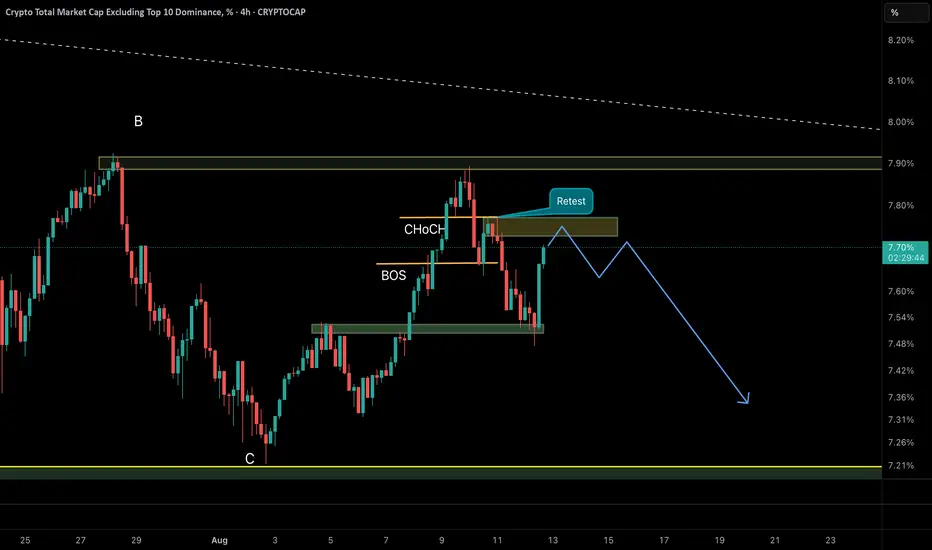
AltCoin Dominance bearish set up After Change of Character and Brake of Structure the altcoin dominance is going to retest the supply zone as shown in graph .
we are waiting to rejection from this zone and another bearish wave
Gold Bull Trap and Technical Analysis Outlook (Daily) Bull Trap Analysis
Definition: A bull trap occurs when price breaks above resistance (luring bulls) but reverses sharply downward.
Current Evidence:
Price Action: Gold rallied to $3397.02 but shows exhaustion signs (e.g., long upper wicks on 4H/daily candles).
Volume & VWAP: Declining volume on the breakout + price now below VWAP on 4H charts suggests weak follow-through.
Divergence: Daily RSI (14) at 68 but curling downward while price made a higher high – bearish divergence.
Conclusion: High risk of a bull trap if price closes below $3385 (key support).
1. Japanese Candlestick Analysis
Intraday (5M-4H)
4H: Bearish Engulfing at $3397.02 signals rejection of highs.
1H: Dark Cloud Cover below $3400 confirms bull trap.
30M/15M: Shooting Stars at $3395 indicate exhaustion.
5M: Three Black Crows pattern suggests strong bearish momentum.
Outlook: Bull trap confirmed if $3390 breaks.
Swing (4H-Monthly)
Daily: Gravestone Doji at $3397.02 warns of trend exhaustion.
Weekly: Bearish Harami after 3-week rally signals distribution.
Monthly: Long-legged Doji at all-time highs ($3400) indicates indecision.
2. Harmonic Patterns
Intraday
4H/1H: Bearish Butterfly completing at $3397.02 (D-point).
PRZ: $3390–$3400 (127.2% XA + 161.8% BC).
30M: Bullish Crab forming at $3370 (secondary setup).
Swing
Daily: Bearish Gartley near $3400 (78.6% XA retracement).
Weekly: Potential Bullish Bat at $3350 if correction extends.
3. Elliott Wave Theory
Intraday
4H: Wave 5 of impulse cycle peaked at $3397.02.
Structure: Completed 5-wave sequence from $3300 → $3397.02.
Corrective Phase: ABC pullback targeting $3350 (Wave A).
1H: Sub-wave (v) ending with RSI divergence.
Swing
Daily: Wave 3 of primary bull cycle nearing completion at $3400.
Weekly: Wave (iii) of larger impulse, expecting Wave (iv) correction to $3300.
Monthly: Wave V of multi-year bull run, nearing major resistance at $3400.
4. Wyckoff Theory
Intraday
Phase: Distribution (after markup from $3300 → $3397.02).
Signs: High volume at $3397.02 (supply), failed upthrust above $3400.
Schematic: Phase C (markdown) initiating.
Swing
Daily: Late Markup → Distribution at $3400.
Weekly: Accumulation completed at $3200; now in Markup but showing signs of exhaustion.
5. W.D. Gann Theory
Time Theory
Intraday: Key reversal windows:
UTC+4: 08:00–10:00 (resistance test), 14:00–16:00 (trend reversal).
Swing:
Daily: 12th Aug (4 days from close) for time squaring.
Weekly: 16th Aug (1 week) for cycle turn.
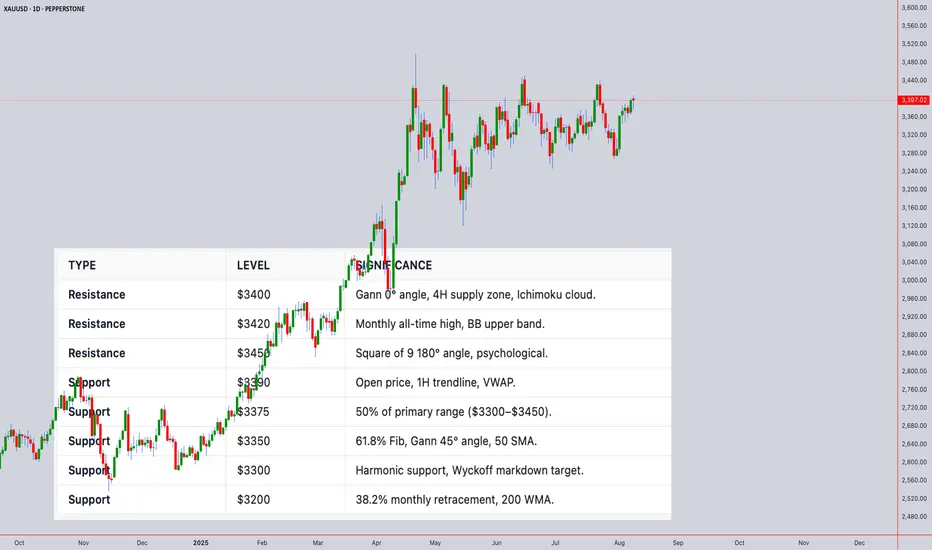
Square of 9
$3397.02 → Resistance Angles:
0° ($3400), 90° ($3420), 180° ($3450).
Support: 45° ($3350), 315° ($3300).
Angle Theory
4H Chart: 1x1 Gann Angle (45°) from $3300 low at $3350. Price overextended.
Daily Chart: 2x1 Angle (63.75°) at $3397.02 acting as resistance.
Squaring of Price & Time
Price Range: $3300 → $3397.02 (97.02 points).
Time Squaring: 97 hours from $3300 low → $3400 resistance.
Ranges in Harmony
Primary Range: $3300–$3450 (150 points).
50% Retracement: $3375 (critical support).
61.8% Retracement: $3350.
Secondary Range: $3350–$3400 (50 points).
Price & Time Forecasting
Intraday Targets:
Short-Term: $3350 (61.8% Fib).
Extension: $3300 (Gann 45° angle).
Swing Targets:
Weekly: $3300 (Wave (iv) target).
Monthly: $3200 (38.2% retracement of entire bull run).
6. Ichimoku Kinko Hyo
Intraday (4H)
Cloud (Kumo): Price below Kumo (bearish).
Tenkan-sen: $3390 (flat, resistance).
Kijun-sen: $3375 (support).
Chikou Span: Below price (confirms bearish momentum).
Swing (Daily)
Cloud: Thick cloud resistance at $3400–$3420.
Tenkan/Kijun: Bearish crossover at $3390.
7. Indicators
Intraday
RSI (14): 68 (4H) → Overbought; divergence at highs.
Bollinger Bands: Price tagging upper band ($3400); contraction signals volatility.
VWAP: $3380 (acting as dynamic resistance).
Moving Averages:
50 SMA: $3350 (support).
200 EMA: $3300 (major support).
Swing
Daily RSI: 72 (overbought, divergence).
Weekly BB: Upper band at $3420 (resistance).
Monthly VWAP: $3200 (major support).
200 WMA: $3100 (long-term bull support).
Synthesized Forecast
Intraday (Next 24H)
Bearish Scenario (High Probability):
Trigger: Break below $3390 (1H close).
Targets: $3350 (T1), $3300 (T2).
Timeline: 8–12 hours (UTC+4 10:00–14:00).
Bullish Scenario (Low Probability):
Trigger: Sustained close above $3400.
Target: $3420 (Gann 90° angle).
Swing (1–4 Weeks)
Bearish Scenario:
Targets: $3300 (Wave (iv)), $3200 (38.2% retracement).
Timeline: 5–10 trading days.
Bullish Scenario:
Trigger: Close above $3420.
Target: $3450 (Gann 180° angle).
Intraday
Entry: Short at $3390–$3400 (stop-loss above $3410).
Targets: $3350 (T1), $3300 (T2).
Risk-Reward: 1:3 (20-point risk, 60-point reward).
Confirmation: 1H close below $3390 + RSI <50.
Swing
Entry: Short at $3400 (stop-loss above $3420).
Targets: $3300 (T1), $3200 (T2).
Risk-Reward: 1:4 (20-point risk, 80-point reward).
Confirmation: Daily close below $3390 + Ichimoku bearish crossover.
For those interested in further developing their trading skills based on these types of analyses, consider exploring the mentoring program offered by Shunya Trade.
(world wide web shunya trade)
I welcome your feedback on this analysis, as it will inform and enhance my future work.
Regards,
Shunya.Trade
world wide web shunya trade
NZDCAD - Bearish Price Action, Bearish confluencesNZDCAD has been shaping up to see a bearish move as we can see the price correctively retested a double top level which had corrective movement indicating sellers are present and we can see the next push downward.
Good Luck

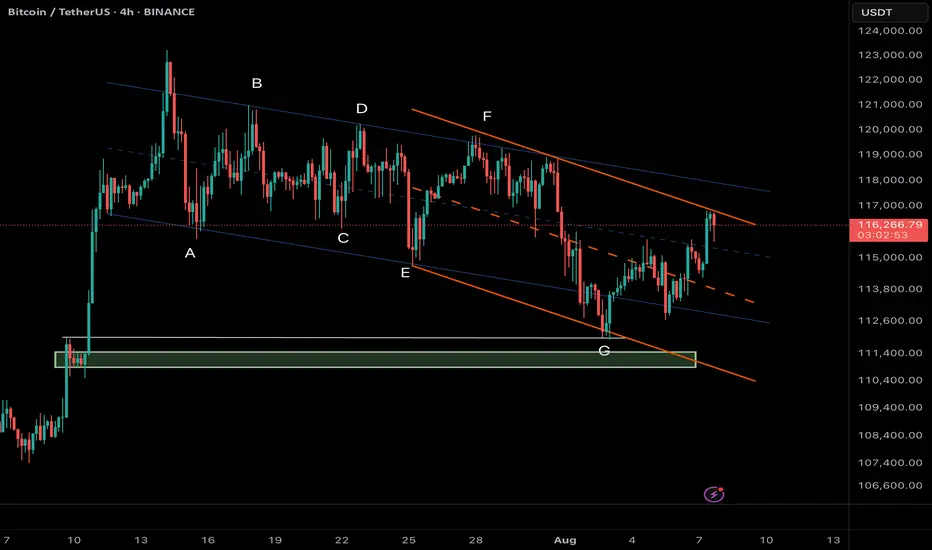
Bitcoin (BTC/USDT) – Bearish Scenario Remains in Focus4H Chart Analysis – Structural + Price Action Insight
Bitcoin is currently trading inside a descending minor channel (orange), which is part of a larger complex correction pattern, potentially a contracting running flat or diametric in NeoWave context. The sequence A to G may suggest that the market completed its G-leg after bouncing off the lower support.
Now, BTC has reached the upper boundary of the orange channel, which aligns with a strong resistance zone around 116.8K–117K.
⸻
✅ Primary Scenario (Bearish Bias):
As long as BTC fails to break and sustain above 116,800 – 117,000, the current move can be interpreted as a pullback within the correction, with high probability of price heading back toward the green liquidity/support zone near 110,800 – 111,400.
This could be a continuation of the broader corrective structure, or even the beginning of a new downward cycle.
⸻
❗ Alternative Scenario:
If bulls manage to break above 117,000 with strong momentum and confirmation (e.g., breakout + retest), the structure may shift bullish with short-term targets near 118,500 – 120,000.
⸻
🎯 Key Takeaways:
• Watch price action closely at the current resistance zone.
• Bearish confirmation (e.g., bearish engulfing, rejection wicks, or supply absorption signs) is required before considering short entries.
• High R:R setups emerge near channel extremes with clear invalidation levels.
EURUSD Bearish Market Structure Unfolding – Liquidity Grab BelowEURUSD Bearish Market Structure Unfolding – Liquidity Grab Below Support Expected"
🔍 Technical Analysis Breakdown:
🔺 Resistance Zone (1.17500 - 1.18500)
Labelled “Strong High”, this is a high-supply zone where price previously reversed.
Multiple Break of Structure (BOS) and Change of Character (CHoCH) confirm this as a strong bearish supply area.
Any retracement toward this level could be ideal for short entries.
🟩 Fair Value Gap (FVG)
This imbalance area previously served as a magnet for price before it broke down.
Price failed to hold inside the FVG, reinforcing bearish sentiment.
🔻 Support Zone (1.13500 - 1.14000)
Marked as a "Weak Low", suggesting this level is likely to be taken out in a liquidity sweep.
Price is expected to retest and potentially break below this zone in the near term.
📉 Current Price Action
Recent CHoCH (Bearish) confirms shift in structure.
Price has made a corrective pullback and seems poised for another leg down.
Highlighted grey zone suggests price may retrace slightly higher before continuing its bearish move.
🎯 Bias: Bearish
Expecting downside continuation toward 1.13500 support, targeting liquidity below.
Traders may wait for rejection signals on lower timeframes around the minor pullback zone before executing shorts.
📚 Educational Notes:
CHoCH indicates a shift in market sentiment (from bullish to bearish).
FVG often acts as a magnet but if not respected, confirms momentum in the opposite direction.
Support/Resistance zones are used to determine institutional activity zones.

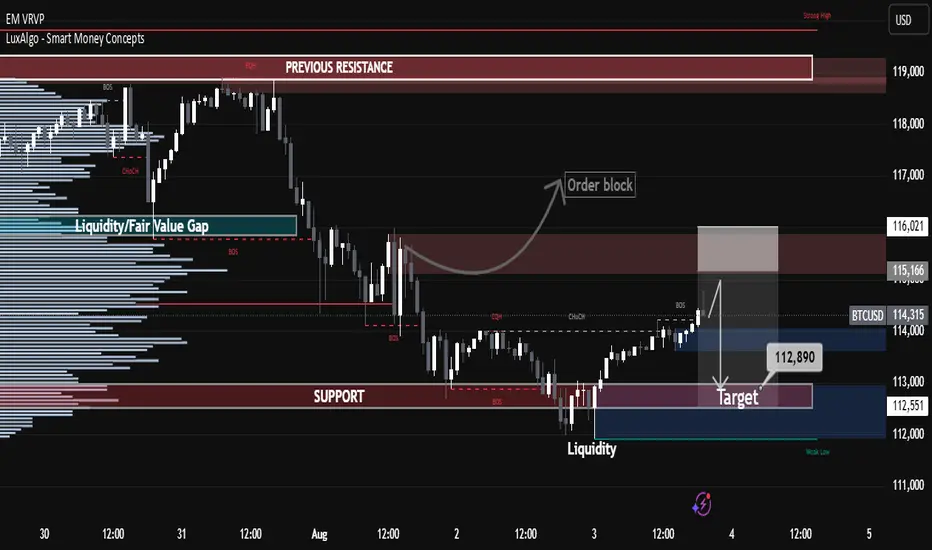
BTC Hits Premium Zone – Bearish Reversal Loading? BTC Hits Premium Zone – Bearish Reversal Loading?
🧠 Technical Breakdown:
🔹 1. Previous Market Structure & CHoCH
The chart shows a clear shift in structure (CHoCH) on the left, which marked the start of the bearish leg.
Break of Structure (BOS) confirms continuation of lower highs and lower lows until recent liquidity grab near the $112,551 zone.
Equal highs and liquidity above were taken out, making the move into the Premium Order Block zone highly significant.
🔹 2. Liquidity and Fair Value Gap (FVG) Zones
A major Liquidity + FVG zone was left unmitigated between $113,000–$112,000, and price is likely to revisit it.
This aligns with the target zone at $112,890, which is highlighted as a magnet for price to rebalance the inefficiency.
🔹 3. Order Block & Premium Supply Zone
A well-defined Order Block is marked just below the resistance zone near $115,166–$116,021.
Price is currently retracing into this zone, suggesting a potential reaction point for smart money to re-enter shorts.
Volume is expected to pick up here, and a reversal could initiate if price fails to break above this supply.
🔹 4. Volume Profile and Market Imbalance
Volume clusters are heaviest near the $114,000–$114,300 range, indicating high activity and previous accumulation/distribution.
Thin volume near the $112,551 zone further confirms price may drop quickly if rejection happens.
🔹 5. Support & Liquidity Sweep
Support zone around $112,551 is a previous liquidity pool and weak low that has not been fully cleared.
Price is likely to revisit this zone in the short term to clear liquidity and complete market rebalancing.
🔐 Institutional Narrative:
Smart money engineered a liquidity sweep to the downside, then caused a retracement into premium.
Now, BTC/USD is positioned in a high-risk zone where sell-side institutions may enter to push price lower.
If this order block holds, expect a rejection toward $112,890, followed by possible deeper continuation into the liquidity void below.
📌 Key Levels:
Level Price (USD)
Strong Resistance Zone 115,166 – 116,021
Order Block (Sell Area) 114,800 – 116,000 (approx.)
Immediate Support 113,000 – 112,551
Target (Liquidity Zone) 112,890
Weak Low (Final Sweep) 112,000
📉 Trade Outlook & Strategy:
🔺 If price reacts bearishly at Order Block:
Look for lower timeframe BOS/CHoCH confirmation.
Entry: Short on rejection at or near $115,000–$115,500
Target 1: $112,890
Target 2: $112,000 (extended liquidity sweep)
Stop-loss: Above $116,200 (invalidates bearish OB)
🔻 If price breaks and closes above $116,021 with momentum:
Structure flips bullish, and the OB is invalidated.
Look for long setups on retracement to $114,000 zone.
🧭 Conclusion:
BTC/USD is currently trading within a Premium Zone, testing a strong Order Block below key resistance. Price may face a bearish reaction, targeting the liquidity zone at $112,890. Smart money footprints suggest a potential trap for breakout buyers, and if momentum fades, we can expect a downside reversal to sweep remaining liquidity.
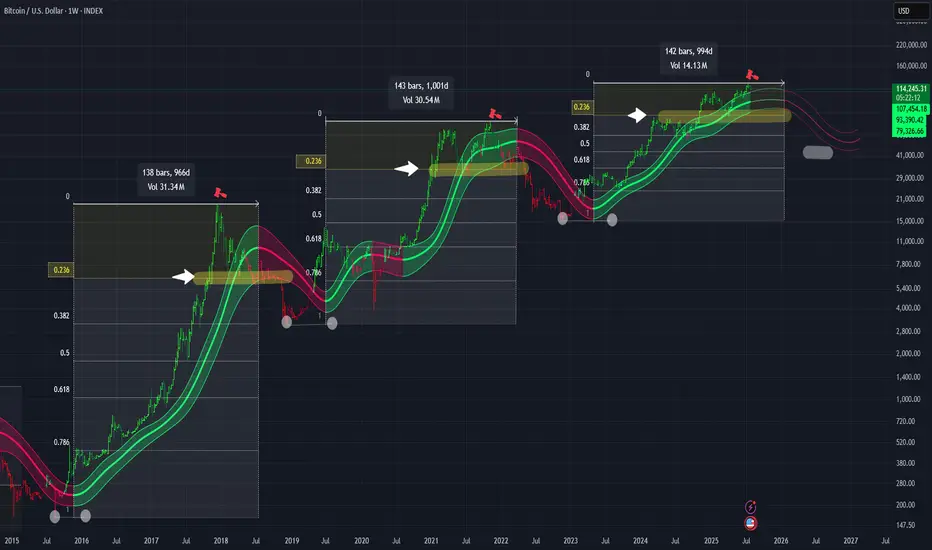
"When the sea retreats and whispers low through Gaussian"This time we are going to talk about the neck of the Bull Markets tops. "IF" I nailed it predicting the top ~ 123k we might start talking about the neck of the hill around the 0.236 Fib level. This could be the next target for Bitcoin in the coming months around 76K(yellow zone). Once the 1000 days of green above Gaussian ends we might see the biggest drops of the bear market bottoming around the 0.5 fib level in the lows 40k usd.
EURAUD - Bearish H*S Retesting Double Tops LevelEURAUD is approaching a strong reversal area which we could see a retest before the next leg down. Wait for bearish confirmation on LTF before entry.
Good Luck

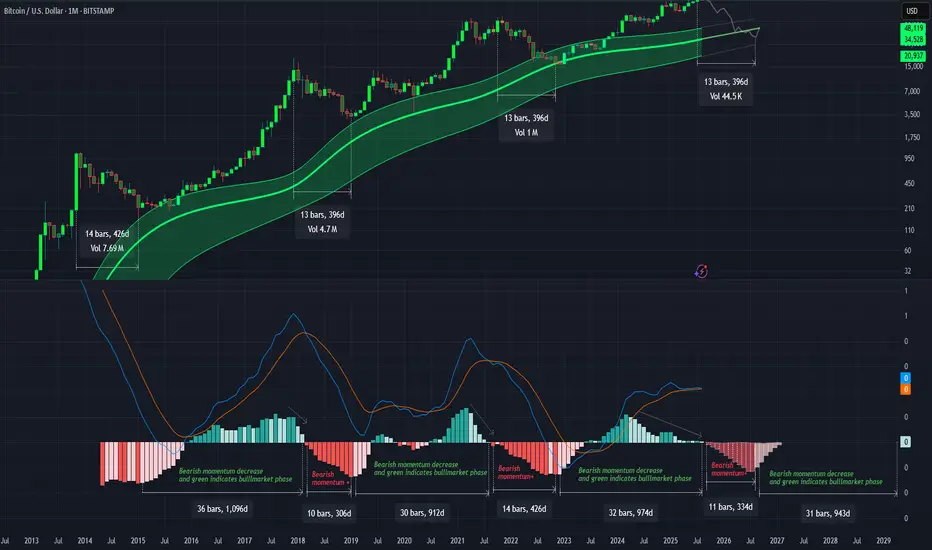
Gaussian and the LMACD deep dive!As you can see LMACD is showing signs of exhaustion. Histogram has been compressing or decreasing in momentum while the price has been climbing up. This divergence wont last for too long and a change in the trend seem very likely. BTC might be entering in the bear market pretty soon and you might start seeing the histogram turning red and increasing in bearish momentum before changing the trend once we approach to the core of the Gaussian or even bellow this time. Breaking bellow the core would mean range bellow 40k as bear market bottom.
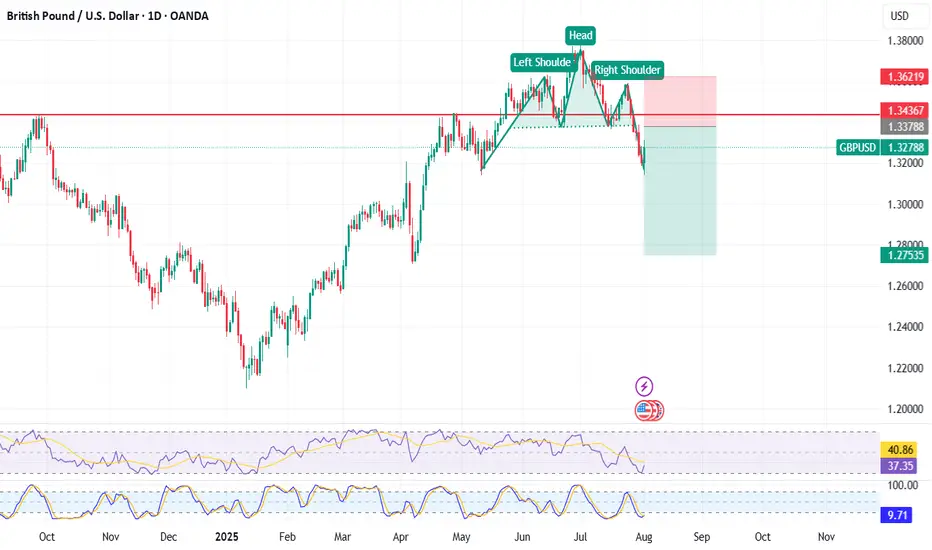
GBPUSD is in Bearish Reversal Head & ShoulderGBPUSD is showing clear bearish head & shoulder pattern on daily chart it will retrace for some time to get close to the price 1.33788 at that point short sell will be good
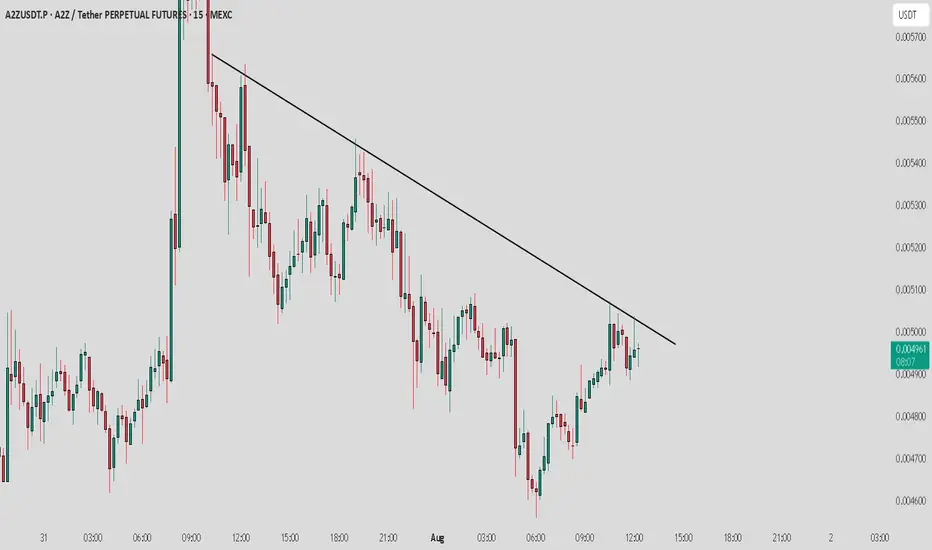
A2Z / USDT : Near trendline and showing weakness, Avoid long A2Z/USDT - Nearing Trendline Resistance
A2Z/USDT is approaching a crucial trendline resistance.
Bearish Scenario:
Failure to break the resistance could lead to further consolidation or a potential reversal, testing lower support levels.
Keep an eye on the trendline and volume for the next key move.
Bearish Retest Setup After BreakdownPrice broke down from the recent bounce and lost the 0.098–0.101 zone, which lined up with the 23.6–38.2 fibs. That area is now likely to act as resistance. Momentum is still bearish. MACD histogram is red and expanding, and no signs of reversal yet. On the daily timeframe, MACD has just started to cross bearish, which adds weight to the downside bias.
If price retests that 0.098–0.101 area and shows weakness (like rejection wicks or small-bodied candles), it’s a clean short opportunity. First target would be the recent low around 0.092, and if that breaks, the next key level is 0.077.
Any push above 0.102 would invalidate the setup for me.

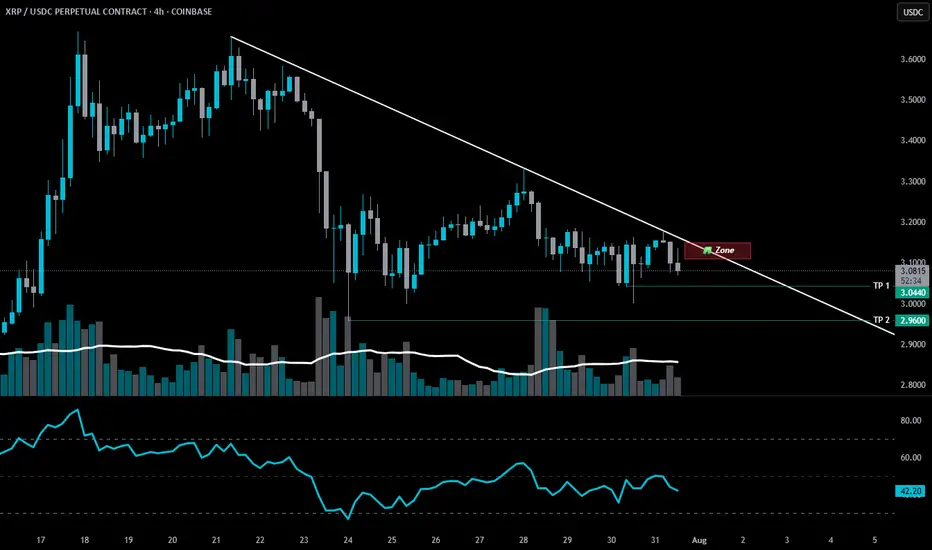
SHORT ZONE-XRP structure shiftThere was an XRP structure shift last week.
📉 It’s been bleeding ever since.
Now, another bearish setup is forming.
If XRP nears that descending trendline and fails to break through — it enters the SHORT ZONE.
🚫 No breakout? No mercy.
This isn’t the end for CRYPTOCAP:XRP — but a purge may be necessary before liftoff.
A proper cleansing to prepare for the next ascension.
🫡 xrpArmy, forgive me…
But hey, feel free to earn your keep.
Stay Sharp. Regulate Yourself.
🚫 100% NOT financial advice.
🎭 Edutainment purpiz only.
GBPUSD BEARISH POTENTIAL The daily time frame for GBPUSD is showing me that price has formed a head & shoulders pattern, breaking through the former support now resistance level. Price is currently sinking to my 1.31000 mid level, once the level is reached it will either breakthrough or bounce off of it to retrace and continue to build bearish structure.

#PENGUUSDT confirms a bearish impulse📉 SHORT BYBIT:PENGUUSDT.P from $0.034625
⚡ Stop loss $0.035646
🕒 Timeframe: 4H
⚡ Overview:
➡️ A Double Top pattern BYBIT:PENGUUSDT.P has formed, signaling a bearish reversal.
➡️ The price broke the $0.0355 support and is consolidating below, confirming seller strength.
➡️ Increasing sell volume confirms bearish control.
➡️ Main focus on targets in the $0.034–0.033 zone.
➡️ The POC at $0.03113 remains the ultimate bearish objective.
🎯 TP Targets:
💎 TP 1: $0.033947
💎 TP 2: $0.033369
💎 TP 3: $0.032948
BYBIT:PENGUUSDT.P Trade Recommendations:
📢 Hold short towards the TP zones.
📢 Watch for reaction around $0.0339 — partial profit-taking possible.
📢 Invalidation if price reclaims above $0.0356.
⚠️ As long as bearish pressure holds, the price is likely to continue towards TP2–TP3.
⚠️ A recovery above $0.0356 would invalidate this setup.
🚀 The signal confirms a bearish impulse — expecting further downside!

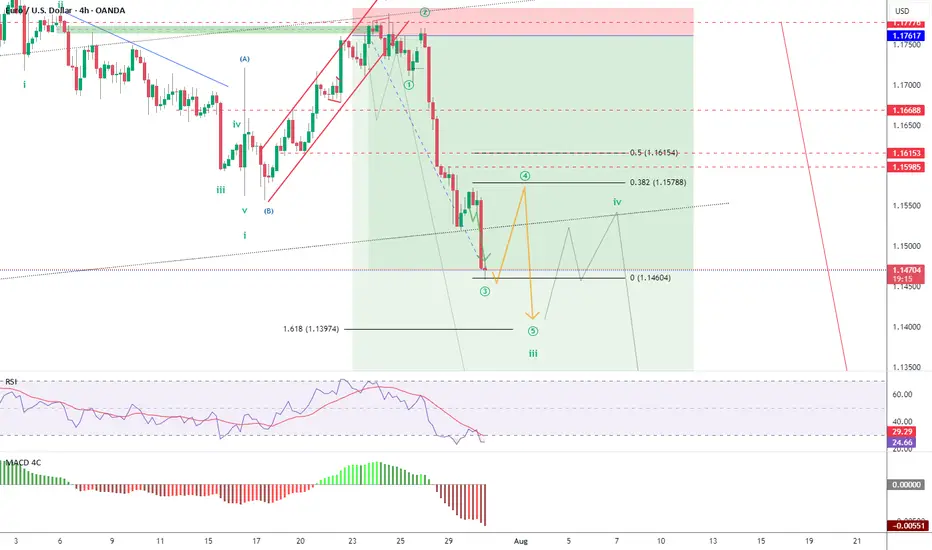
EUR/USD Elliott Wave: Corrective Pullback in Progress Wave ((4))EUR/USD 4H chart with Elliott Wave count. The pair remains in a steady downtrend after peaking at the wave (C) high, and is now in the middle of a larger wave iii decline. Bearish impulse waves dominate, with lower lows confirming the trend (mid-wave iii scenario). Now expecting a wave ((4)) relief bounce (corrective) within this wave iii. Price could rebound toward 1.15788–1.16153, the ~38.2–50% Fibonacci retracement zone of the prior drop.
This area is a likely resistance for the bounce, suggesting only a temporary uptick in an otherwise bearish move. After wave ((4)) completes, the downtrend should resume as wave ((5)) of iii kicks in. The next downside target is around 1.13974 (or lower) – near a 1.618 Fibonacci extension projection where wave ((5)) may complete. This would likely finish wave iii and aligns with the broader bearish Elliott Wave count.
XAUUSD DEVELOPS MID-TERM BEARISH IMPULSEXAUUSD DEVELOPS MID-TERM BEARISH IMPULSE
Yesterday was the 4th bearish day in a row for gold. The reasons are the same as for the EURUSD: American-European trade agreement. Geopolitical risks got eliminated and market participants get rid of the bullion. "If more ‘trade deals’ are reached, this could help to reduce this source of policy uncertainty that has weighed against the dollar, at least for now. It could also see other factors such as relative yields becoming more influential," said Paul Mackel, global head of FX research at HSBC.
Technically, the price has broke down the former trendline and is currently staying slightly above the local support of 3,300.00. It is expected for rebound to continue, retest of the trendline is possible with further decline towards 3,200.00 support level.
