#PENGUUSDT confirms a bearish impulse📉 SHORT BYBIT:PENGUUSDT.P from $0.034625
⚡ Stop loss $0.035646
🕒 Timeframe: 4H
⚡ Overview:
➡️ A Double Top pattern BYBIT:PENGUUSDT.P has formed, signaling a bearish reversal.
➡️ The price broke the $0.0355 support and is consolidating below, confirming seller strength.
➡️ Increasing sell volume confirms bearish control.
➡️ Main focus on targets in the $0.034–0.033 zone.
➡️ The POC at $0.03113 remains the ultimate bearish objective.
🎯 TP Targets:
💎 TP 1: $0.033947
💎 TP 2: $0.033369
💎 TP 3: $0.032948
BYBIT:PENGUUSDT.P Trade Recommendations:
📢 Hold short towards the TP zones.
📢 Watch for reaction around $0.0339 — partial profit-taking possible.
📢 Invalidation if price reclaims above $0.0356.
⚠️ As long as bearish pressure holds, the price is likely to continue towards TP2–TP3.
⚠️ A recovery above $0.0356 would invalidate this setup.
🚀 The signal confirms a bearish impulse — expecting further downside!
Bearish Trend Line

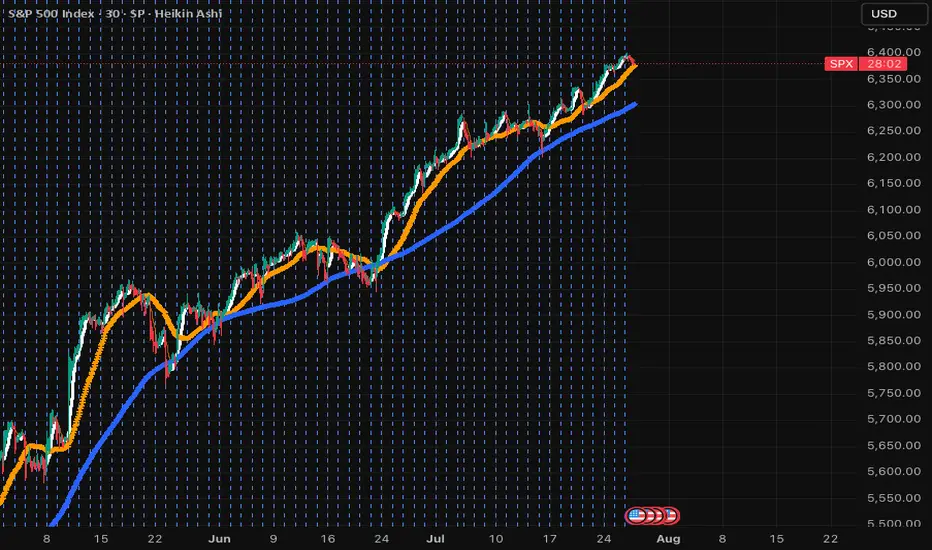
SPX....what goes up, must go downThis is long overdue. SPX has just crossed 9SMA, next 50SMA then 200SMA. Won't be surprised if it knocks each very soon. This will be a big week and tariffs are going to start hitting; even though this was mostly artificial and Americans are paying 90% of it! When in doubt, sell and park in money market! The next dip will hit hard and deep. Don't let the small wins overshadow the deep issues in the economy. Overpriced market and many lagging indicators will soon hit and default rates that are coming out are scary! Stay safe and don't get emotional over any stock. If it dips, you can always buy it cheaper.
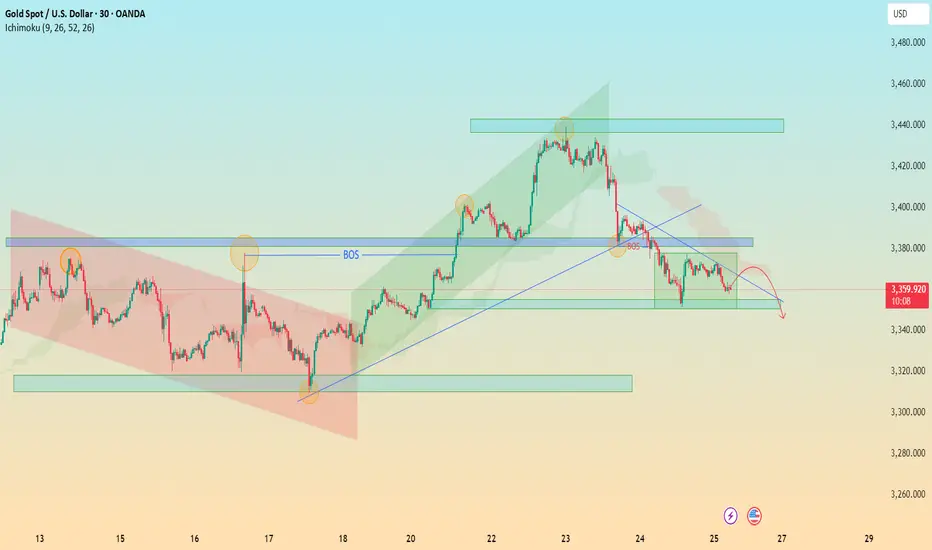
XAU/USD Bearish Retest in Motion – Watch 3340 for Breakout 🔍 XAU/USD (Gold) – Bearish Reversal Outlook
Timeframe: 30-Minute
Date: July 25, 2025
Indicators Used: Ichimoku Cloud, BOS (Break of Structure), Trendlines, Support & Resistance Zones
---
⚙ Technical Breakdown:
1. Previous Market Structure – Accumulation to Expansion:
Descending Channel (Red Box): Market moved within a bearish channel until the breakout occurred.
Key Break of Structure (BOS) around 3365 level signaled the beginning of bullish momentum — a textbook shift from accumulation to expansion phase.
Rally towards 3445 zone: Strong impulsive wave followed by higher highs and higher lows within a green rising channel.
2. Bull Trap and Structural Breakdown:
At the 3445-3460 resistance zone, price failed to maintain momentum and formed a double top / distribution setup.
The second BOS near 3385 confirmed a shift from bullish to bearish market structure.
Ichimoku Cloud also flipped bearish — price is now trading below the cloud, signaling potential continued downside.
3. Current Consolidation and Bearish Retest:
Price is now trapped in a bearish flag / rectangle pattern between 3360 – 3380.
Recent rejections from the descending trendline and overhead supply zone indicate weak bullish attempts and presence of strong selling pressure.
4. Anticipated Move – Bearish Continuation:
The projected red path suggests a retest of the diagonal resistance, followed by a breakdown toward key demand zone at 3340 – 3320.
If that zone fails, we may see a deeper move toward 3280.
---
📌 Key Technical Zones:
Zone Type Price Level (Approx.) Description
Resistance 3445 – 3460 Double Top / Strong Supply
Support 3340 – 3320 Historical Demand Zone
Short-term Resistance 3375 – 3385 BOS Retest + Trendline
---
🎯 Trading Insight:
📉 Bias: Bearish
⚠ Invalidation Level: Break above 3385 with volume
📊 Potential Target: 3340 → 3320
🧠 Trade Idea: Look for short entries on weak retests near descending trendline or cloud rejection.
---
🏆 What Makes This Chart Unique for Editors’ Picks:
✅ Multiple Confluences: Structural shifts (BOS), trendlines, Ichimoku, and classic patterns (channels, flags).
✅ Clear Visual Storytelling: Logical flow from bearish to bullish and back to bearish structure.
✅ Forward Projection: Predictive outlook based on strong technical context — not just reactive analysis.
✅ Educational Value: Useful for beginners and intermediate traders alike to understand structure transitions and key levels.
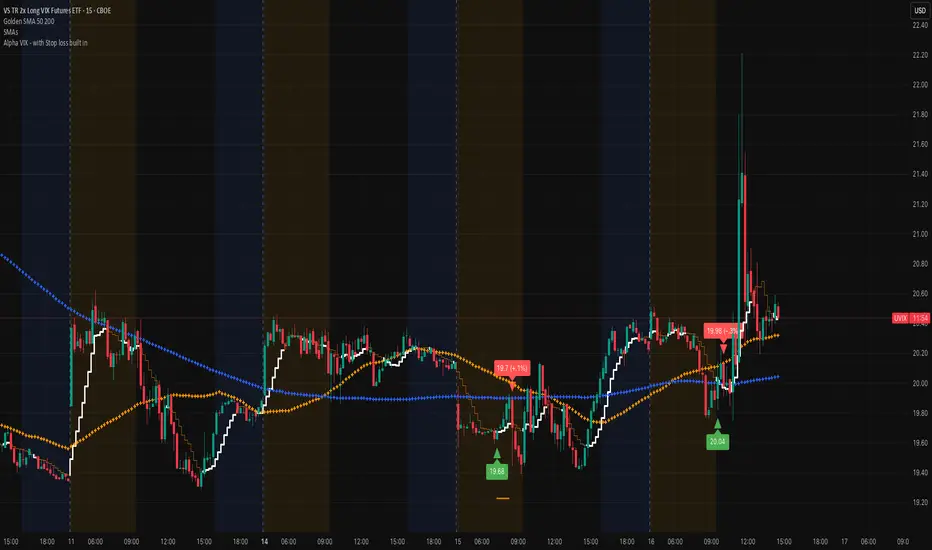
UVIX marching on (VIX proxy)Very nice spike this morning, that's typically a sign that there's more volatility in the works. Remember that we are at record lows on the VIX and that doesn't stay in this region for a long time. Add the Alpha VIX indicator to help you get an entry. The economy is brittle and staying focused on the VIX is a very nice play!
Best of luck and DM if you have any questions.....
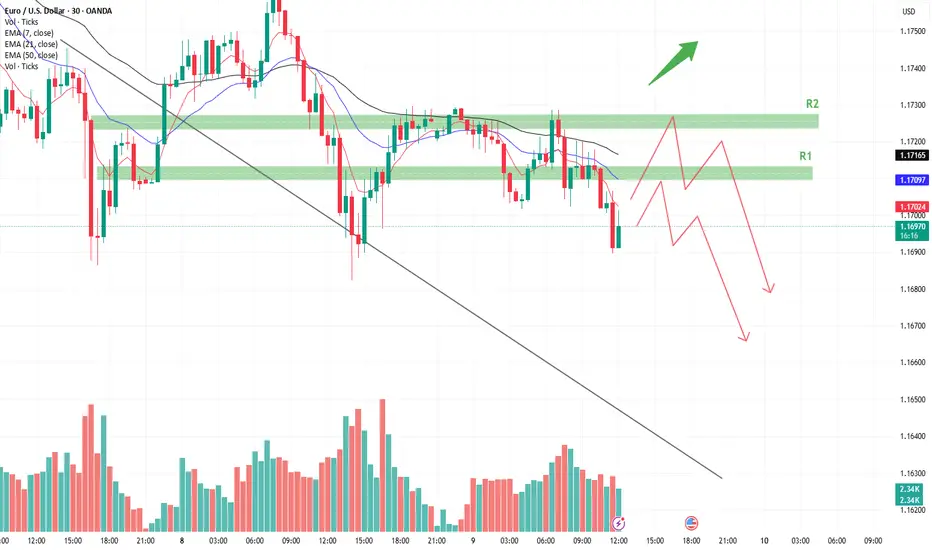
EURUSD Technical Analysis**Chart Overview:**
* **Pair:** EUR/USD
* **Timeframe:** 30-minute
* **Trend:** Bearish (Confirmed by lower highs, lower lows, and downward-sloping trendline)
---
🔍 **Technical Analysis :**
**1. Downtrend Structure**
* Price is consistently making **lower highs and lower lows**, confirming a **strong downtrend**.
* A clear **descending trendline** is respected multiple times as resistance.
**2. EMAs (7, 21, 50)**
* All EMAs (blue, purple, black) are sloping downward.
* Price is trading **below all EMAs**, signaling continued bearish momentum.
* EMA 50 (\~1.1716) acts as a **dynamic resistance** zone.
**3. Key Resistance Zones (Marked as R1 & R2)**
* **R1 Zone (\~1.1710–1.1720):** Previous support now turned resistance. Could see rejection here.
**R2 Zone (\~1.1730+):** Higher resistance, possibly tested if R1 breaks. Also aligns with EMA confluence.
**4. Volume Analysis**
* Volume shows **spikes on bearish candles**, which suggests **strong selling interest** at lower highs.
* No significant bullish volume breakout so far.
📈 **Price Projection Path (Red Arrows)**
* The red path illustrates a **bearish price projection**:
* Price may pull back into **R1 or R2**
* Likely to face **resistance & rejection** from those levels
* Expected to make **lower highs and resume downside movement**
* Potential drop toward **1.1670, 1.1650, and lower**
🟢 **Bullish Invalidator**
* If price **breaks and holds above R2 (\~1.1735+)** with volume, it may indicate a **trend reversal or bullish correction**.
---
**Summary:**
* **Bias:** Bearish
* **Resistance Zones to Watch:**
* R1: 1.1710–1.1720
* R2: 1.1730–1.1740
* **Targets on Downside:**
* 1.1670
* 1.1650 or lower
* **Confirmation Needed:** Bearish rejection candles or failure to break R1/R2
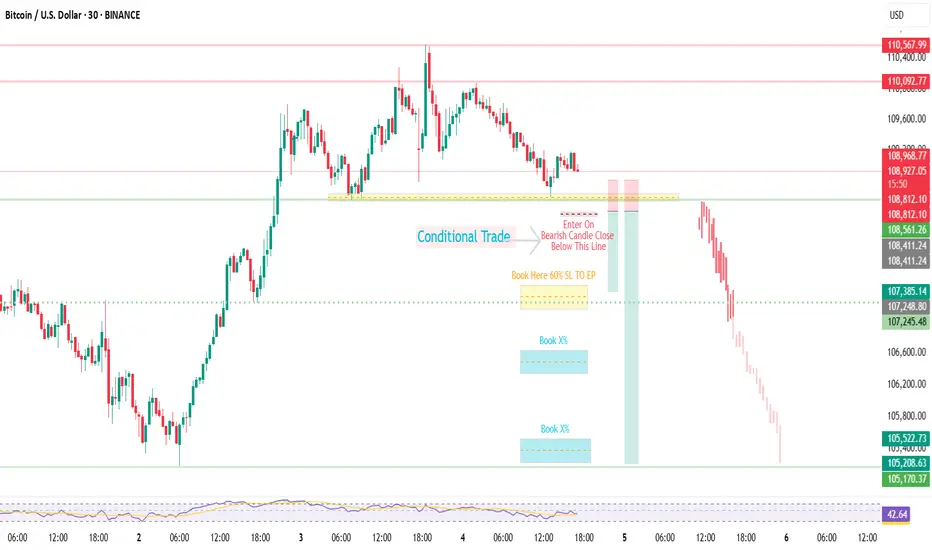
BTCUSDBTCUSD | Quiet Market Play – Conditional | Trade Based On Bearish Candle Closure
After a sharp upward move, price is now losing momentum and consolidating.
Currently entering a short position after breaking the resistance
Trade includes full risk management, marked on chart. 🔴📉
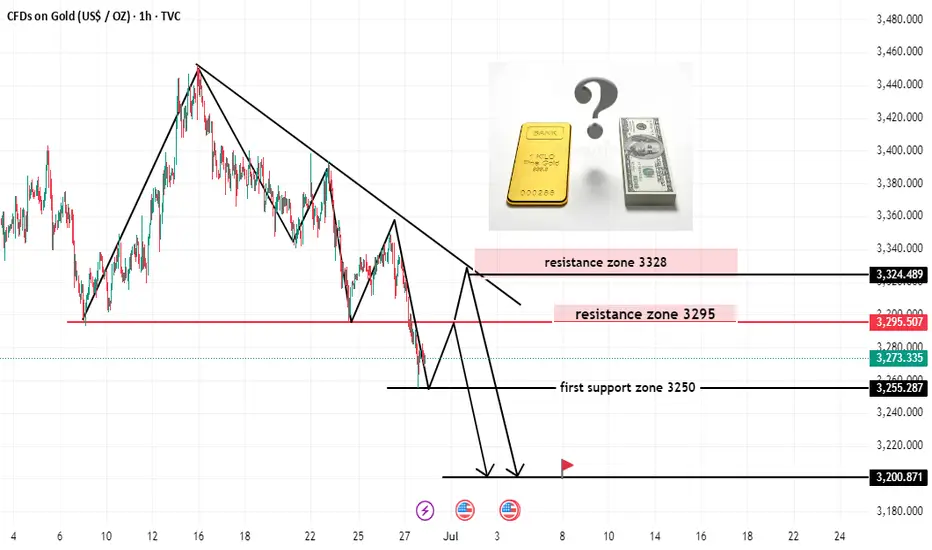
GOLD READY FOR SELL (READ CAPTION)Hello trader. what do you think about gold
current price; 3273
gold is breakout resistance zone in weekly candles i think gold retest upside and testing resistance then gold fall down
resistance zone : 3295_3325
support zone 3250
demand zone:3200
please like comment and follow thank you
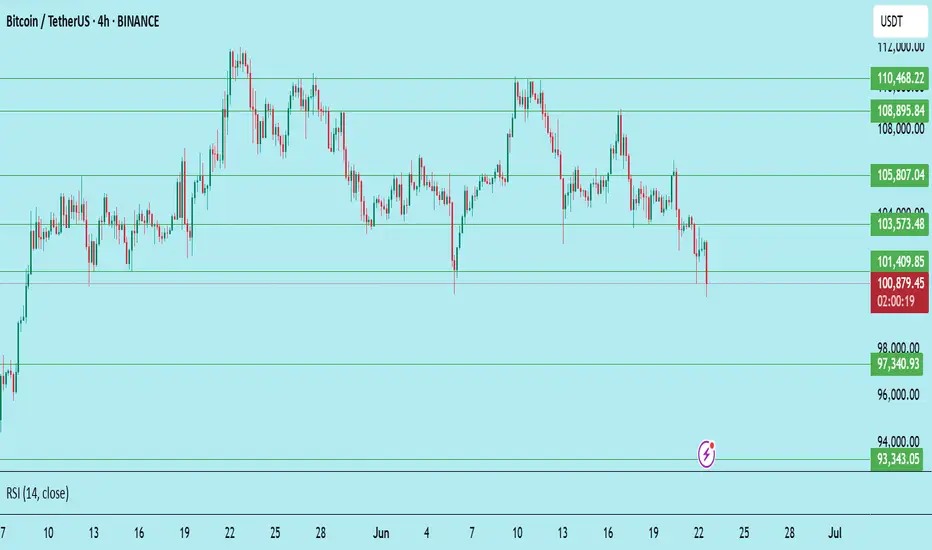
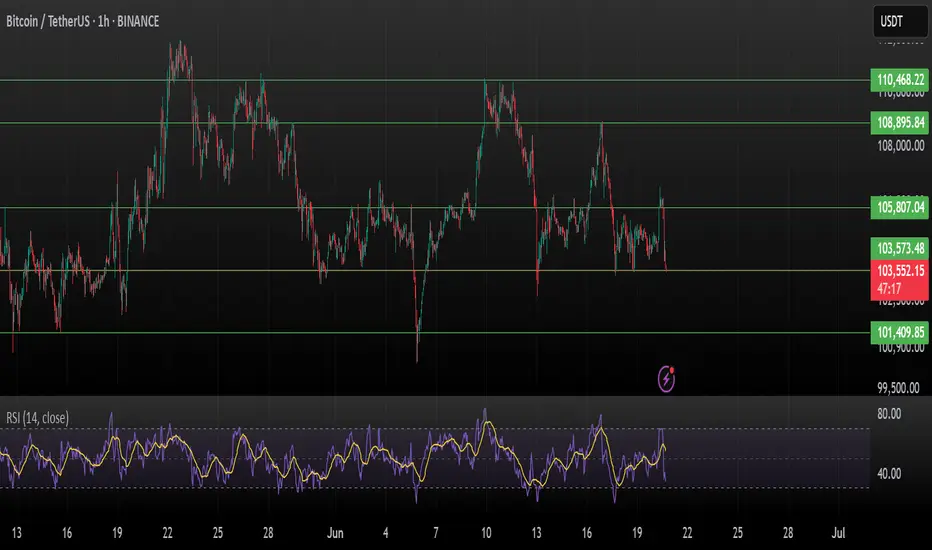
Bitcoin (BTC/USDT) – Bearish Continuation After Failed Support !Bitcoin attempted to hold the $101,409 support level but failed to sustain above it. The breakdown confirms weakness, and the chart now suggests a continuation of the downtrend if bulls don’t reclaim lost ground quickly.
Technical Breakdown:
Failed Bounce: BTC briefly bounced near $101.4K but got rejected and closed back below the zone.
Bearish Structure: Price continues forming lower highs and lower lows — a clear downtrend.
RSI at 30.34: Close to oversold but still room to fall, which means downside isn’t exhausted yet.
Market Sentiment: Weak hands are exiting, and support zones are getting tested faster than they’re defended.
Key Levels to Watch:
Resistance:
$101,409 – Immediate level, now flipped to resistance
$103,573 – Strong barrier if bulls attempt recovery
$105,807 – Major horizontal resistance and lower high zone
Support:
$97,340 – Next major support zone (possible short-term bounce)
$93,343 – Key level if $97.3K fails to hold
$92,200 – Final support before panic could set in
Trade Idea – Bearish Bias:
Short on Retest Zone: $101.4K – $102K
Stoploss: Above $103.6K
Take-Profit Targets:
TP1: $97,300
TP2: $93,300
TP3: Optional – trail lower if breakdown continues
What Bulls Need to Do:
Reclaim $101.4K fast with a strong close above it on the 4H chart
Otherwise, sellers remain in control
This is not financial advice. Always do your own research (DYOR) and manage your risk accordingly.
BTC Testing Crucial Support – Breakdown or Bounce ?Bitcoin is currently testing a critical support zone around $103,573 – a break below could trigger a sharper move toward $101,400.
Price rejected from ~$105.8K
Support holding... for now
RSI dropping fast – now near 34 (1H TF)
Weakening momentum visible
This level is the last line of defense for bulls. If it cracks, expect volatility.
Watch closely. Break = panic or buying opportunity?
DYOR. Not Financial Advice.
USD/JPY – Bearish Symmetrical Triangle Break Incoming?USD/JPY is currently consolidating within a well-defined symmetrical triangle, respecting both the ascending and descending trendlines with clean touches. This structure typically precedes a volatile breakout, and the technical confluence here favors a bearish resolution.
🔍 Technical Breakdown:
Price failed to hold above the 0.5 Fib level of the recent swing high at 145.377, getting rejected by both the 200 EMA and the triangle resistance zone.
Currently testing the 0.382 retracement (144.607) — a break here opens the door for a drop to the 0.236 level (143.653) and potentially deeper into previous demand.
Volume compression and EMA clustering further support an imminent breakout move.
📐 Bearish Confluences:
Rising wedge/symmetrical triangle pattern showing exhaustion.
Strong rejection at the equilibrium of the range.
EMAs acting as dynamic resistance.
Major fib cluster from previous bearish leg aligning with triangle apex.
🎯 Targets:
TP1: 143.653 (0.236 Fib)
TP2: 142.111 (local low)
TP3: 140.347 (-0.27 Fib extension, full measured move of triangle)
❌ Invalidation:
Clean break above 145.526 (mid-structure + fib zone) would neutralize the setup.
💬 Market Context: Watch closely for a breakout confirmation. Smart money may sweep short-term liquidity before a decisive drop. Stay nimble, and remember — structure always tells the story.

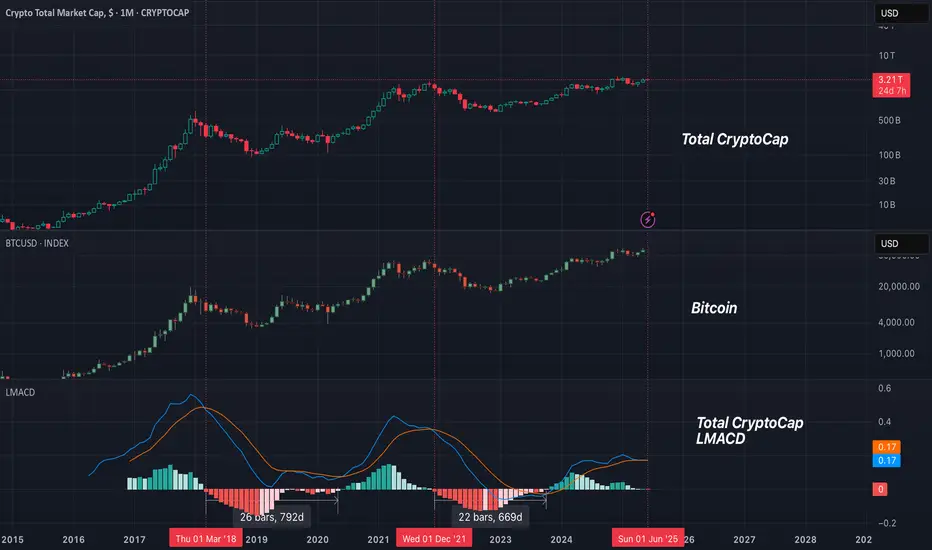
RSI suggesting a bear market comingThis is BTC and it's RSI. Bellow you can see LMACD applied on the RSI indicator to see the trend more clearly. We might be on the stage that we can see higher prices like in 2021, but the bear trend is already printed. Sell some now and buy back at 40k next year. Cheers

Crypto bull market might be ending pretty soonI am warning you that we might seeing the last days of the bull market. SO FAR histogram is printing the first red candle(we need to verify once June ends). Look what happened with btc once LMACD crossed above 0. Winter is coming.
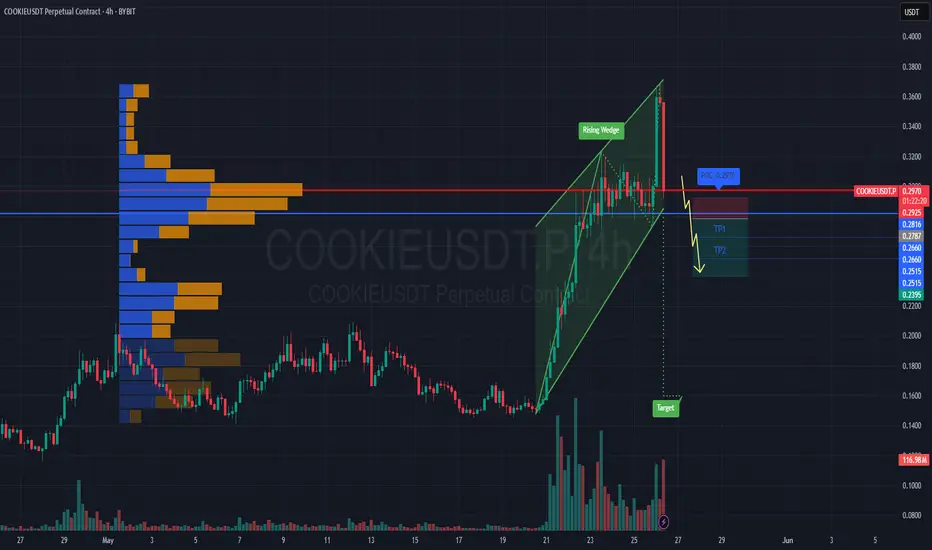
#COOKIEUSDT maintains bearish momentum📉 SHORT BYBIT:COOKIEUSDT.P from $0.2787
🛡 Stop loss: $0.2925
🕒 Timeframe: 4H
✅ Market Overview:
➡️ A Rising Wedge pattern has formed and broken down, confirming bearish momentum.
➡️ Price has broken below the wedge and the POC level at $0.2976, turning it into resistance.
➡️ Strong volume cluster at $0.2976–$0.2925 is now likely to act as a rejection zone.
➡️ Bearish pressure is visible through high-volume red candles.
➡️ Arrows on the chart indicate a continuation toward the take-profit levels.
🎯 TP Targets:
💎 TP 1: $0.2660
💎 TP 2: $0.2515
💎 TP 3: $0.2395
📢 Watch how price reacts BYBIT:COOKIEUSDT.P to TP1 — weak bounce may signal room for deeper drop.
🚀 BYBIT:COOKIEUSDT.P maintains bearish momentum — further downside expected!
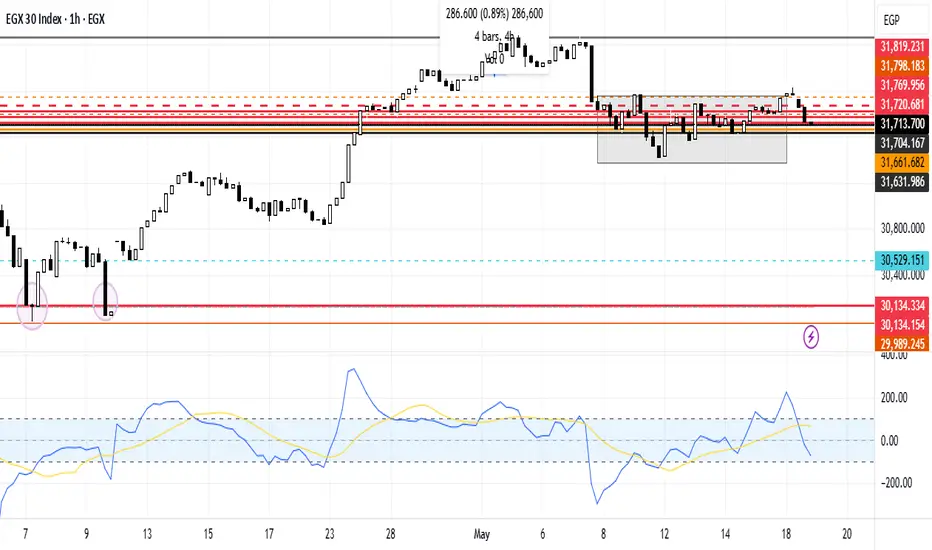
EGX30 Downward Trend Line AnalysisEGX30 stock is falling, reflecting the sellers' dominance over the buyers. In case of taking an upward trend it is expected to breach the resistance line at 31,720.681, then the 2nd resistance line at 31,769.956 then 3rd resistance line at 31,819.231 points, but in case of falling it's expected to break the 1st support line 31,704.167 then the 2nd support line 31,661.682, then the 3rd support line 31.631.986
"Nifty 50 Chart Turns Cautious: Downside Risk Builds"1. **Rising Wedge Breakdown:**
* The index had been trading in a **rising wedge** pattern (purple converging lines).
* A **bearish breakdown** has occurred, suggesting potential for further downside.
* The price broke below the lower trendline with strong red candles and rising volume, validating the bearish move.
2. **Bear Flag Breakdown:**
* A smaller **bear flag** or **descending channel** pattern within the wedge broke down as well, reinforcing bearish sentiment.
3. **Support Zone Tested:**
* Price is currently hovering around a critical **horizontal support zone** between **24,081 – 24,240**, marked with black lines.
* The index is sitting just above this zone, and a clean break below could accelerate selling.
4. **Long-Term Uptrend Line:**
* A longer-term ascending trendline lies just below the current price (\~24,050 area).
* This could act as **last-resort dynamic support** before a larger correction.
---
* **Immediate Resistance**:
* 24,240 – Minor horizontal resistance
* 24,400 – Former support now turned resistance
* **Immediate Support**:
* 24,081 – Horizontal support
* 23,900–24,000 zone – Next key demand area
* 23,700 – Long-term trendline & psychological support
---
**Volume Analysis:**
* Recent volume spike on red candles indicates **stronger participation from sellers**.
* Bearish momentum is likely to continue unless volume dries up and bullish candles appear at support.

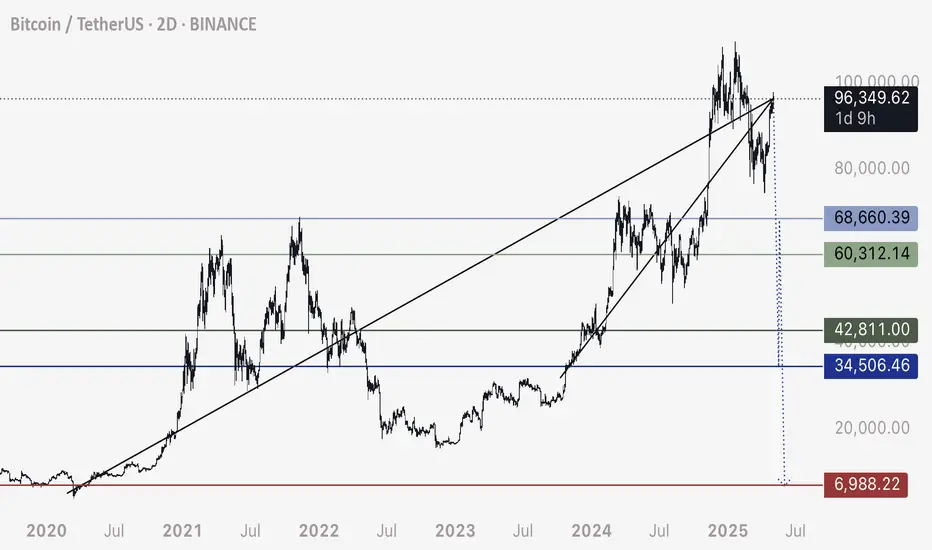
BTC - “Bull Market” OR Bearish Retest on HTF? Bitcoins excessive rise for the previous two years brings concern for the mechanics of this market. Moving only up for so long leaves much liquidity in the form of long position stop losses below the current price.
These stop loss orders, or leveraged sell orders, are an explosive chain reaction ready to set off.
Observe these two trendlines and copy them to your charts. These two bearish trendlines (in my view) are why bitcoin has truly been rising so freely.
Moves up in the form of bearish retests are fast and fluid, only after the rejection does price fall aggressively.
I anticipate two scenarios here in the realm of bearish ideas:
Possibility 1 - 30% Probability
96,700 to 34,500
34,500 retrace to 68,500
68,500 to 7,000
Possibility 2 - 70% Probability
96,700 to 43,000
43,000 retrace to 60,000
60,000 to 7,000
Note that both of these possibilities end with 7,000. I’m mapping out two routes that take us there, using confluences with trendlines, volume profiles, liquidity mapping, and common sense.
Be mindful of this possibility. And protect yourself accordingly.
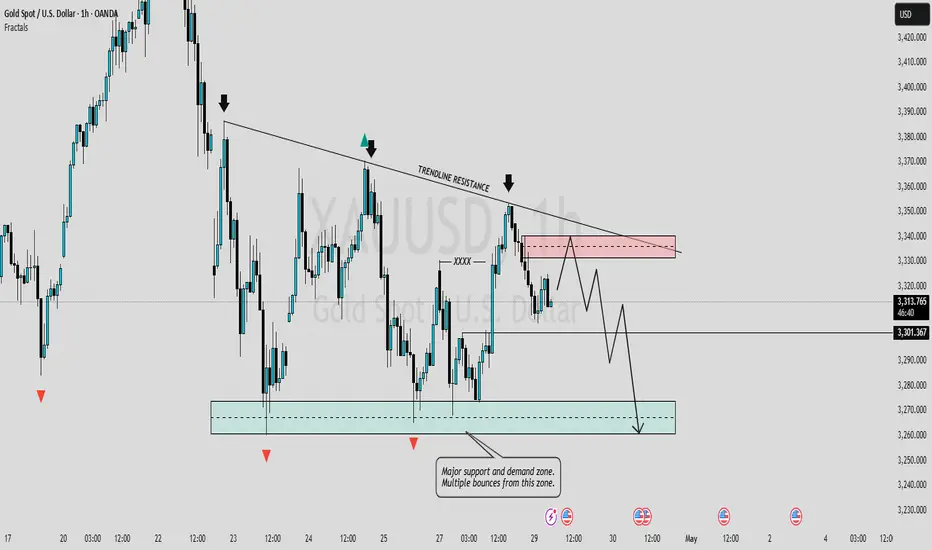
#BEARISH MOVE EXPECTEDIn this analysis we're focusing on 1H time frame for gold. In this analyze we are using downward trendline along with the combination of price action. When price enter in our supply area, so our first step is to observe how price will react and if price give any bearish confirmation then we'll execute our trade. Confirmation is very important.
Always use stoploss for your trade.
Always use proper money management and proper R:R ratio.
This is my analysis not a financial advice.
#XAUUSD 1H Technical Analysis Expected Move.
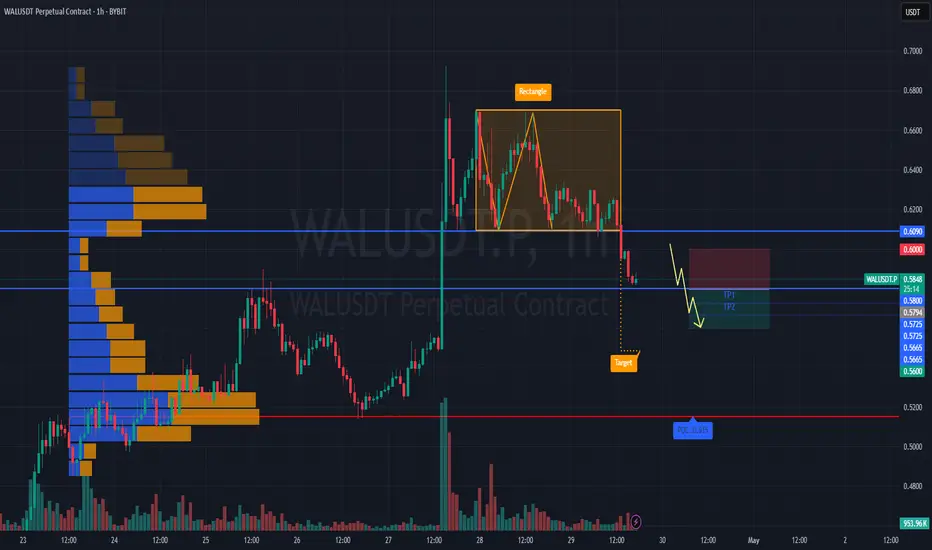
#WALUSDT continues its bearish momentum 📢 As long as the price stays under $0.6000 — short BYBIT:WALUSDT.P bias remains valid.
📢 Watch for further weakness!
📉 SHORT BYBIT:WALUSDT.P from $0.5794
🛡 Stop loss: $0.6000
🕒 Timeframe: 1H
✅ Overview:
➡️ The chart shows a clearly formed and broken Bearish Rectangle, confirming a short setup after price exited the range to the downside.
➡️ The $0.6090 support level has turned into strong resistance.
➡️ Entry at $0.5794 follows a textbook breakdown and retest structure.
➡️ Target area aligns with the volume-based support near POC $0.515, offering solid R:R.
🎯 TP Targets:
💎 TP 1: $0.5725
💎 TP 2: $0.5665
💎 TP 3: $0.5600
📢 Bearish structure confirmed with increased volume.
🚀 BYBIT:WALUSDT.P continues its bearish momentum — downside potential remains active!
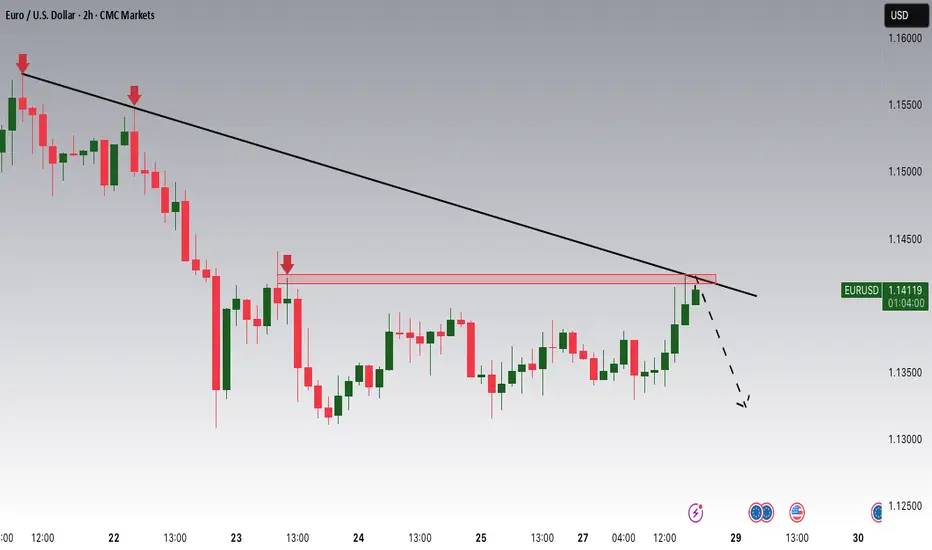
EURUSD is Switching to a Bearish Trend!Hey Traders, in today's trading session we are monitoring EURUSD for a selling opportunity around 1.14200 zone, EURUSD is trading in a downtrend and currently is in a correction phase in which it is approaching the trend at 1.14200 support and resistance area.
Trade safe, Joe.
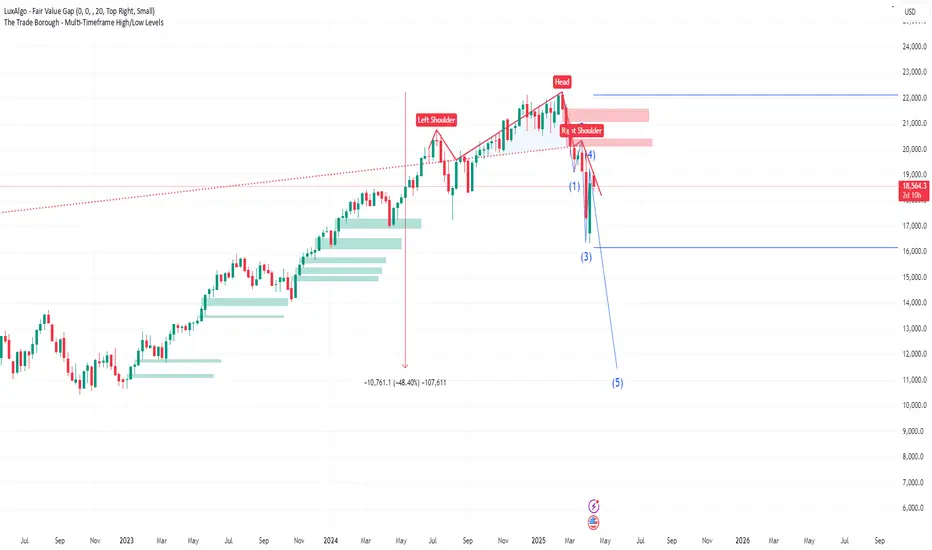
No shampoo in sight.....and an $11k Nasdaq?This posts presents an idea that has no precedence (that I can recall at least), so this is by definition a crazy idea BUT the chart is showing signs of extreme exhaustion and is possibly and quite frankly on the verge of a potentially destructive collapse.
If the recent severe volatility hasn't peaked your attention... this chart should.
It's quite simple...we have a MONSTER Head and Shoulders pattern on the Weekly TF...and we're finishing off the Right Shoulder! From a chart pattern perspective, this is ultra-ultra bearish.
The confluence we have is the Elliot Wave showing the we could be about to enter Wave 5. Elliot Waves are of course subjective BUT in this case its syncs with the Head and Shoulders.
If this was a 15min chart, most would probably agree hands down, but this is a Weekly Chart and represents Trillions on Trillions so its hard to believe that this could even be a possibility.....but I believe it could happen!
The horizontal blue lines provide 2024's High and Low Price. For this disaster scenario to be avoided, the Bulls and anyone who cares must defend 2024's low around 16100. This must not be breached, to keep the 12M bullish structure in place.
The green shaded areas highlight all of the Buy Side fair value gaps on the WEEKLY TF going back to early January 2023!
Could the market dive for these in devastating fashion? Only time will tell.
In the interim, we should trade safe and manage risk as best as we can.
Watch for a breakout from the #BANKUSDT📍 The price of MEXC:BANKUSDT.P is approaching the apex of the pattern — a breakout from consolidation is expected soon. The main scenario favors a downward breakout, with a short opportunity if confirmed.
📍 Important note: ➡️ Don’t rush the entry! Wait for a clear breakout from the pennant and confirmation of the direction.
📍 Beware of fakeouts — the key to success lies in confirmation with candle closes and volume.
📉 SHORT MEXC:BANKUSDT.P from $0.04118
🛡 Stop loss: $0.04284
🕒 Timeframe: 1H
📢 Overview:
➡️ The main structure of MEXC:BANKUSDT.P remains bearish, showing consolidation after a drop.
➡️ A break below the $0.04118 support will trigger the Bearish Pennant pattern.
➡️ Volume increase on the breakout will confirm sellers' dominance.
🎯 TP Targets for SHORT:
💎 TP 1: $0.04010
💎 TP 2: $0.03900
💎 TP 3: $0.03815
📢 Entry conditions for MEXC:BANKUSDT.P :
Enter only after a clear breakdown and candle close below $0.04118, ideally with volume confirmation.
📢 If the price holds above $0.04588, the structure may be invalidated, and the short scenario should be reconsidered.
📈 LONG MEXC:BANKUSDT.P from $0.04652
🛡 Stop loss: $0.04501
🕒 Timeframe: 1H
📢 Overview:
➡️ Price is compressing inside a Bearish Pennant, but there is still potential for a fake breakout upward.
➡️ A breakout above the pennant on strong volume may lead to a bullish impulse.
➡️ The $0.04652 level is key for a long entry after confirmation.
🎯 TP Targets for LONG:
💎 TP 1: $0.04760
💎 TP 2: $0.04870
💎 TP 3: $0.04970
📢 Entry conditions:
Enter only after a confident breakout above $0.04652 and a solid candle close (preferably with high volume).
🚀 Watch for a breakout from the MEXC:BANKUSDT.P structure and trade only in the confirmed direction. Either way — there is good movement potential and the R/R ratio is solid in both directions!

#FARTCOINUSDT is set for a bearish scenario📉 SHORT # BYBIT:FARTCOINUSDT.P from $0.7376
🛡 Stop loss: $0.7830
🕒 Timeframes: 1H + 4H
✅ Overview:
➡️ On the 4H chart BYBIT:FARTCOINUSDT.P , price broke down from the Bullish Flag, thereby invalidating the bullish scenario.
➡️ The Top 2 formation failed to break the previous high, confirming a bearish structure.
➡️ The $0.7822 level was broken and now acts as resistance — currently being retested.
➡️ The current entry at $0.7376 is optimal after a weak bounce, with high downside potential.
➡️ Volume increased on the red candles, confirming that sellers are in control.
➡️ Support levels are at $0.7172, $0.6970, and $0.6765. The main target lies near the volume-based POC at $0.5269 (in the next stage).
🎯 TP Targets:
💎 TP 1: $0.7172
💎 TP 2: $0.6970
💎 TP 3: $0.6765
📢 The bearish scenario is confirmed. A continuation of the downtrend is expected.
📢 The channel breakdown and weak bounce with declining volume are strong confirmation signals for entry.
📢 Stop-loss is placed above the rejection zone.
📢 Local VPVR and price structure confirm seller pressure in this area.
🚫 Long positions are not valid at the moment — no reversal patterns or confirmations above volume resistances.
🚀 BYBIT:FARTCOINUSDT.P is set for a bearish scenario — downward movement is the priority! Watch price action and manage your levels carefully!

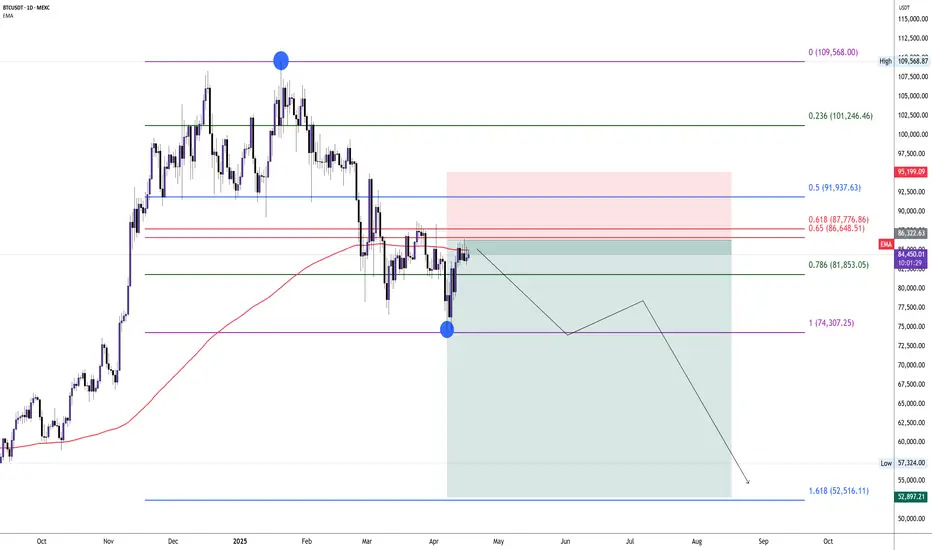
Bear market coming soon Btc goes to 50,000$2️⃣ Daily Chart (1D) Analysis
🔍 Key Observations:
Price is consolidating below EMA and inside the red supply zone (0.618–0.65 Fib).
200 EMA is acting as dynamic resistance (around $85K).
Bearish structure with a lower high formation.
💡 Interpretation:
Current price zone (~$86.3K) is a potential short trigger area.
If rejected here, price may drop first to GETTEX:82K (0.786), then $74.5K.
If price breaks above GETTEX:92K (0.5 Fib), this bearish setup is invalidated.
✅ Suggested Trade Setup
Parameter Value
Short Entry $86,300 – $87,900
Stop Loss $92,500 (above 0.5 Fib)
Take Profit 1 $82,000 (0.786 Fib)
Take Profit 2 $74,500 (1.0 Fib)
Take Profit 3 $52,800 (1.618 Fib Extension)
Risk/Reward 1:3 or better