JICPT| I got the move from 4.85 to 4.63 for SGDCNH!Hello everyone. It's been almost 11 months since I posted the idea titled 'Bearish view on SGDCNH(potential low 4.63)'. You can refer to the linked idea below.
Yep, I'm right about the direction and move. SGDCNH fell sharply by move then 2000bps since I published the idea. I can see the downtrend line is still well respected. Price seems to be consolidated for a while before making the decision. By measuring the move, the big fall has come to an end. SGDCNH is likely to rebound, however I need to see the confirmation on the chart.
As the inflation is going up, I don't think SG government will let the SGD depreciate further. The weakening SGD will hurt the purchasing power of the folks there.
Bearish Trend Line

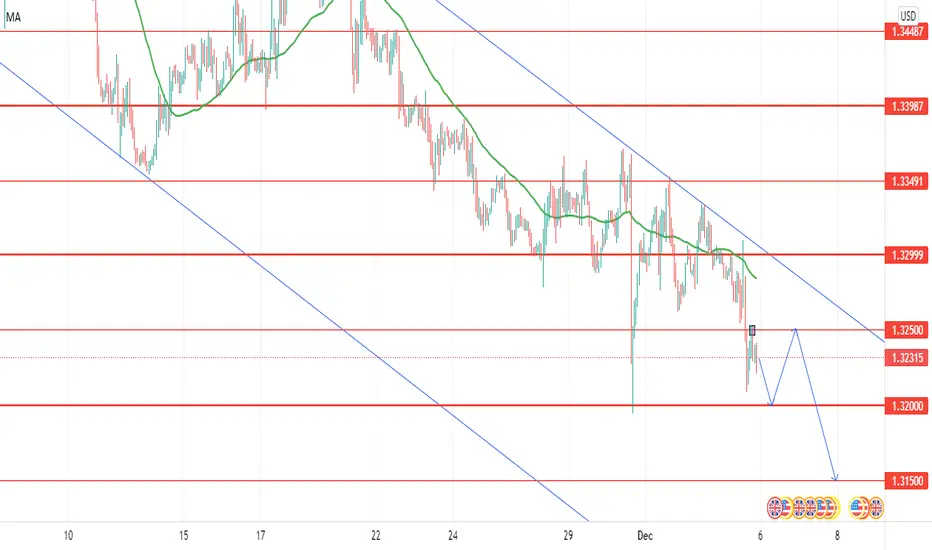
GBPUSD ON SHORTGBPUSD is on a downward trend on 4hr, 1hr and 15min timeframe so far.
A pullback on 1.32500 will see the price move down to 1.32000, forming double bottom with November 30th Lowest price caused by the Powell news.
Double bottom pattern formed at 1.32000 will drive the price up to 1.32500 to form yet another double top pattern, which will trigger the downward movement continuation to 1.31000.
Always confirm before activating trades.
Thanks
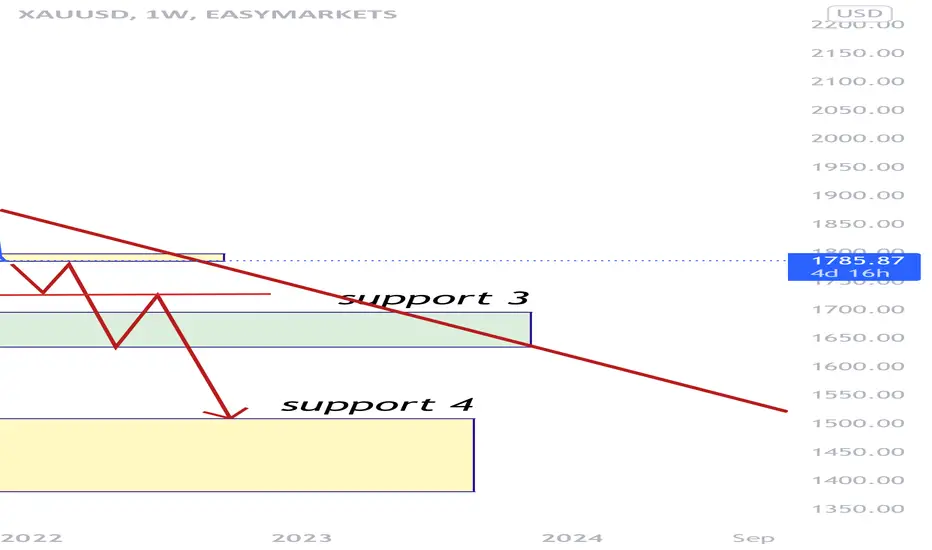
Gold is on bearish It’s a long term technical analysis for long time investment.In this analysis , I use weekly timeframe and some technical tools like fibonacci retreament, moving average and pivot points.
In the chart,I see a very strong trend on short.The first strong support is at 1635.If the first support break the price will support at 1450 area..
The price channels never lie.I’m a dumb ape, me no trade advice.
We’ve got some resolved overbought RSI, and price channel signals to boot.
Entry would be good around this range for shorts. Although if it does retest the bull channel, a short position could have a higher entry. But, that isn’t necessarily the case, we work with what we know, and for now, it looks as though this entry would be great for an 11% ROI, or 1375%+++ for my scalp homies.
Profit take - throughout the trade depending on trend angles and MA’s (primarily the 200ma on any chart) watch to see weather we’re at the top or bottom half of the regression and as long as sellers are strong, feel free to average back in.
Stop losses - should be adjusted throughout if you profit take (we all have our own strategies for this) I use Hedge mode on Binance. Stop losses on this should be tight, and we’re still in a questionable time frame, with 6mo CME puts expiring and new investors joining all the time. I also use hedging for this to smooth large price fluctuations but, if you must, use your risk management strategy to determine.
Hope y’all see something in there that is useful. ☺️
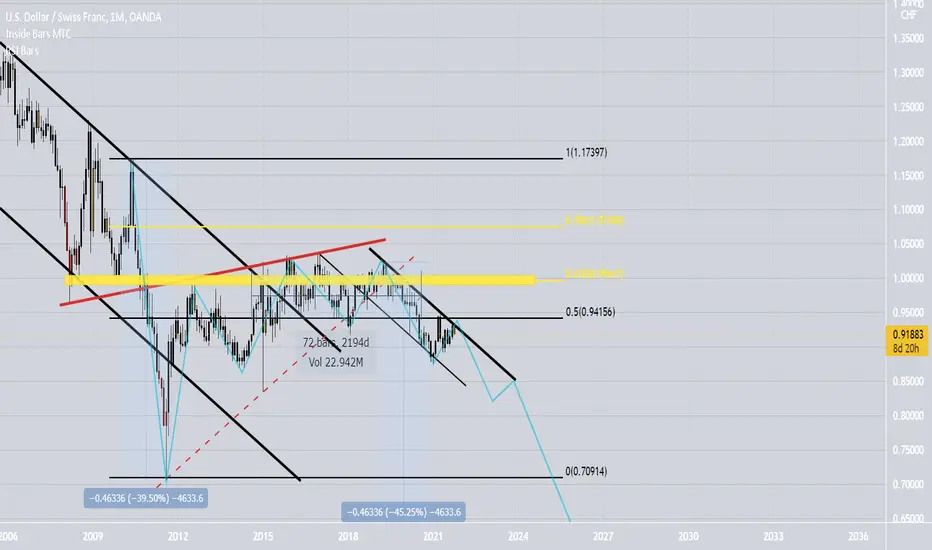
USDCHF MONTHLY RISING WEDGE USDxxx (CHF,CAD,JPY) have always been in a down trend which mainly means DXY is doing the same and if you know when to enter it could be very profitable.
Clearly a BEARISH TREND on Monthly,
Weekly the market shows a breakout of the YEARLY BEARISH TREND RESISTANCE LINE but never broke above the previous LOWER HIGH to confirm a trend reversal.
After the trend breakout we see a 6 YEAR CONSOLIDATION! Just bouncing 800+ pips from support to resistance.
As of JULY 2020 the market BROKE OUT the yearly consolidation and is now RETESTING around .9400
Im expecting continuation of trend to the downside
watchout for sell setups and just fib
TP1 .7200
TP2 .6000
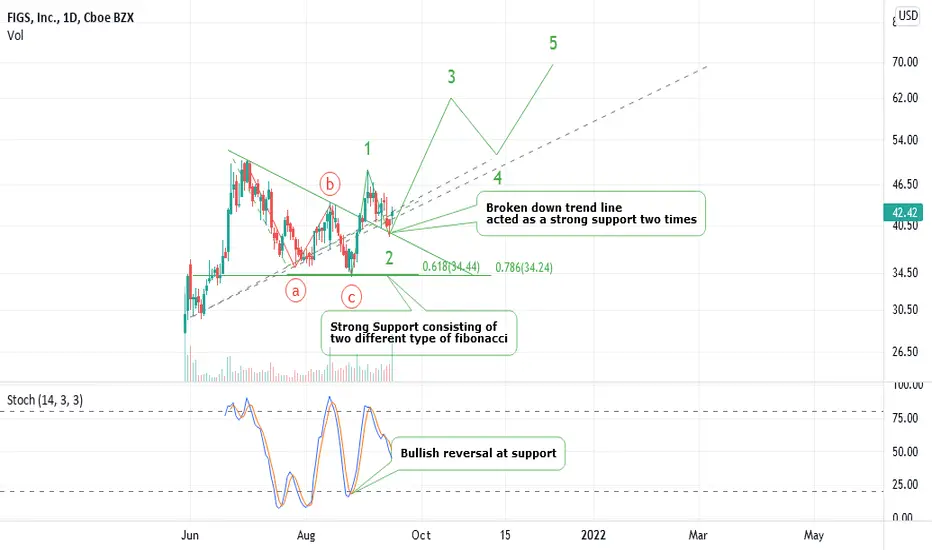
FIGS, On the way to 70 USD! Who wants to miss the chance?FIGS is going to bring us a considerable profit !. How much? lets follow the idea.
FIGS reacted nicely to strong support (34.13 USD) formed by two different types of Fibonacci after an abc form of correction shown on the chart. A considerable up ward move started after the mentioned correction which seems to be the wave 1 of a new 5 leg up going wave. After that, price retraced 61.8 % of the last move. This minor decline maybe the wave 2 of the up going wave cycle. If true, the golden wave 3 move has recently been started. Mentioned up going wave cycle which is itself a wave 3 of a larger cycle Elliott wave can push the price at least up to around 70 USD.
It is worth to note the broken down trend line acted well and nicely as strong support twice which suggests this dynamic support is a strong and valid one.
please note the beautiful bullish reversal in stochastic indicator exactly at the support. Amazing one !
Like always , despite of all these bullish signs we have to trade objectively. So we set our stop loss carefully in the case of opening a long position.
Long trade:
opening price : Current prices
Mid term target: 70
Stop loss : 39
Reward to Risk : around 8 !
Good luck every one and wish you considerable profits.
Ethereum (ETH) Not Ready for The UpsideETH / USD ANALYSIS
The Ethereum price has been able to establish the $3352 region as a strong support zone . Every drop here has been faced with aggressive buying pressure. Therefore, if it sustains above the 9-day moving average, it could potentially start to navigate back to its resistance between the $3400 and $3500 resistance levels. If the buying pressure evaporates around $3100, it could see Ethereum incur some heavy downwards momentum that sends it to the supports at $3000, $2800, and $2600.
In the meantime, it is important to note that all these losses that the coin has suffered have fundamentally changed the structure of the cryptocurrency market. Traders are to note that ETH/USD in the short term could be positioned to see a significant downside effect. Buyers should be on the lookout for $3800, $4000, and $4200 as a target to watch and a strong bullish reaction at this level is vital for Ethereum to maintain its medium-term outlook while the Relative Strength Index (14) is seen moving below 55-level.
Against Bitcoin , we can see that Ethereum is clearly bearish . Meanwhile, as the price falls, the sellers are posing an additional threat for buyers to reach the support level of 7315 SAT where the nearest target is located. However, an eventual break below the 21-day moving average may cause Ethereum to collapse.
Follow my daily charts for more ideas.
If you agree with this, follow, like and share.

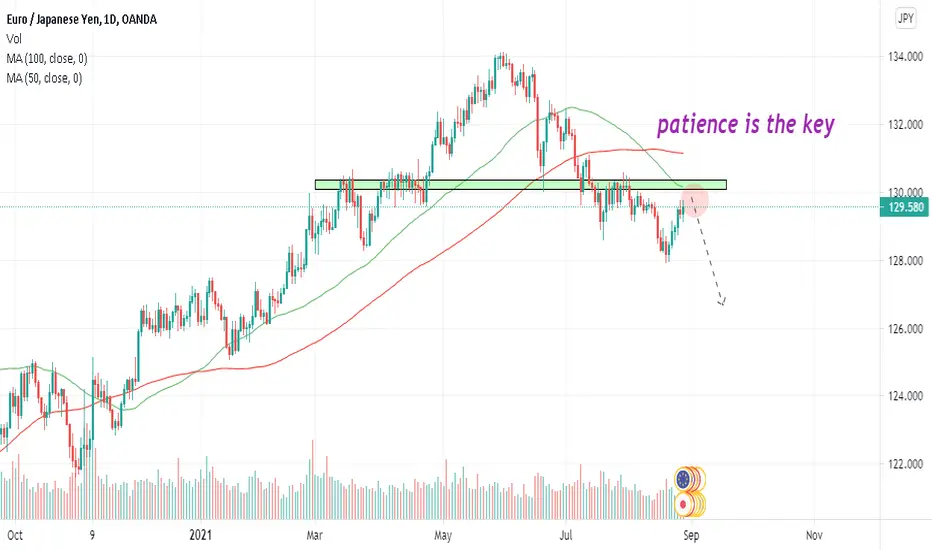
EUR/JPY Sell opportunity eur jpy broke the strong zone and went all the way down to 1.28000
now market is at broken structure to retest
look for bearish confirmation on lower time frames and enter short with your own money management
always remember that patience and discipline are the key to become profitable is Forex trading
BTC - D1 - PRIMARY DOWNTREND LINE RESISTANCE BROKEN ... BUT !Good morning to all my followers and others as well :-)
Today, we are going to carefully looking at the daily time frame where for the first time the primary downtrend line resistance has been broken
on a daily closing !
This should be seen as a positive signal but should also be considered cautiously for the time being !!!
Why ?
1) There are potential bearish divergences in progress on several indicators;
2) Lagging line has not broken the clouds resistance zone and is still in the clouds (neutral);
3) There is also a potential double top in progress.
Therefore, following the breakout above mentioned, it will not be surprising to see a pullback price action toward the former downtrend resistance line,
currently around 40'500; interesting to note that this level also coincides with the TS or conversion line @ 40'630 .
Today's closing level should already give some additional clues for the upcoming session (s).
Watch also carefully price action on shorter time frames which are already showing bearish divergences...
Should my expectation be wrong, next resistance level to look at will be on a weekly basis at :
1) 43'813 (MBB) - intraday high so far 43'960
2) 46'747 (KS)
ONLY A WEEKLY CLOSING ABOVE 46'747 WOULD NEUTRALISE THE ONGOING DOWNSIDE RISK IN OPENING THE DOOR FOR FURTHER UPSIDE TOWARDS 50'000 AND HIGHER LEVELS AHEAD OF THE HH @ 64'895
If you find my analysis value added for you please do not forget to like it and if you do not follow me yet, please, also add Ironman8848 in your following list. Many thanks in advance.
Have a great weekend, have fun and take care, all the best and may your long goes up and your short goes down :-)
Ironman8848

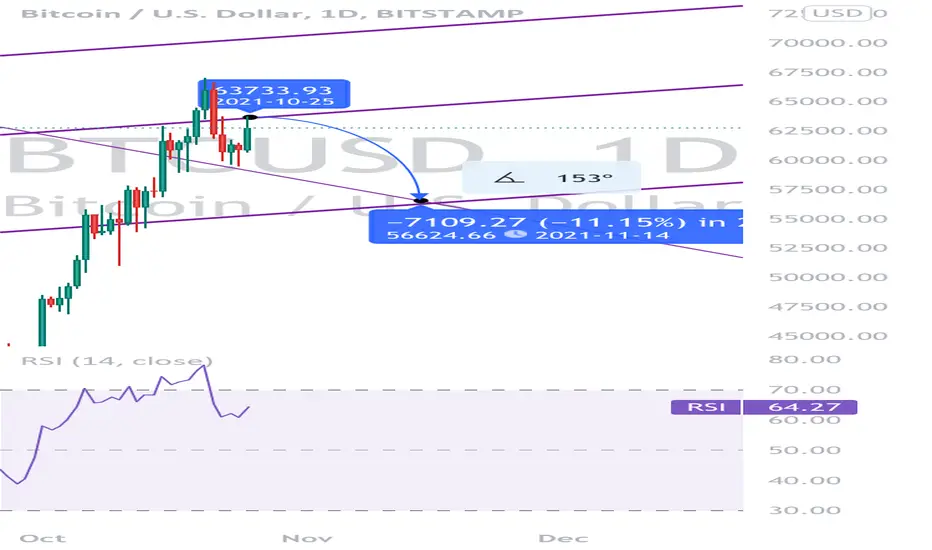
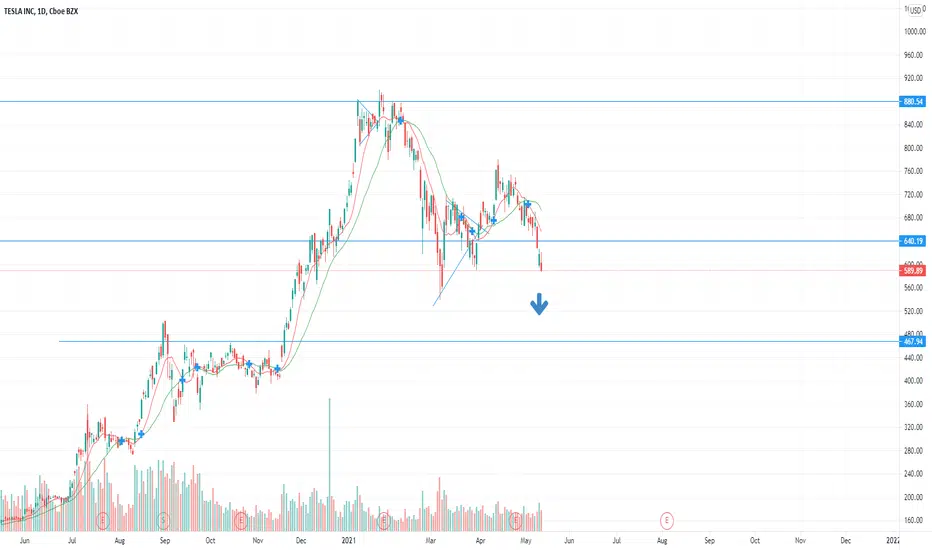
Strong Downtrend Line Hit.Super strong trendline hit. Ties in with my bearish crab thesis. (See on my profile).
Bitcoin looking good to go way lower.

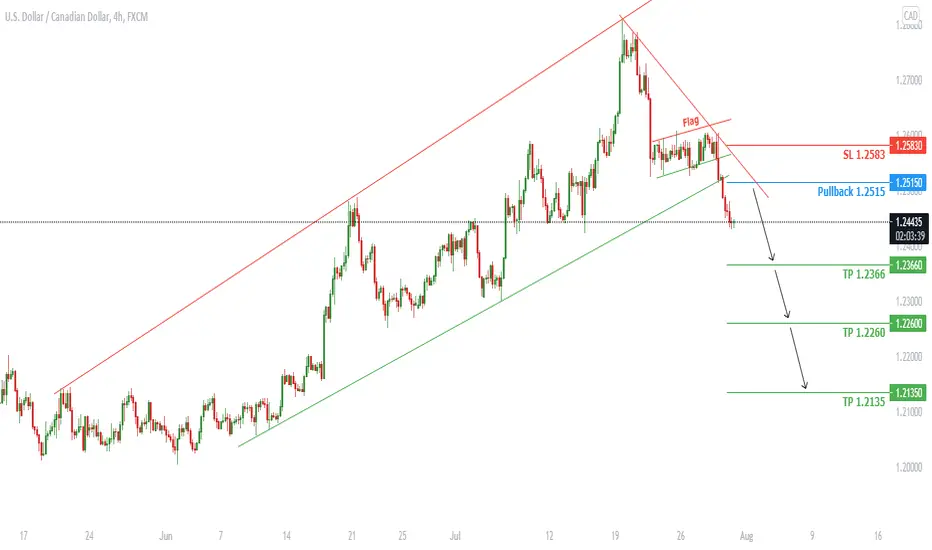
USDCAD Can Go Lower
Welcome back Traders, Investors, and Community!
Hi Traders, USDCAD it is expected to go lower after the flag breakout however it might go at Pullback area before going down.
⬇️Sell now or Sell at 1.2515
⭕️SL @ 1.2583
✅TP1 @ 1.2366
✅TP2 @ 1.2260
✅TP3 @ 1.2135
We will have more FREE forecasts in TradingView soon
❤️ Your Support is really appreciated!❤️
Have a Profitable Day
CL- going short the hard wayIt seems that my earlier trade on oil is going the way original planned. I have taken in and out several times waiting for this. False breakout after more false breakout. I always keep losses small though. Now I am in profit again and hopefully more. See prior link below for trade details.
Miss Bunny

JICPT|BABA terminated downtrend, ready to go up! Hello everyone. As I expected my previous idea of BABA, it managed to conquer the downtrend line with a higher high pattern.
What's next?
From the daily chart, it might dip a bit or go sideways to accumulate momentum before retesting the long-term MA in red color again.
I think I've listed enough reasons for the bullish setup after the weak performance of over 230 days .
With limited room to go down, my trading target is over 255.
Stay safe and trade safe! Give me a like if you're with me.
ETC Correction SignalETC was successfully hit 63$ and has been new resistance, now etc will correction down to 58$ or more

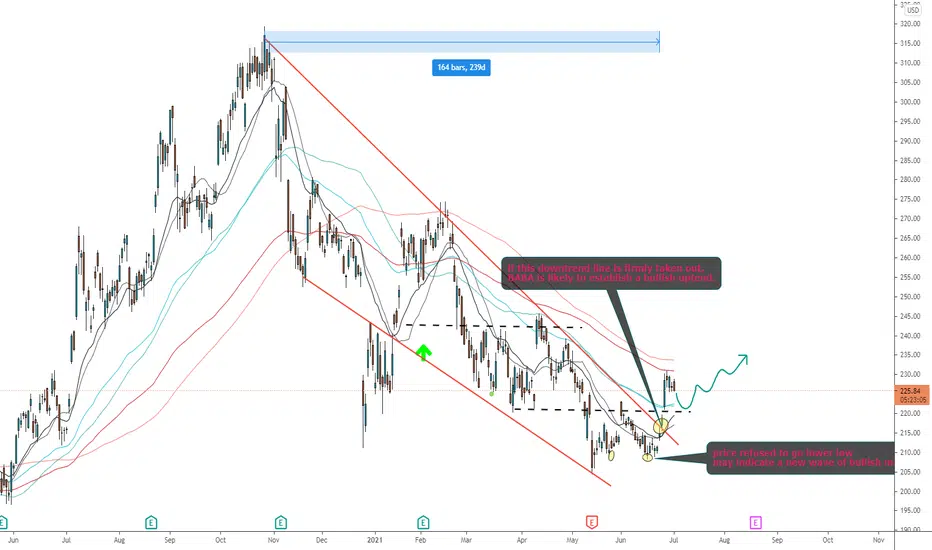
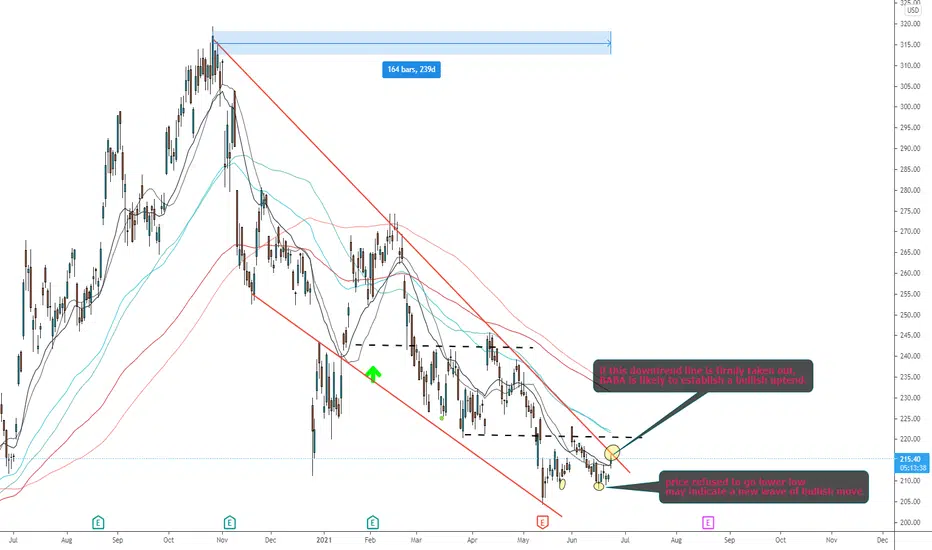
JICPT| BABA is likely to establish a bullish uptrend!Hello everyone. BABA has been down for 239 days from its historic high created last Oct.
Now, Price has dropped to weekly key structure. From the day chart, I observed that price seems to refuse to create a lower low. That suggested that momentum is accumulating to the upside.
So, price rebounded to challenge the downtrend line which BABA failed to conquer since its peak.
My trading plan is as below:
1. If the downtrend line as well as the 220 level is firmly taken out, then I will be very interested to buy long.
2. If price fails to break the downtrend line, then just wait.
What's your opinion? Give a like to support my idea.
BTCUSD is still in range tradingBITCOIN reach the bottom of range trading with a bearish trend and may break range trading.

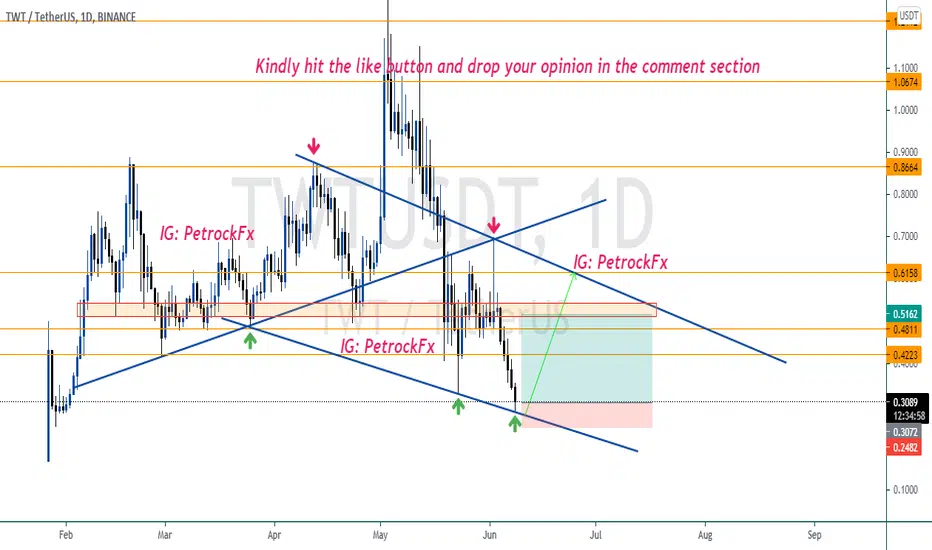
TRUST WALLET TOKEN TO RIDE BACK TO $0.5Right here is a downward channel with price testing the support trendine.
If price does not break this trendline, I expect a bullish movement back to the upper trendine (resistance).
What do you think?
Share your opinion in the comment section✍️
Please support this idea with a LIKE👍 if you find it useful🥳
Follow me to receive more updates on this pair🤙
Happy Trading💰🥳🤗
Trading Involves High Risk⚠️
Not Financial Advice💸
Use Proper Risk Management💹
Thank you for your support!💓
NB: If you would like to have one-on-one interaction with me about analysis of coins or currency, DM me.
Nice Short From Resistance LevelA simple trade;
Met with daily resistance from the channel's resistance line. The candlesticks are being more than generous this time by showing their act.
A good short, increase the stop loss a little more if you want to be more conservative, avoid any RR below 5.
Don't go for the take profit near the support channel line because the price can bounce back to a supply zone from the white rectangle as the demand is strong there.
Avoid risking more than 0.5% on the trade, apply a good risk management rule.
I will try my best to increase our capital by 10% per week.
Let's see how it goes.

BTCUSDT 1D ChartBearish trend line is strongly intact on the price action and RSI on the daily chart. Until this is broken....we go down. It's blood in the streets, won't last forever. Stay safe out there.

Further Downside for PTON?We are now around a 50% retracement level from the previous impulsive move down and coinciding with the overall trendline. Watch for bearish candles on the LTFs for possible short opportunities.

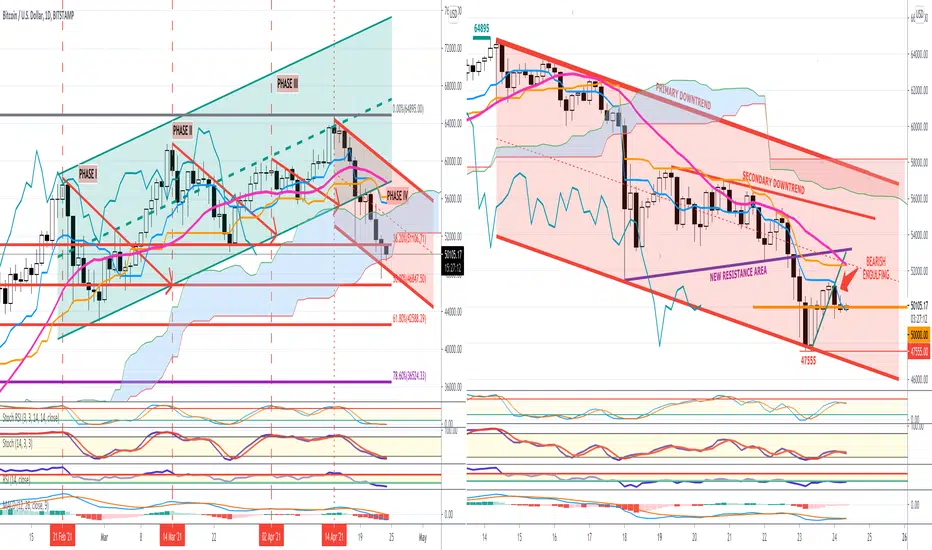
BTC - D1/H4 - ONGOING BEARISH PRICE ACTION !D1 : Yesterday's price action triggered a hammer !
Unfortunately, lack of momentum did not offer further support for a reversal upside continuation.
Indeed, today's ongoing price action is rather showing the opposite, current price action should, of course,
be confirmed by the closing level at the end of the day.
Today's closing will be very important because it may validate a clouds support breakout or not !!! and the
impact will determine the marked direction for the coming session (s).
Globally, as shown on this D1 chart, BTC switched from a former uptrend channel (in green) to a new downtrend channel (in red),
which means that the trading mode also switch from already a couple of days ! from a buy on dips to A SELL ON RALLY !!
Conclusion :
No change in my view, I still expect further downside towards 46847 ahead of 42588
In order to invalidate this expected scenario, we need to see a recovery, first of all above the clouds and more important
above the MID BOLLINGER BAND, which is, as already mentioned several times, THE LEADING INDICATOR, and which should not
be underestimated.
H4 : In a ongoing bearish price action (broad downtrend channel), with a secondary downtrend in place.
Cluster resistance being for the time being in this H4 time frame around 52400 ahead of former triangle support which became
now the new resistance area, currently around 53'200
ONLY A SUSTAINABLE RECOVERY ABOVE 53'200 (H4), WOULD FORCE TO A VIEW REASSESSMENT OF THIS EXPECTED BEARISH SCENARIO