#BITCOIN BTCUSD DROP INCOMING!!Hello Followers,
do not trust #BITCOIN #BTCUSD market manipulations,
THE truth is big drop incoming, that is the real technical analysis.
get ready to by at the price target on the chart.
GOOD LUCK and GOOD TRADES,
Thank you for trusting
MW
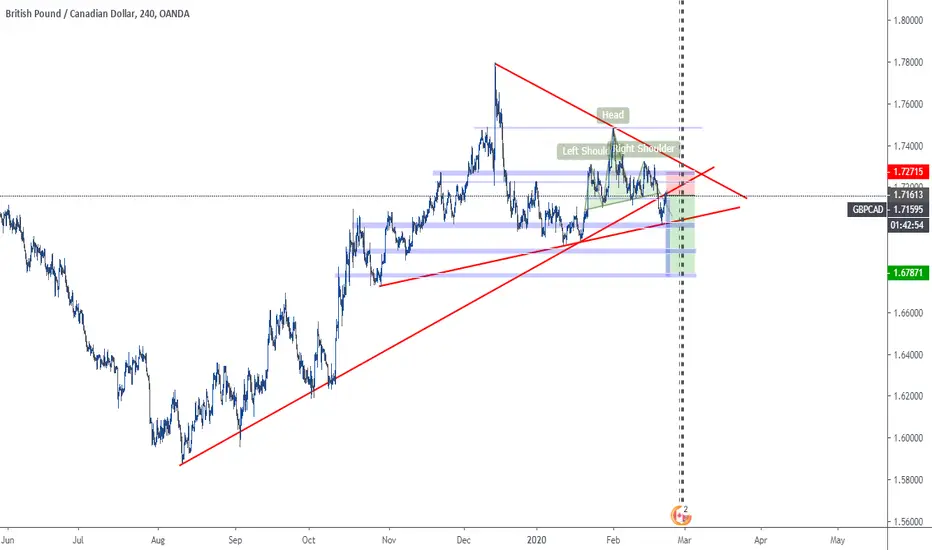
Bearish Trend Line

GBPUSD short, retest of keylevel resistance. 1.618 fib extenstioGBPUSD has formed a double top for the last few weeks, which is a bearish sign.
A weakness of the Bullish trend.
It broke the 1.2200 Support Area and bounced off around the 1.2100 area.
Currently, the cable/GU will retest the 1.2200 as a resistance, and might break it as well as the bearish trendline.
If it breaks both the trendline and the resistance, Idea is scrapped. And out of the trade.
For now I'm gonna look for short in GU and wait for more candle confirmation and rejection at the resistance, such as a bearish engulfing candle.
And a probable Take profit area is around 1.1900 which also is the 1.618 fibonacci extension.

CADJPY with an outstanding risk to reward ratio!Bearish engulfing pattern on a downtrend line for CADJPY.
Last week, JPY has been one of the weakest currencies, while CAD has been one of the strongest. In terms of market action, I normally would wait for a confirmation, since buyers have been very strong.
The opportunity offered by the risk to reward ratio (up to 1:10!) that we can get, leads me to take this trade on the bearish engulfing pattern on the key-level, without waiting for a second confirmation.
I'm planning to take part of the profits on each potential level of support highlighted by the pink rectangles.
Good luck!
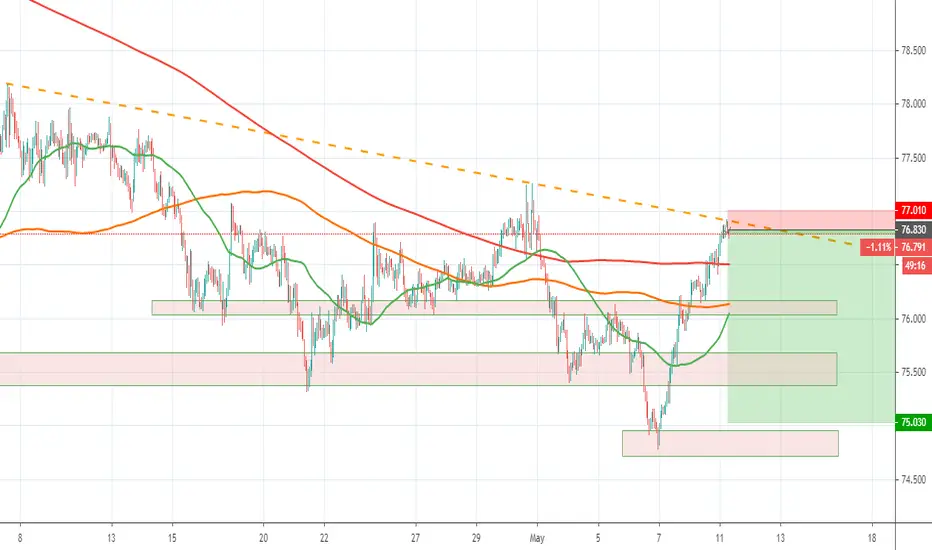
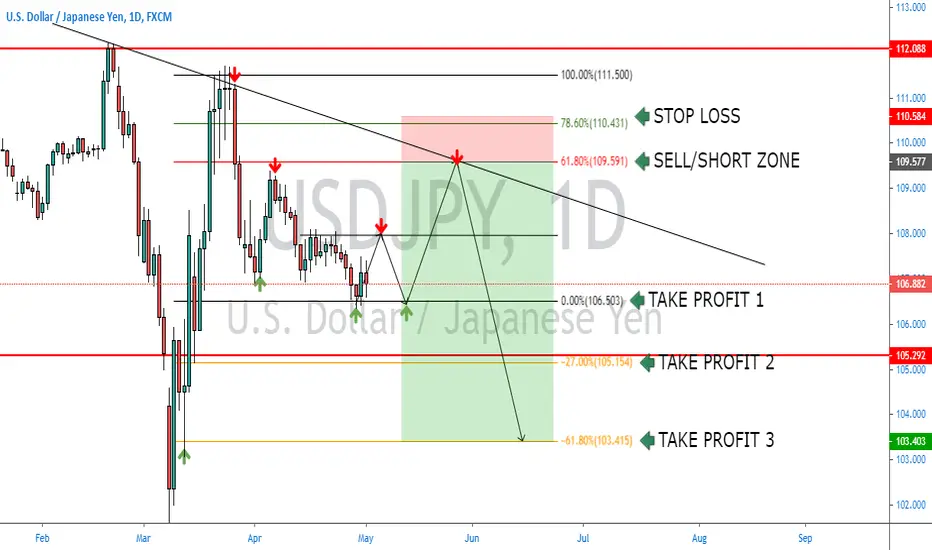
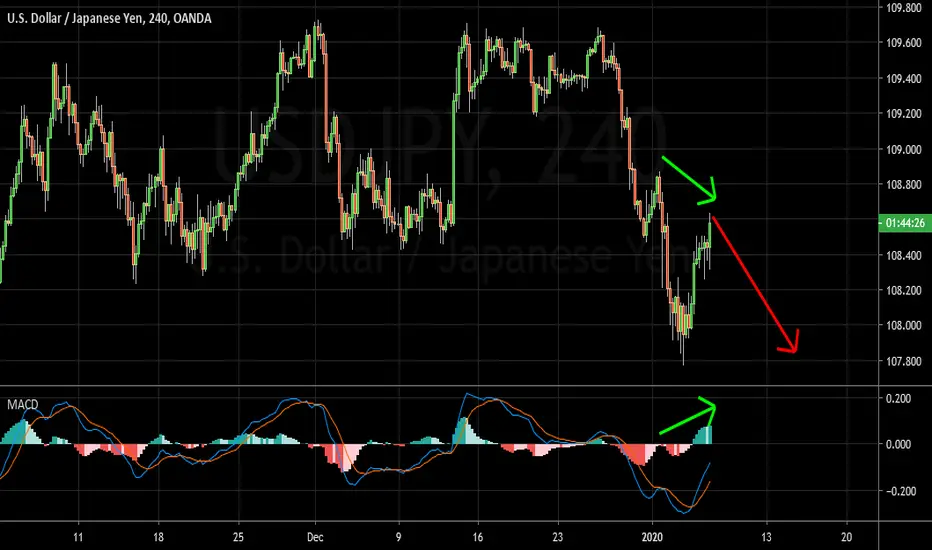
USDJPY TRADING IDEAThis is my analysis and trading plan on USDJPY i'm looking to short/sell from the 61.80 FIB retracement where the sell is indicated with several confirmations.
1. First confirmation is the double bottom that is about to form at the area of support and indication of a reversal sign with the two green arrow and fib rejection of 0.00 going for a buy/long into the sell zone heading to the 61.80 FIB to find a resistance level. In turn forming a double top indicating a clear reversal sign with the two red arrow which will cause a draw down.
2. Second confirmation, the trend is bearish so i patiently wait for my analysis to play out giving me a clear and strong confirmation to sell/short.
RISK/REWARD RATIO @ 1:6
STOP LOSS @ 100
TAKE PROFIT 3 @ 617
I welcome all comments, feedback, ideas and sharing of knowledge.
Have a great trading week!
Disclaimer: (This is for educational purpose only. Thank You.)
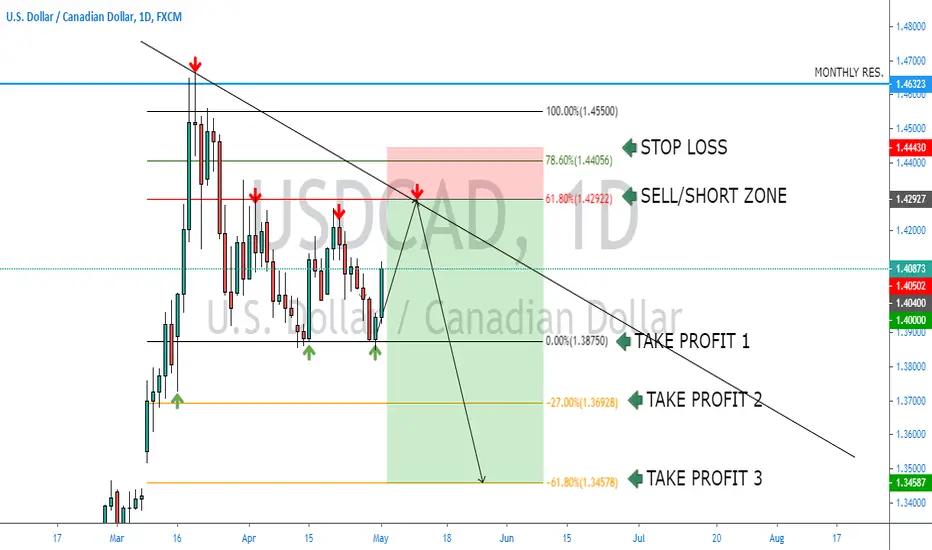
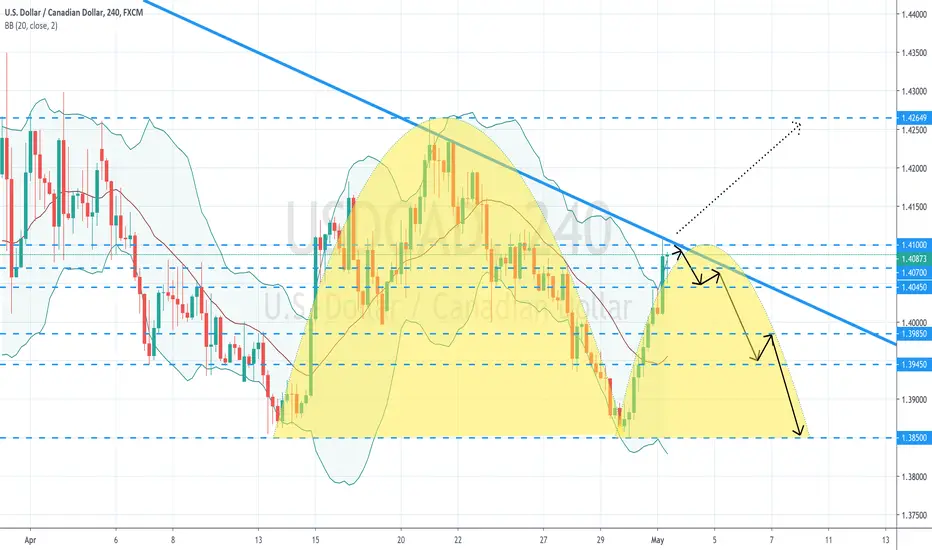
USDCAD TRADING IDEAThis is my analysis and trading plan on USDCAD i'm looking to short/sell from the 61.80 FIB retracement where the sell zone is indicated with several confirmations.
1. First confirmation is the double bottom that has already formed at the area of support and indication of a reversal sign with the two green arrow and fib rejection of 0.00 going for a buy/long into the sell zone heading to the 61.80 FIB to find a resistance. In turn forming a double top indicating a clear reversal sign with the two red arrow which will cause a drop down.
2. Second confirmation, the trend is bearish so i patiently wait for my analysis to play out giving me a clear and strong confirmation to sell/short.
RISK/REWARD RATIO @ 1:5
STOP LOSS @ 150
TAKE PROFIT 3 @ 834
I welcome all comments, feedback, ideas and sharing of knowledge.
Have a great trading week!
Disclaimer: (This is for educational purpose only. Thank You.)
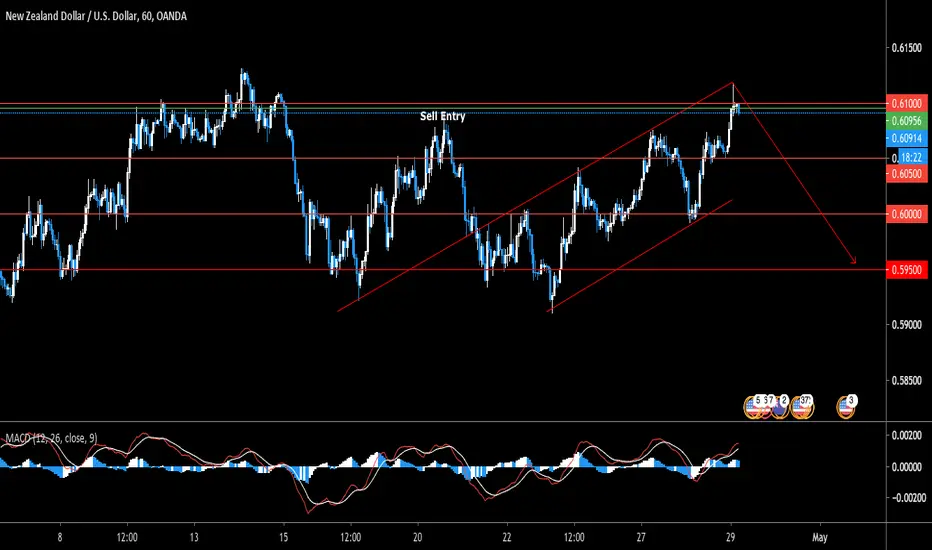
NZD/USD Sell?My current thoughts on NZD/USD
Multiple tests of resistance at 0.61000 which I think killed the bullish momentum for awhile. My thoughts is that is that the market will move down to test support around 0.59500
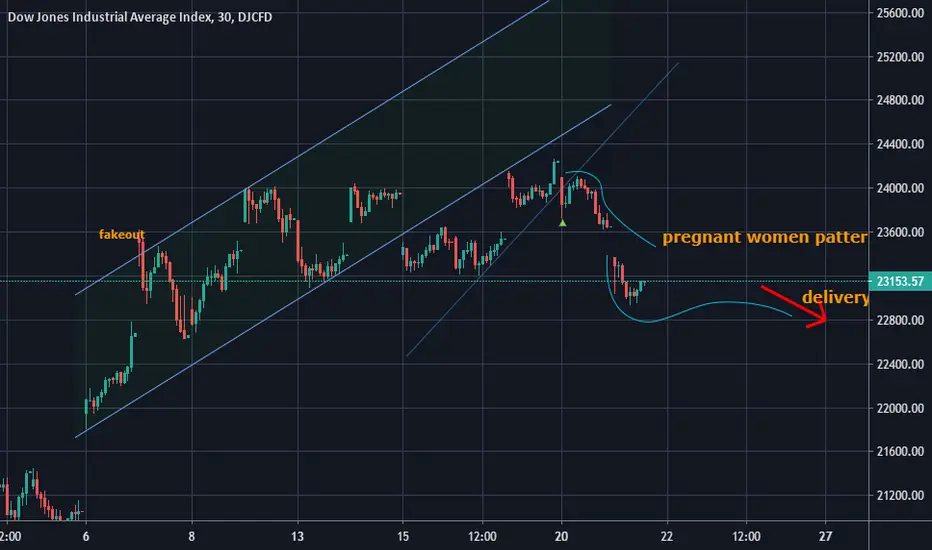
is dow going to down sideThe Upside/Downside Gap Three Methods is a three-bar candlestick pattern. The Upside Gap Three Methods pattern suggests a bullish continuation of the trend. The Downside Gap Three Methods pattern suggests a bearish continuation of the trend
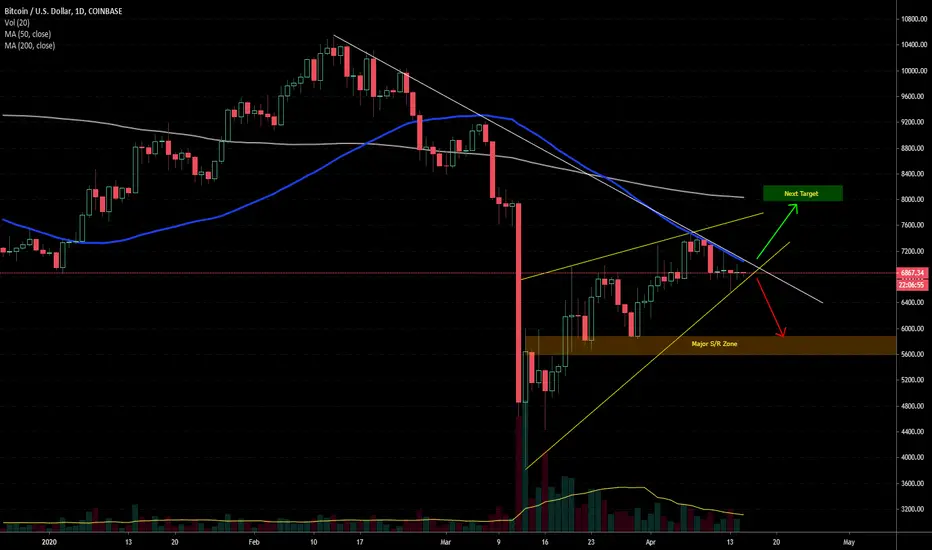
BTCUSD; A Fork in the Road BTCUSD has come to form nice Bearish Wedge on the Daily Chart. We must be very close to a direction decision as we are now being 'pushed up against the wall' of the 50MA & the huge downtrend line of resistance at the same time, both of which we have basically bumped our 'noggin' on 5 out of the 8 last days...
Also in play, what could be considered the Left Shoulder and Head have formed, now we're possibly headed down to $5800 range support for the beginning formation of the Right Shoulder.
Volume is dwindling as well. All of this looks Bearish, but the market is so tricky these days with all that's happening in the world with Economics and Pandemic issues.
Either Bitcoin will bust through the 50MA and Downtrend line and ascend to the $8000 range / 200MA area or begin to descend to $5800 support.
What's your sentiment?
Likes & Comments appreciated,
Thanks,
-HP
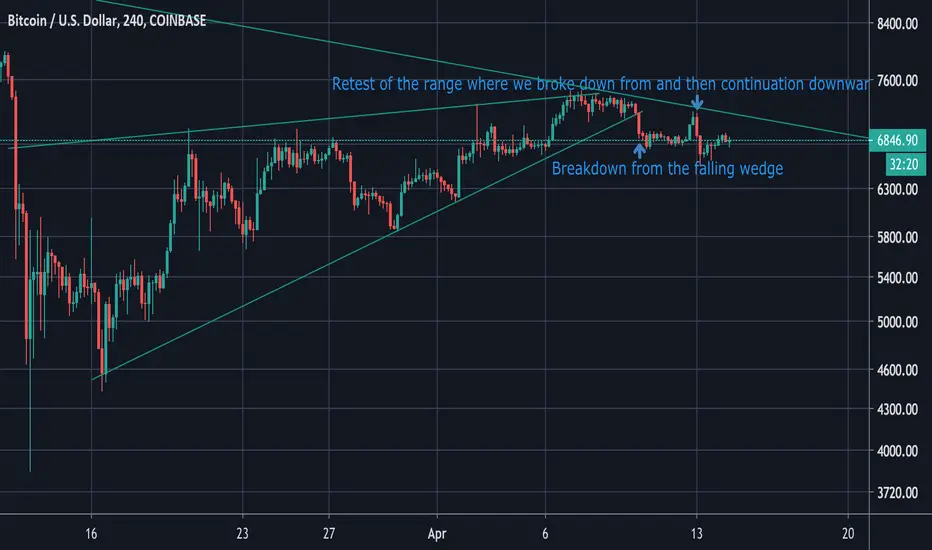
Bitcoin: The Rising Wedge ScenarioIf this scenario is to be considered, bitcoin has broken down from this rising wedge. It even went back retested and got the perfect rejection. I do not rule out another test of the breakdown and that downtrend line around the 71xx-72xx mark and that would be a very good risk-reward for a short entry. But for now, I am neutral.
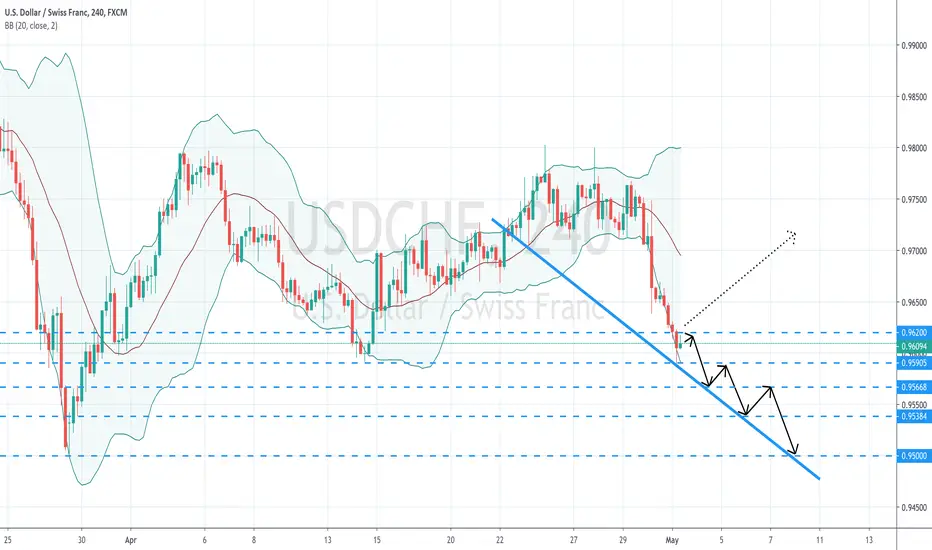
USDCHF continues it's downtrendHi traders,
As you see, we have a downtrend who has highs decreasing on the price and also on MACD wich sustain the ideea of a downtrend.
In this case we should focus to sell.
An anticipative move is to sell now and the conservative one is to sell after 0.96331 is breaked.
A first target might be 0.95034 and the next one might be 0.92541.
If your analyse match with mine, go and take the money !
I hop you enjoy it!
Remember: Don't look for fat wins because the only thing you will get is FAT.
Dow Jones Futures Rally Into ResistanceThe Dow Jones is currently up nearly $840(3.9%) to $21,785 after holding at the 23.6% Fib level upon futures market open last night. Price is currently testing the downtrend resistance line which for now is still acting as price resistance. This move comes as President Trump and VP Pence had an upbeat tone during Sunday evening’s press conference while touting declines in new cases and deaths reported out of New York and Italy which appears to be giving traders hope that the worst is over. Earlier in the weekend the next two weeks were referred to as our “Pearl Harbor” and “9/11” moment as the Surgeon General said to prepare for the worst in new cases and deaths in the U.S. Traders appear to still be trading from news headline to news headline rather than the big picture while ignoring the coming earnings apocalypse and what is expected to be another massive unemployment claims data release on Thursday. Futures markets have not been a good indication of what to expect during actual spot market trading lately so all eyes are on the Wall Street open and whether or not traders can push price above the downtrend resistance line and from there the 38.2% Fib level as those are the two key resistance levels that price needs to beat in order to break the bearish trend in price.

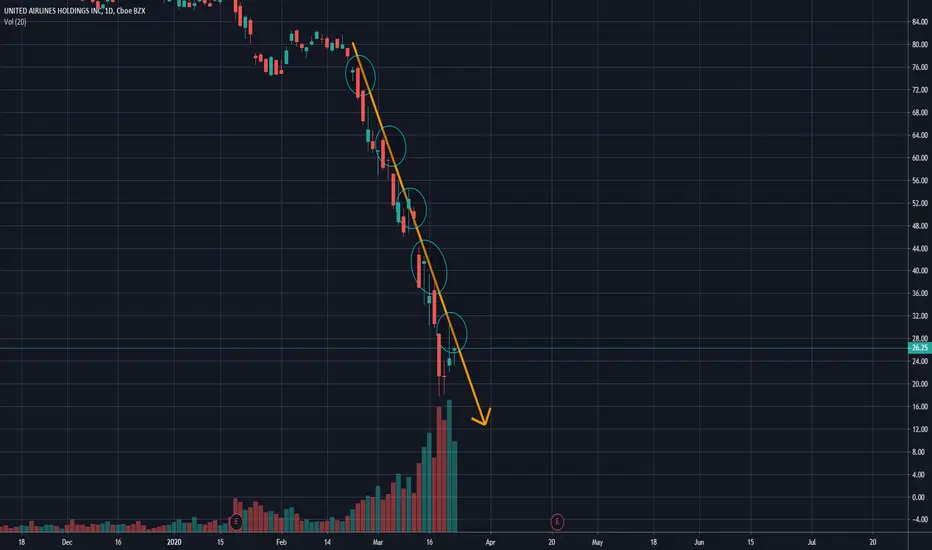
A downtrend on United Airlines.A downtrend is developing in United Airlines since the last 27 days. Until the price breaks this bearish trend line, it will drop. When the price breaks up the line and the volume confirms it, we can establish a long position, with the stop loss near to the trend line. Chart temporality: 1 day
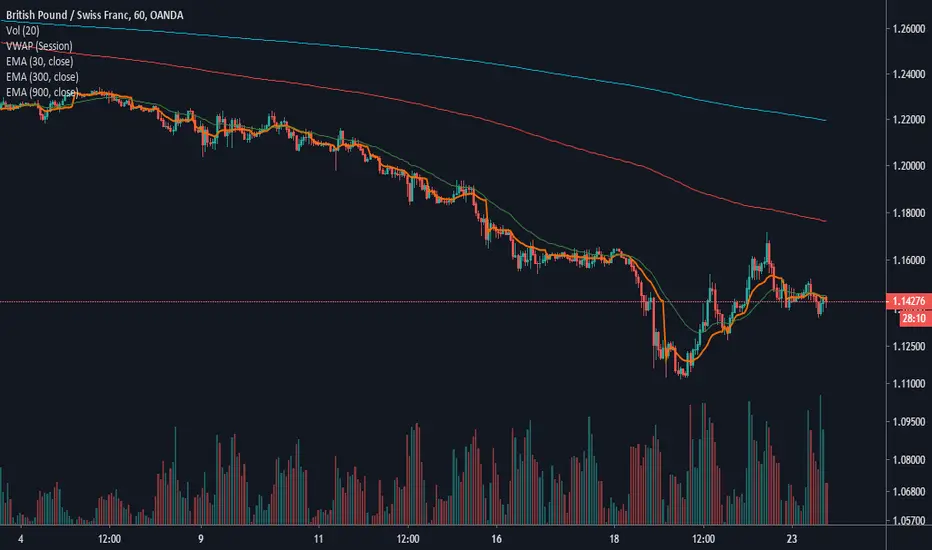
GBPCHF short entry 1HPrice is below all my moving averages, signaling price to be in a downtrend. I was awaiting a break below the 50 EMA, signaling weakness in the pullback to the upside.
Price should head to retest the bottom, potentially making a new low. the Daily chart is in a strong downtrend, so a new low is certainly possible. We are also breaking a new Weekly low, which should produce huge momentum lower.
My moving averages are harmonic in nature...
There is confluence on the RSI with the Weekly chart.
The Monthly, however, is showing divergence. Perhaps after next month, we see a bullish move to retest previous Weekly highs.
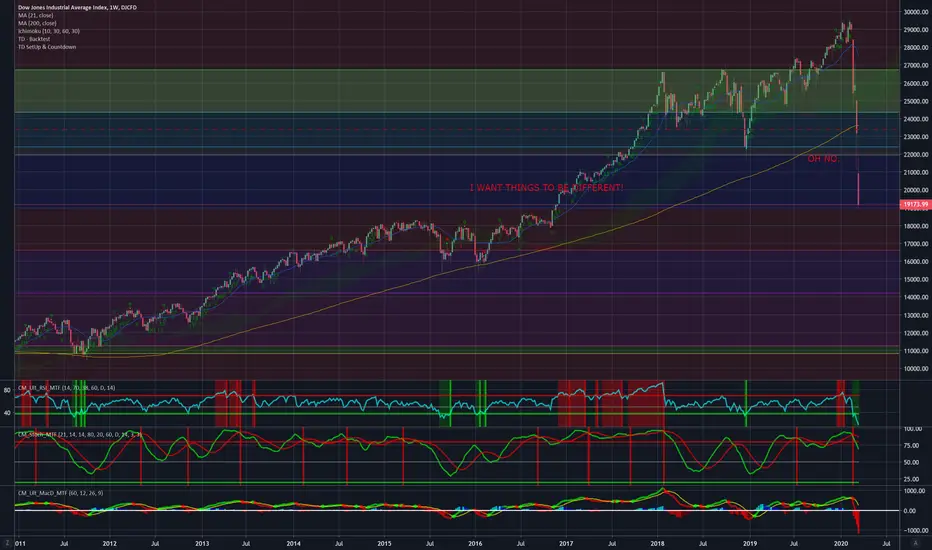
Continue to update this chart because its getting absurdWhat exactly did you all think was going to happen?
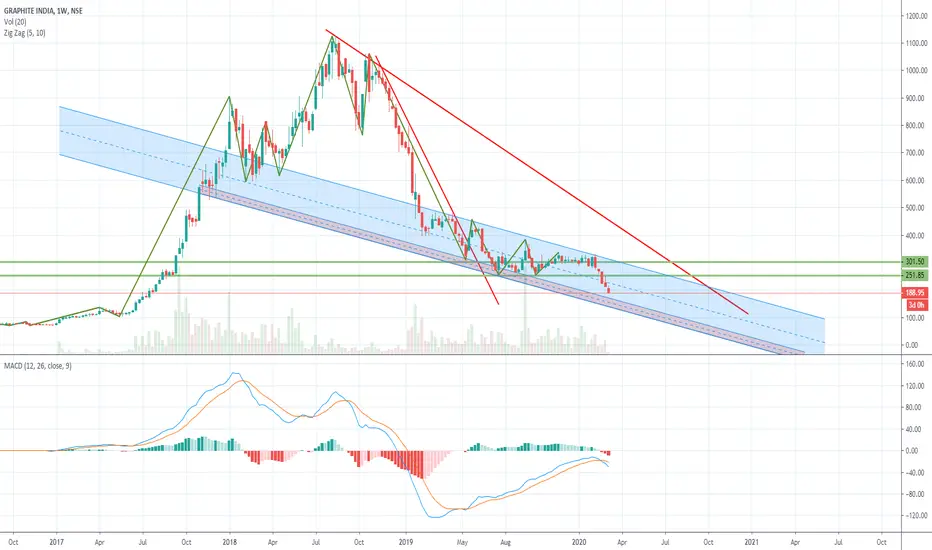
Expecting Further Downfall upto Rs.150Clear Downtrend continues
average your investments
once it breaks the parallel channel line it will goes below 100 levels
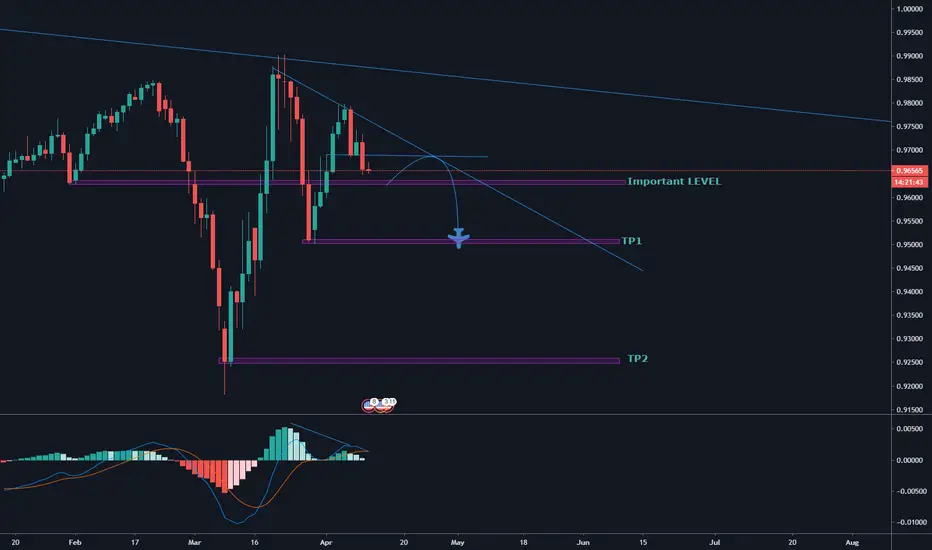
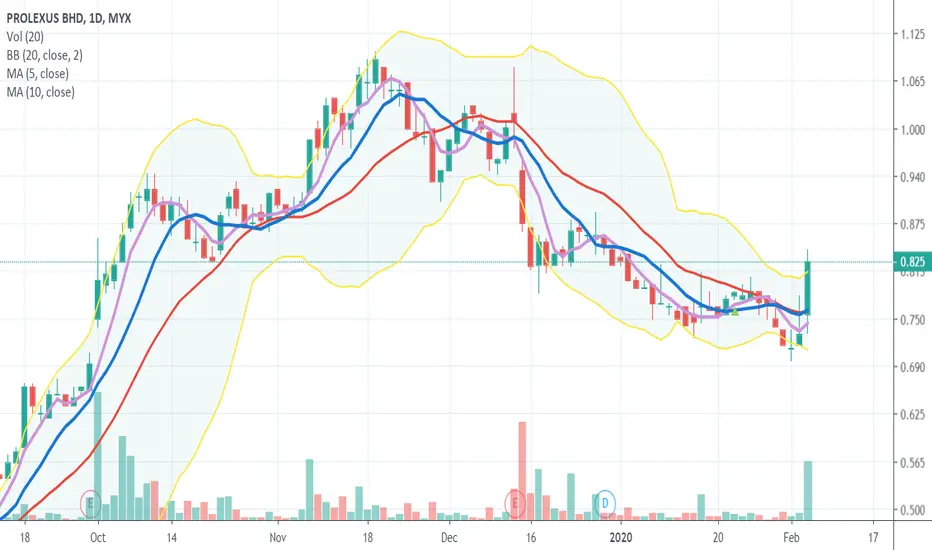
{SWC}——Prlexus, Breakout Downtrend LineThank you for your continued support :)
Strategy: Price Volume Analysis
Bias: Bullish, Prlexus was in a downtrend in the past 3 months, after reaching its peak at 1.10. Prlexus made a breakout from the downtrend line with momentum which was shown by significant volume.
If the volume and momentum sustained, SWC believes there will be a positive price movement in near term.
S: 0.780, 0.750
R: 0.850, 0.870
If you find this idea helpful, kindly drop us a like and leave your comment! Happy trading!
USDJPY Sell IdeaW1 - Price is holding below the downtrend line, bearish hidden divergence.
D1 - Price has broken below the last low and has created lower lows, currently it looks like a retrace is happening.
H4 - Bearish hidden divergence, we may now look for more evidences of bearish pressure in order to join the bears.
SDRL DowntrendSDRL has been in a large downtrend, recently it has seen a large price pump, this may be due to fundamentals however we will stick to charts. A short opportunity has opened with the recent pump, touching the downward trendline and indicative of a possible bearish reversal.

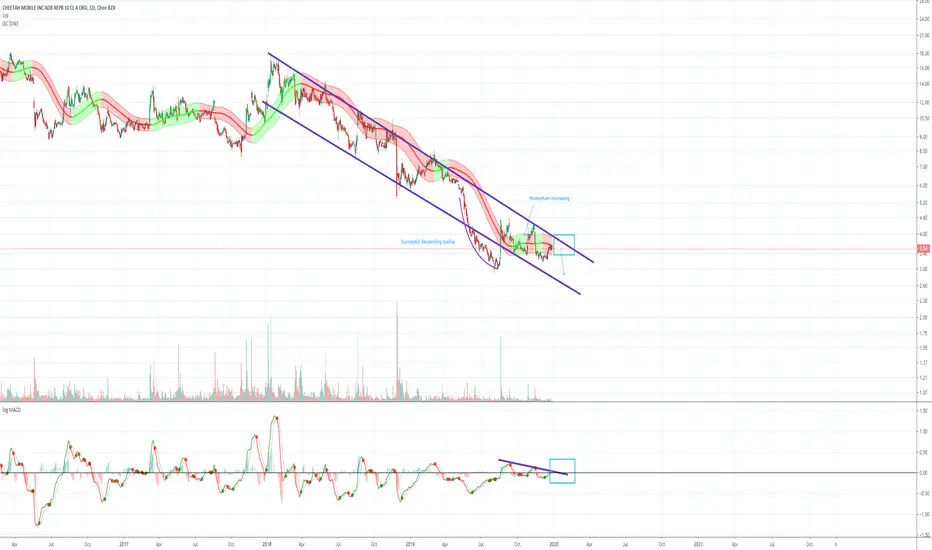
CMCM MomentumIncreasing bullish momentum for CMCM within the current downtrend, a successful descending scallop can also be observed.
26 DEC 2019 BTCUSD SHORT Hello everyone today i see a good opportunity on BTCUSD, as you can see now the trade is going up and it will reach the zone, after it will reach it the trend will reach the zone down, so we can set 3 different tp; Happy trading to all!!
tp1 7076
tp2 6859
tp3 6711
