JPY/USD Price Action & Trade Setup
Market Structure & Trend:
The chart illustrates JPY/USD on the 4-hour timeframe, showing a rising channel pattern.
Price has recently rejected from resistance near 0.0068058 and is now showing signs of a bearish move.
Trade Setup:
Bearish bias: The pair is breaking down from the channel, indicating a potential trend reversal.
Key levels:
Resistance: 0.0068058
Support Zone: 0.0064368 (Target area)
Potential Move: A continuation of this bearish movement may lead to a drop toward the support zone.
Conclusion:
If the price sustains below the midline of the channel, further downside is likely.
A retest of support at 0.0064368 could offer potential opportunities for either a bounce or a continuation of the bearish trend.
📌 What’s next? Watch for price action near the support zone for potential trade setups.
Bearishtrendlinebreak

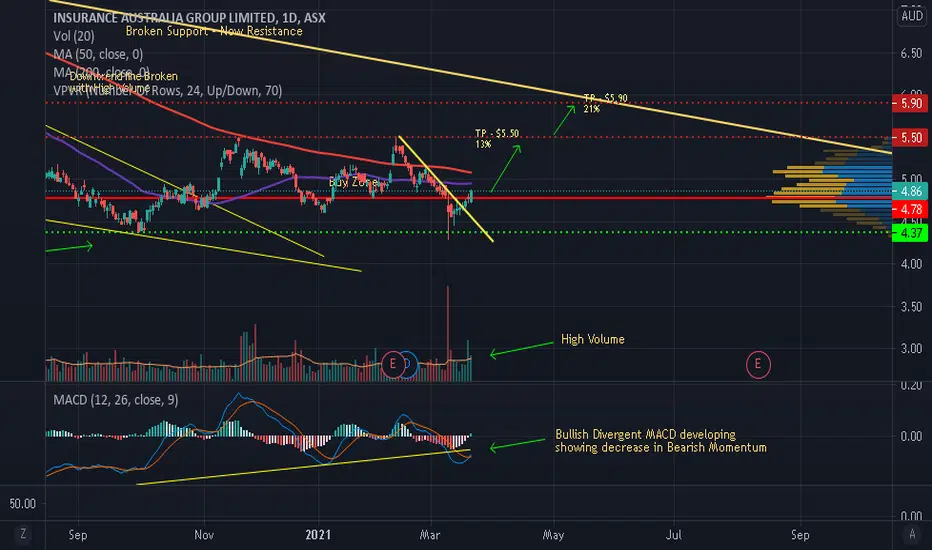
IAG - Is there a Buying OpportunityIAG seems that it has found solid support after being flushed heavily. With Bullish Price Action at Support, a break of the Bearish Trendline with very High Volume and MACD cross with Bullish Divergence makes me confident that we can cautiously buy. My Trading Plan is given below:
TP1 - $5.50 (potential gain 13%)
TP2 - $5.90 (potential gain 21%)
Stoploss - $4.20
Please note these are my own notes, by no means trading advice. Please do your own research before entering into any trade.
NST - Seems that it has found supportAfter falling hard, it seems that NST has found solid support. With the Bearish Trendline getting broken after a solid bounce, coupled with very High Volume and MACD Cross, I expect a follow through in price to the upside. I am bullish NST and expect it to move higher. My trading plan is as follows:
TP1 - $10.80 (Potential gain 10%)
TP2 - $11.80 (Potential gain 20%)
Stoploss - $8.60
Please note these are my own notes, by no means trading advice. Please do your own research before entering into any trade.

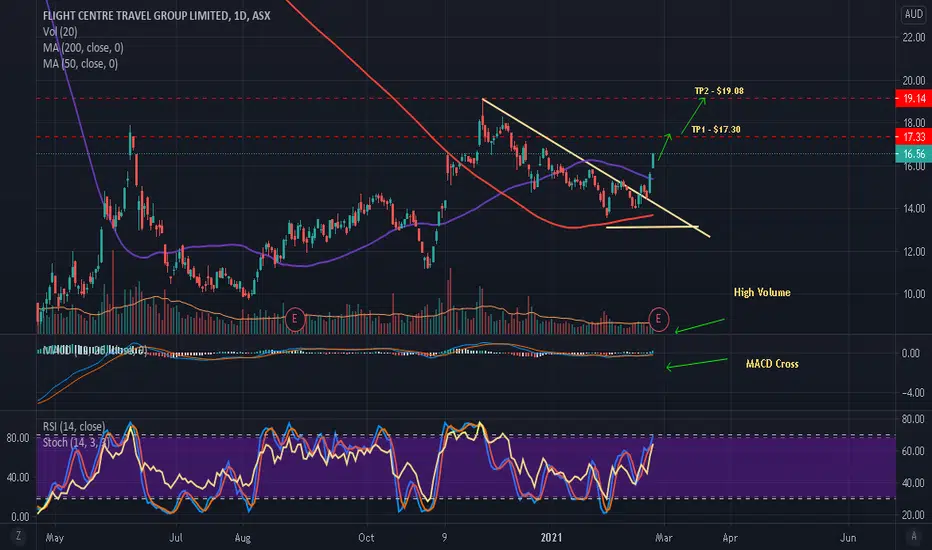
FLT - Trade PlanMy trading Bias for FLT is Bullish as it has clearly bounced off the lows (Support), with a decisive break and close above the Bearish Trendline coupled with very High Volume . MACD has given a Bullish Cross and RSI has come out of the Oversold region.
TP1 ~ $17.30
TP1 ~ $19.08
Stoploss - $13.00
Please note these are my own notes, by no means trading advice. Please do your own research before entering into any trade.
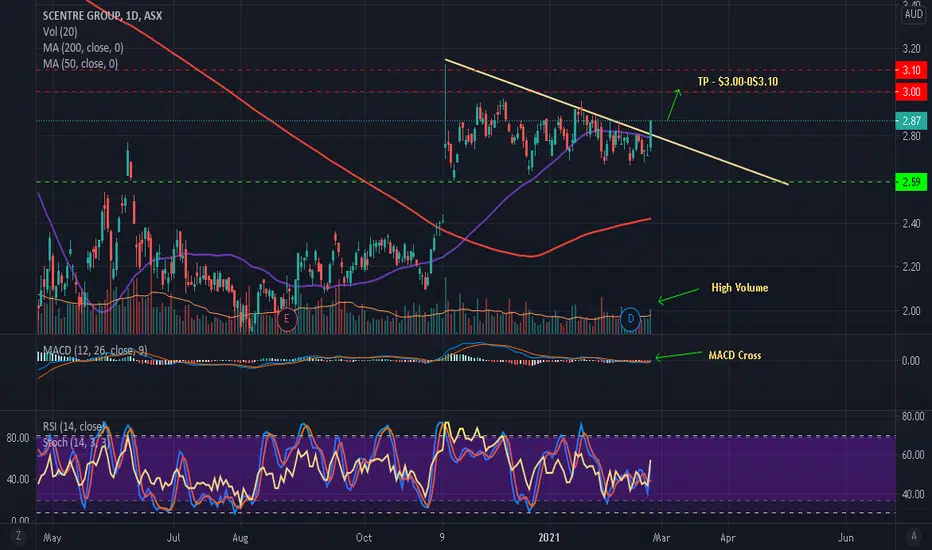
SCG - Trade PlanMy trading Bias for SCG is Bullish as it has clearly bounced off the lows (Support), with a decisive break and close above the Bearish Trendline coupled with very High Volume . MACD has given a Bullish Cross and RSI has come out of the Oversold region. I am expecting a breakout with energy, and expecting a potential 7-8% gain.
TP ~ $3.00 - $3.10
Stoploss - $2.55
Please note these are my own notes, by no means trading advice. Please do your own research before entering into any trade.
WGX - Trade PlanMy trading Bias for WGX is Bullish as it has clearly and decisively broken and closed above the Bearish Trendline coupled with very High Volume. MACD is about to give a Bullish Cross Signal and RSI has come out of the Oversold region.
TP ~ $2.40 (Potential Gain 13%)
Stoploss - $1.75
Please note these are my own notes, by no means trading advice. Please do your own research before entering into any trade.

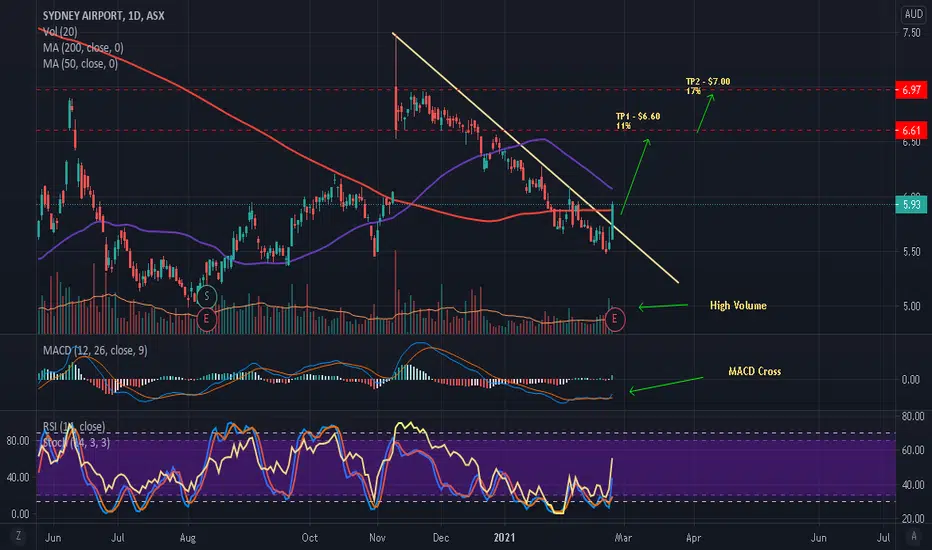
SYD - Trade PlanMy trading Bias for SYD is Bullish as it has clearly bounced off the lows (Support), with a break and close above the Bearish Trendline coupled with very High Volume . MACD has given a Bullish Cross and RSI has come out of the Oversold region.
TP1 ~ $6.60 (Potential Gain 11%)
TP1 ~ $7.00 (Potential Gain 17%)
Stoploss - $5.40
Please note these are my own notes, by no means trading advice. Please do your own research before entering into any trade.